
 StatCan COVID-19: Data to Insights for a Better Canada COVID-19 mortality rates in Canada’s ethno-cultural neighbourhoods

Archived Content
Information identified as archived is provided for reference, research or recordkeeping purposes. It is not subject to the Government of Canada Web Standards and has not been altered or updated since it was archived. Please "contact us" to request a format other than those available.
Text begins
The COVID-19 pandemic has intensified pre-existing inequities in Canadian society and has highlighted the need for disaggregated data about the ways that population groups designated as visible minorities are being disproportionately affected.
Studies in other countries like the United States have shown a significant variation in deaths attributed to COVID-19 based on neighbourhood-level social determinants of health such as age, sex, ethnicity, income and education.Note 1Note 2Note 3 However, there has been limited analysis undertaken to investigate these differences between neighbourhoods at the national level in Canada.Note 4 Population groups designated as visible minoritiesNote 5 are, for a number of reasons, at increased risk of COVID-19 infection and mortality. First, many of these population groups have higher poverty rates and are over-represented in socio-economically disadvantaged neighbourhoods.Note 6 Furthermore, Canadians belonging to groups designated as visible minorities are more likely to live in overcrowded housing conditionsNote 7 and to work in occupations associated with greater risk of exposure to the virus.Note 8
The objective of this study is to examine whether COVID-19 mortality rates were higher, during the first wave of the pandemic, in Canadian neighbourhoods characterized by higher proportions of population groups designated as visible minorities. Canadian Vital Statistics Death data, released on October 28th, 2020, are used to estimate the mortality rates presented in this study. It is important to note that these data are provisional, as some deaths which occurred during the reference period have not yet been reported.Note 9 The neighbourhood level information comes from the 2016 Census of population (see Data source for more details).
COVID-19 mortality rates were higher in Canadian neighbourhoods with a higher proportion of population groups designated as visible minorities
A total of 8,796 COVID-19 deaths have been reported to Statistics Canada between March 2020 and July 2020, for a COVID-19 crude mortality rate of 25.0 per 100,000 population. The highest number of deaths were reported from Quebec (5,806) followed by Ontario (2,550), British Columbia (187) and Alberta (179).Note 10
In order to compare COVID-19 mortality rates between communities, Canadian neighbourhoods were classified into four categories, based on the proportion of their respective population designated as visible minorities: less than 1%, from 1% to less than 10%, from 10% to less than 25% and 25% and over. Mortality rates were age-standardized, to account for the difference in the age structure of the population of the neighbourhoods.Note 11
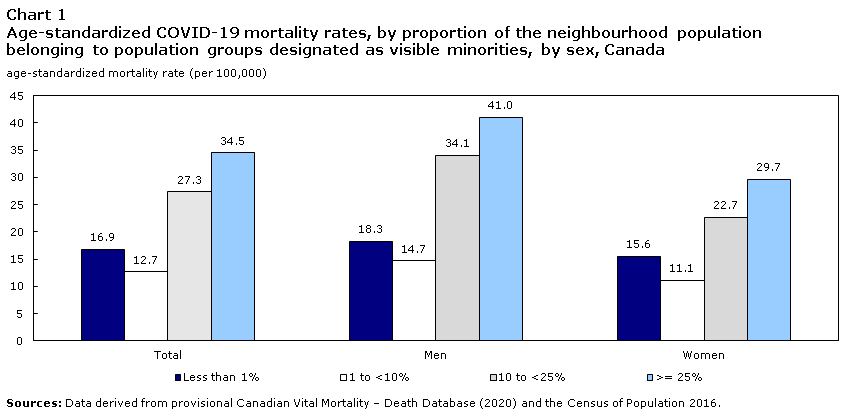
The age-standardized mortality rate per 100,000 population was higher for neighbourhoods with a higher proportion of population groups designated as visible minorities. In comparison with neighbourhoods having the lowest proportions of population groups designated as visible minorities (less than 1%), those with the highest proportions (25% or more) had a COVID-19 mortality rate about two times higher (Chart 1).
Data table for Chart 1
| Total | Men | Women | |
|---|---|---|---|
| age-standardized mortality rate (per 100,000) | |||
| Less than 1% | 16.9 | 18.3 | 15.6 |
| 1 to <10% | 12.7 | 14.7 | 11.1 |
| 10 to <25% | 27.3 | 34.1 | 22.7 |
| >= 25% | 34.5 | 41.0 | 29.7 |
| Sources: Data derived from provisional Canadian Vital Mortality – Death Database (2020) and the Census of Population 2016. | |||
Neighbourhoods’ ethno-cultural characteristics were associated with COVID-19 mortality rates in the selected provinces
The results for Canada as a whole are influenced by the important differences in COVID-19 mortality rates between the provinces, as well as the relative importance of population groups designated as visible minorities within their neighbourhoods. Quebec, Ontario, Alberta and British Columbia had the highest numbers of deaths due to COVID-19 in comparison with the other provinces in Canada.
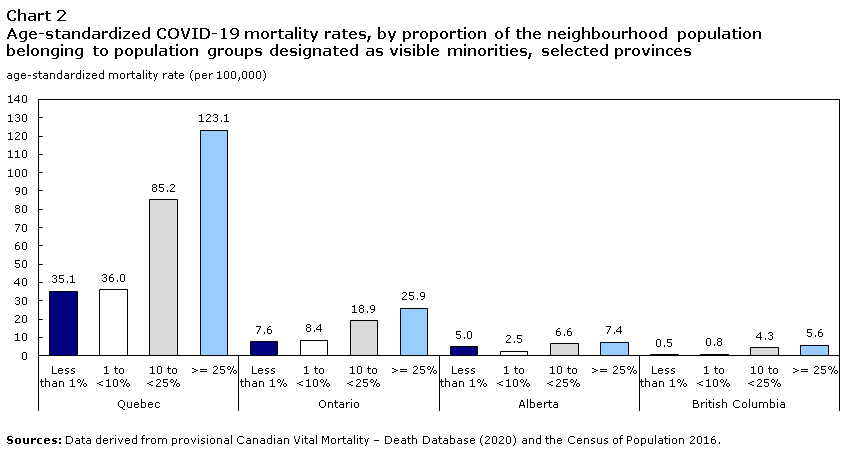
In all of these provinces, additional burden from the disease was found in neighbourhoods with higher proportions of population groups designated visible minorities. In Quebec and Ontario, the age-standardized mortality rate in neighbourhoods with the highest proportions of population groups designated as visible minorities was more than three times higher than that of the neighbourhoods with the lowest proportions of population groups designated as visible minorities (Chart 2). And although the number of deaths in British Columbia was relatively low when compared to Quebec and Ontario, the age-standardized mortality rate in that province was more than 10 times higher in neighbourhoods with the highest proportions of population groups designated as visible minorities than in those with the lowest proportions.
In Quebec, Ontario, Alberta and British Columbia, most cases and deaths were reported from the largest metropolitan areas, where the proportion of population groups designated as visible minorities is higher compared to other areas of the country. However, even when the analysis was limited to Canada’s two largest Census Metropolitan Areas, Toronto and Montréal, the conclusions were similar.
Data table for Chart 2
| Category | Age-standardized mortality rate |
|---|---|
| age-standardized mortality rate (per 100,000) | |
| Quebec | |
| Less than 1% | 35.1 |
| 1 to <10% | 36.0 |
| 10 to <25% | 85.2 |
| >= 25% | 123.1 |
| Ontario | |
| Less than 1% | 7.6 |
| 1 to <10% | 8.4 |
| 10 to <25% | 18.9 |
| >= 25% | 25.9 |
| Alberta | |
| Less than 1% | 5.0 |
| 1 to <10% | 2.5 |
| 10 to <25% | 6.6 |
| >= 25% | 7.4 |
| British Columbia | |
| Less than 1% | 0.5 |
| 1 to <10% | 0.8 |
| 10 to <25% | 4.3 |
| >= 25% | 5.6 |
|
Note: The data used to estimate age-standardized mortality rates are provisional. Provincial vital statistics offices are not all able to provide their data to Statistics Canada at the same time. This could affect some observed differences in mortality rates between these provinces. Sources: Data derived from provisional Canadian Vital Mortality – Death Database (2020) and the Census of Population 2016. |
|
Regional variation in COVID-19 related mortality rates was also related to the concentration of specific groups designated as visible minorities
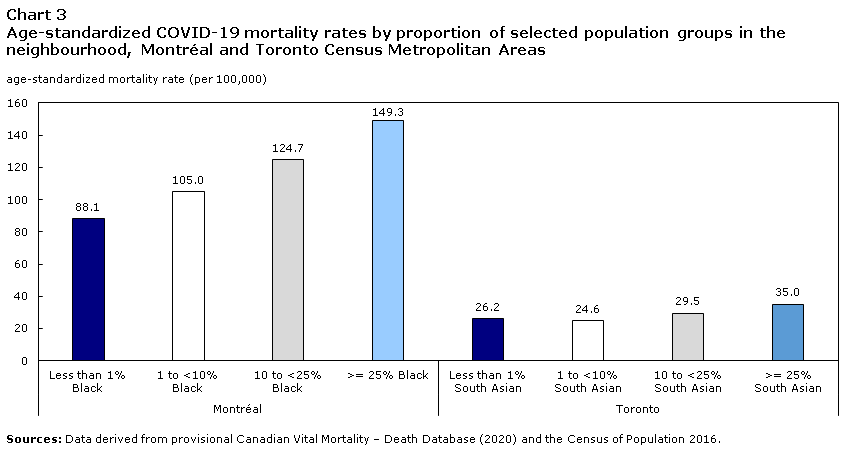
Between March and July 2020, the Census Metropolitan Areas (CMAs) of Montréal and Toronto had the highest numbers of deaths due to COVID-19. These two CMAs also have, within their respective provinces, the highest proportions of population groups designated as visible minorities. However, some specific groups represent a higher proportion of the population than others. The specific group with the highest proportion in Montréal is the Black population and in Toronto it is the South Asian population.
In order to examine the outcomes for these specific population groups, neighbourhoods in Montréal and Toronto were classified into four categories. These categories are based on the proportion of Black Canadians in Montréal and South Asian Canadians in Toronto.
In both Montréal and Toronto, there were noticeable differences in the age-standardized mortality rates depending on the proportion of the neighbourhood population who were Black in Montréal and South Asian in Toronto (Chart 3).
Data table for Chart 3
| Age-standardized mortality rate | |
|---|---|
| age-standardized mortality rate (per 100,000) | |
| Montréal | |
| Less than 1% Black | 88.1 |
| 1 to <10% Black | 105.0 |
| 10 to <25% Black | 124.7 |
| >= 25% Black | 149.3 |
| Toronto | |
| Less than 1% South Asian | 26.2 |
| 1 to <10% South Asian | 24.6 |
| 10 to <25% South Asian | 29.5 |
| >= 25% South Asian | 35.0 |
| Sources: Data derived from provisional Canadian Vital Mortality – Death Database (2020) and the Census of Population 2016. | |
Conclusion
Across the world, COVID-19 has had a disproportionate effect among certain population subgroups.Note 12 Past research pre-COVID-19 has shown that the age-standardized mortality rates vary by neighbourhoods according to ethno-cultural and socioeconomic characteristics.Note 13 The results from this study illustrate that these patterns also apply to COVID-19 mortality rates in Canada. These findings can help inform public health efforts to further protect members of population groups designated as visible minorities as the COVID-19 pandemic continues to evolve. Statistics Canada, as a national statistical agency, will continue to provide new data and insights for Canadians. For example, it will eventually become possible for Statistics Canada to provide mortality rates for specific subgroups of the population, such as immigrants and Indigenous peoples, rather than having to estimate these rates at the neighbourhood level.
Data Source
Provisional data from the Canadian vital statistics – death database and data from the 2016 Census of population profile tables were used in this analysis. Although an individual level analysis would have been optimal to understand the impact of COVID-19 on population groups designated as visible minorities, the Canadian Vital Statistics Death Database does not collect ethno-cultural information of the deceased. Therefore, neighbourhood level analysis was used.
The updated provisional dataset from the Canadian Vital Statistics Death Database released on October 28th, 2020 was used to estimate the age-standardized mortality rates. This dataset includes data from January to July 2020 based on information received from the provinces of Canada. The capacity of provincial and territorial vital statistical offices to provide their data to Statistics Canada in a timely manner varies greatly. The data used are provisional as they are not based on all deaths that occurred during the reference period, due to reporting delays. This could affect the estimated mortality rates, as well as some observed differences in mortality rates between provinces or territories. For these reasons, the provisional death counts and estimates presented may not match figures from other sources, such as media reports, or counts and estimates from provincial or territorial health authorities and other agencies.
The 2016 Census profile tables were also used to calculate the proportion of population designated as visible minority by neighbourhood. In this study, a neighbourhood corresponds to a dissemination area (DA). A DA is a small, relatively stable geographic unit composed of one or more adjacent dissemination blocks with an average population of 400 to 700 persons based on data from the previous Census of Population Program. It is the smallest standard geographic area for which all census data are disseminated. DAs cover all the territory of Canada.
Dissemination areas were classified into four categories, based on the proportion of population groups designated as visible minorities: less than 1%, 1% to less than 10%, 10% to less than 25% and 25% and over.
The term “visible minority” refers to Canadians designated as visible minorities as per the definition in the Employment Equity Act. The act defines minorities as “persons other than Aboriginal peoples, who are non-Caucasian in race or non-white in colour.” Visible minority groups include: South Asian; Chinese; Black; Filipino; Latin American; Arab; Southeast Asian; west Asian; Korean and Japanese.
Age-standardized mortality rates were calculated for each neighbourhood at national, provincial and Census Metropolitan Area (Montréal and Toronto) level.
The death database was linked to the dissemination area population using the PCCF+ file.Note 14 The aggregated population from the Census of Population 2016 was used to calculate the age-standardized rates. The direct standardization method was used to age-standardize all rates to the 2011 Census of Population with five-year age groupings.
References:
Edwards, Michael. 2019. “Housing Conditions of Visible Minority Households”, Socio Economic Analysis - Housing Needs and Conditions, CMHC/SCHL.
Greenaway, C., Hargreaves, S., Barkati, S., Coyle, C. M., Gobbi, F., Veizis, A., & Douglas, P. 2020. "COVID-19: Exposing and addressing health disparities among ethnic minorities and immigrants", Journal of Travel Medicine, 1-3.
Hou, Feng, Kristyn Frank and Christoph Schimmele. 2020. “Economic impact of COVID-19 among visible minority groups”, StatCan COVID-19: Data to Insights for a Better Canada, catalogue no. 45-28-0001. Ottawa: Statistics Canada.
Hooper, M. W., Napoles, A. M., & Pérez-stable, E. J. 2020. "COVID-19 and Racial/Ethnic Disparities", Journal of American Medical Association, 323(24), 2466-2467.
Kirby, Tony. 2020. “Evidence mounts on the disproportionate effect of COVID-19 on ethnic minorities”, The Lancet, News|Volume 8, ISSUE 6, P547-548, June 01.
Millett, G. A., Jones, A. T., Benkeser, D., Baral, S., Mercer, L., Bcyrer, C., Sullivan, P. 2020. "Assessing differential impacts of Covid-19 on Black communities", Annals of Epidemiology.
Public Health Agency of Canada and the Pan-Canadian Public Health Network. 2018. Key Health Inequalities in Canada: A National Portrait (Public Health Agency of Canada, Catalogue HP35-109/2018E-PDF). Ottawa: Public Health Agency of Canada, 2018.
Statistics Canada. 2020. The Daily. Labour Force Survey, August 2020.
Statistics Canada. 2013. Persons living in low-income neighbourhoods, Catalogue no. 99-014-X2011003.
Turcotte, Martin and Katherine Savage. 2020. “The contribution of immigrants and population groups designated as visible minorities to nurse aide, orderly and patient service associate occupations”, StatCan COVID-19: Data to Insights for a Better Canada, catalogue no. 45-28-0001. Ottawa: Statistics Canada.
Wadhera, R. K., Wadhera, P., & Gaba, P. 2020. "Variation in COVID-19 hospitalizations and deaths across New York City Borough.", JAMA, 323(21), 1-4.- Date modified: