
 StatCan COVID-19: Data to Insights for a Better Canada People living in apartments and larger households were at higher risk of dying from COVID-19 during the first wave of the pandemic

Archived Content
Information identified as archived is provided for reference, research or recordkeeping purposes. It is not subject to the Government of Canada Web Standards and has not been altered or updated since it was archived. Please "contact us" to request a format other than those available.
by Fei-Ju Yang and Nicole Aitken
Text begins
In Canada, social distancing measures were implemented in public spaces starting mid-March 2020 because COVID-19 is spread when an infected person comes in close contact with others (World Health Organization, 2020). However, social distancing can be a challenge for individuals sharing a home, especially if the space is small or there are many people living in the same space (Moos, McCulley, and Vinodrai, 2020). According to Schellenberg and Fonberg (2020), smaller residential units tend to have fewer bedrooms and living space, which can hinder the ability to practice social distancing when a family member has had contact with someone with COVID-19 or tested positive for the virus. Additionally, having many people living in a small residential unit will increase the number of potential opportunities for COVID-19 transmission.
Vulnerable populations, such as Indigenous populations or new immigrants, can be disproportionately affected by COVID-19 transmission as they are more likely to live in crowded housing (Statistics Canada, 2017a; Haan, 2012). Taken together, international studies have shown that both household size and housing characteristics matter for COVID-19 transmission and COVID-19 mortality, and it can have greater impact on vulnerable populations (Borjas, 2020; Joy et al., 2020; Moos et al., 2000).
This study uses the provisional data from the Vital Statistics—Death Database linked to the 2016 short-form Census to explore differences in the rate of mortality attributed to COVID-19 by the type of private dwelling where a person lived and the size of their household at the time of the 2016 Census. Although many of the deaths attributed to COVID-19 in the first wave of the pandemic – from March to July - occurred in long-term care homes, this article is focused on deaths associated with people living in private homes, which represents approximately 98% of the general population.Note
The results of this article are based on deaths attributable to COVID-19 occurring between January 1st and July 4th.Note Details regarding the limitations of this data can be found in the data source section at the end of the article, including the lack of information on other potentially influential socio-economic factors relevant to COVID-19.
People living in houses had the lowest rates of COVID-19 mortality
The amount of living area available will impact opportunities to isolate and distance in the home. In Canada, the total living area varies by dwelling type. In Ontario,Note single detached houses have, on average, the largest living space (1,840 square feet), followed by semi-detached houses (1,610 square feet), row houses (1,470 square feet), and apartments (862 square feet) (Statistics Canada, No Date a).
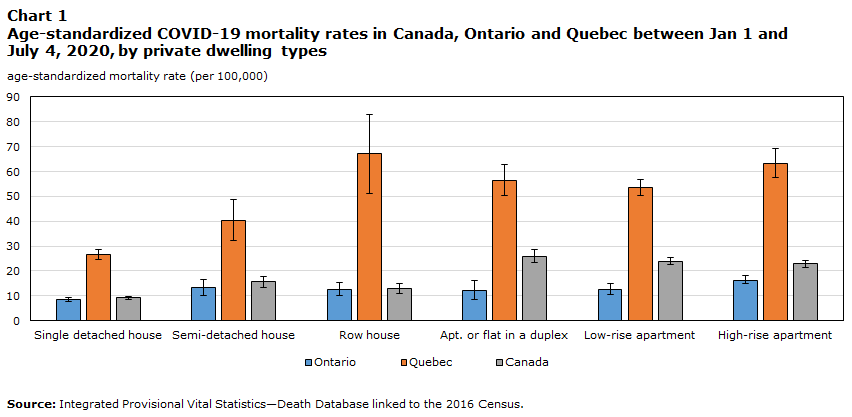
In Canada, the lowest COVID-19 mortality rates were associated with those living in single detached houses (Chart 1). There were 9 deaths associated with COVID-19 per 100,000Note in this group.
In Quebec, those living in high-rise apartmentsNote had almost 2.5 times higher COVID-19 mortality rates than those living in single detached houses (63 per 100,000 versus 27 per 100,000).
Similarly, in Ontario the COVID-19 mortality rates were almost twice as high for those living in high-rise apartments (16 per 100,000 versus 9 per 100,000). According to other studies, living in multi-residential buildings like apartments could increase the risk of COVID-19 due to the need for more frequent close contact with others and common surfaces in high trafficked shared areas like lobbies and elevators (Dietz et al., 2020; Eykelbosh, 2020).
Data table for Chart 1
| Age-standardized mortality rate (per 100,000) | |||||||||
|---|---|---|---|---|---|---|---|---|---|
| Ontario | Confidence Interval (lower 95% limit) | Confidence Interval (upper 95% limit) | Quebec | Confidence Interval (lower 95% limit) | Confidence Interval (upper 95% limit) | Canada | Confidence Interval (lower 95% limit) | Confidence Interval (upper 95% limit) | |
| Single detached house | 9 | 8 | 9 | 27 | 25 | 29 | 9 | 9 | 10 |
| Semi-detached house | 13 | 10 | 16 | 41 | 32 | 49 | 16 | 13 | 18 |
| Row house | 13 | 10 | 15 | 67 | 51 | 83 | 13 | 11 | 15 |
| Apt. or flat in a duplex | 12 | 8 | 16 | 57 | 50 | 63 | 26 | 23 | 29 |
| Low-rise apartment | 13 | 11 | 15 | 54 | 50 | 57 | 24 | 23 | 26 |
| High-rise apartment | 16 | 15 | 18 | 63 | 58 | 69 | 23 | 21 | 24 |
| Source: Integrated Provisional Vital Statistics—Death Database linked to the 2016 Census | |||||||||
Apartments in Canada, especially high-rise apartments, are concentrated in larger urban areas with a population of at least 100,000 (i.e., census metropolitan area (CMA)Note ), which could be influencing the higher morality associated with these dwelling types. High-rise and low-rise apartments accounted for 34.5% of dwellings within larger urban areas, whereas outside of these areas they accounted for 12.7% of dwellings (Statistics Canada, 2017b). During the first wave of the pandemic the national number of deaths attributed to COVID-19 was over 4 times higher in larger urban areas compared to all other areas combined.
Our results show that differences in COVID-19 mortality still exist between different dwelling types when we restrict our analysis to only large urban areas. Across CMAs in Quebec, the mortality rate was significantly lower for single detached homes compared to high-rise apartments (39 per 100,000 versus 65 per 100,000). Similarly, across CMAs in Ontario, the mortality rate for single detached homes was 10 per 100,000, while it was 17 per 100,000 in high-rise apartments. The pattern of results are therefore not only a reflection of the geographical distribution of deaths in the first wave but also a difference between types of dwellings.
Differences in mortality between people living in single homes and those in apartments could also be related to other socio-economic factors beyond the type of dwelling not covered in this study (e.g., income). The median after-tax household income varies by the type of dwelling. For single-detached houses it was $76,782 compared to high-rise apartments at $42,323 (Al-Tawil, 2019, Statistics Canada, No Date b).
COVID-19 mortality patterns by dwelling types in Ontario and Quebec did not mirror one another, as dwelling characteristics varied in these two provinces (Statistics Canada, 2017b). For example, in Quebec there are more apartments in general (45.5% in Quebec versus 30.7% in Ontario) but more high-rise apartments exist in Ontario (17.2% versus 5.3%).
Larger households were associated with higher COVID-19 mortality rates in the provinces
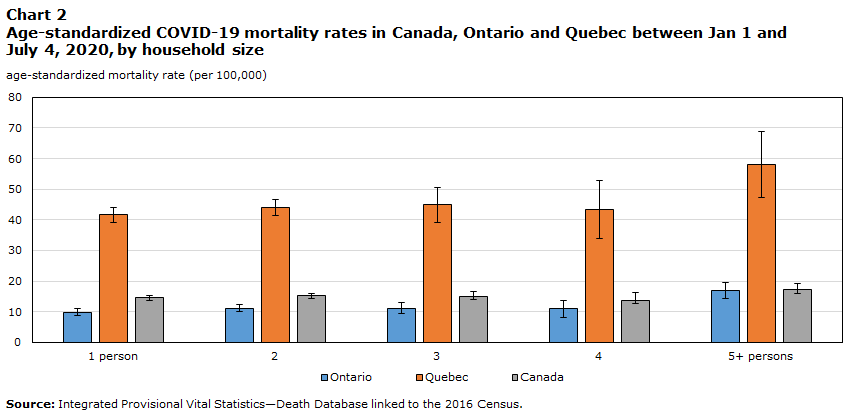
People living in larger households were generally found to be more at risk of dying from COVID-19 (Chart 2). This may be due to the fact that larger households have more potential points of contact with the virus or there are reduced options for self-isolating within the home if someone becomes sick. Nationally, the COVID-19 mortality rate for people living alone was 15 per 100,000 and the rate for those living in a household with five or more people was 17 per 100,000.
In Quebec, the mortality rate was 1.4 times higher for those living with five or more people compared to those living in a one person household (58 per 100,000 versus 42 per 100,000). In Ontario, a household of five people or more had 1.7 times higher COVID-19 mortality rates (17 per 100,000) than single person households (10 per 100,000). There were no significant differences between 1, 2, 3, or 4 person households.
Data table for Chart 2
| Age-standardized mortality rate (per 100,000) | |||||||||
|---|---|---|---|---|---|---|---|---|---|
| Ontario | Confidence Interval (lower 95% limit) | Confidence Interval (upper 95% limit) | Quebec | Confidence Interval (lower 95% limit) | Confidence Interval (upper 95% limit) | Canada | Confidence Interval (lower 95% limit) | Confidence Interval (upper 95% limit) | |
| 1 person | 10 | 9 | 11 | 42 | 39 | 44 | 15 | 14 | 15 |
| 2 person | 11 | 10 | 12 | 44 | 41 | 47 | 15 | 15 | 16 |
| 3 person | 11 | 9 | 13 | 45 | 39 | 51 | 15 | 14 | 17 |
| 4 person | 11 | 8 | 14 | 43 | 34 | 53 | 14 | 11 | 16 |
| 5+ persons | 17 | 14 | 20 | 58 | 47 | 69 | 17 | 15 | 19 |
| Source : Integrated Provisional Vital Statistics—Death Database linked to the 2016 Census | |||||||||
Data Source
This article used linked data that integrated the provisional COVID-19 death information of the Canadian Vital Statistics Death Database and the 2016 Census of Population (short-form). More information on the linkage process and on the resulting death-linked analytic file is available upon request.Note The linked database included deaths attributed to COVID-19 occurring between January 1st and July 4thNote and cause of death information.Note The COVID-19 data in this study are provisional as they are not based on all deaths that occurred during the reference period because of reporting delays, and do not include the Yukon. A small portion of the deaths attributable to COVID-19 were not linked to the 2016 short-form census and were excluded from this study. Thus, data may not match figures from other sources (e.g., media reports) or counts and estimates from provincial or territorial health authorities and other agencies.
Although the short-form Census had a response rate of 97.4% (Statistics Canada, 2017c), it contains only a limited variety of information on the population. For example, it does not contain information on visible minority status, a factor that is associated with COVID-19 mortality (Subedi, Greenberg and Turcotte, 2020). It also does not have information on housing suitability, number of rooms per private dwelling, or home ownership status,Note factors which could better measure the crowding in a household as a risk factor for COVID-19. Collective dwellings are not included in this data, which would include Canadians living in long-term care homes. These are important factors for understanding COVID-19 transmission rates.
Other provinces and territories are not included in this analysis due to the small number of COVID-19 deaths between the onset of the pandemic and July 4th. Further caution should be used when interpreting the results because socio-demographic and socio-economic information reported on the census day of 2016 might have changed over time.
References
Al-Tawil, Jumana. 2019. “Homeownership, income, and residential property values.” Statistics Canada Catalogue no. 46-28-0001. Ottawa, Ontario. Available at: https://www150.statcan.gc.ca/n1/pub/46-28-0001/2019001/article/00002-eng.pdf
Borjas, George J. 2020. “Demographic determinants of testing incidence and COVID-19 infections in New York City neighborhoods.” NBER Working Paper Series. Cambridge: National Bureau of Economic Research.
Dietz, Leslie, Patrick F. Horve, David A. Coil, Mark Fretz, Jonathan A. Eisen and Kevin Van Den Wymelenberg. 2020. “2019 Novel coronavirus (COVID-19) pandemic: Built environment considerations to reduce transmission.” mSystems, 5(2). Available at https://msystems.asm.org/content/5/2/e00245-20?fbclid=IwAR35Wg7vCwfwXxzKsHTptB8oRwfS7nnnysuvOAuYe0GW6REiJ_FNdI4RI_s
Eykelbosh, A. 2020. “COVID-19 precautions for multi-unit residential buildings. BC Centre for Disease Control.” British Columbia, Canada.
Available at https://ncceh.ca/sites/default/files/COVID-19%20Precautions%20for%20Multiunit%20Residential%20Buildings%20-%20March%2031%202020.pdf
Haan, Michael. 2012. “The housing experiences of new Canadians: Insights from the Longitudinal Survey of Immigrants to Canada (LSIC).” Ottawa: Citizenship and Immigration Canada.
Joy, Mark, Richard Hobbs, Jamie L. Bernal, Julian Sherlock, Gayatri Amirthalingam, Dylan McGagh, Oluwafunmi Akinyemi, Rachel Byford, Gavin Dabrera, Jienchi Dorward, Joanna Ellis, Filipa Ferreira, Nicholas Jones, Jason Oke, Cecilia Okusi, Brian D. Nicholson, Mary Ramsay, James P. Sheppard, Mary Sinnathamby, Maria Zambon, Gary Howsam, John Williams and Simon de Lusignan. 2020. “Excess mortality in the first COVID pandemic peak: Cross-sectional analyses of the impact of age, sex, ethnicity, household size, and long-term conditions in people of known SARS-CoV-2 status in England.” British Journal of General Practice, 70(701): 890-898.
Moos, Markus, Amanda McCulley and Tara Vinodrai. 2020. “COVID-19 and urban density: Evaluating the arguments.” Report for the Region of Waterloo. Waterloo: University of Waterloo.
Schellenberg, Grant and Jonathan Fonberg. 2020. “Housing characteristics and staying at home during the COVID-19 pandemic.” StatCan COVID-19: Data to Insights for a Better Canada. Ottawa: Statistics Canada.
Statistics Canada. 2017a. “Census in brief: The housing conditions of Aboriginal people in Canada.” Ottawa: Statistics Canada. Available at: https://www12.statcan.gc.ca/census-recensement/2016/as-sa/98-200-x/2016021/98-200-x2016021-eng.cfm
Statistics Canada. 2017b. “Census in brief: Dwellings in Canada.” Ottawa: Statistics Canada. Available at https://www12.statcan.gc.ca/census-recensement/2016/as-sa/98-200-x/2016005/98-200-x2016005-eng.cfm
Statistics Canada. 2017c. “Chapter 10 – Data quality assessment.” Guide to the Census of Population, 2016. Ottawa: Statistics Canada. Available at: https://www12.statcan.gc.ca/census-recensement/2016/ref/98-304/chap10-eng.cfm
Statistics Canada. 2020a. “Excess mortality in Canada during the COVID-19 pandemic.” StatCan COVID-19: Data to Insights for a Better Canada. Ottawa: Statistics Canada.
Statistics Canada. 2020b. “Provisional death counts and excess mortality, January to July, 2020.” The Daily. Sept 24. Available at https://www150.statcan.gc.ca/n1/daily-quotidien/200924/dq200924b-eng.htm
Statistics Canada, Canadian Vital Statistics-Death Database (CVSD). https://www23.statcan.gc.ca/imdb/p2SV.pl?Function=getSurvey&SDDS=3233
Statistics Canada. No Date a. Table 46-10-0028-01-Living area and assessment value per square foot of residential properties by property type and period of construction, provinces of Nova Scotia, Ontario and British Columbia. Available at: https://doi.org/10.25318/4610002801-eng
Statistics Canada. No Date b. Household Income Statistics (3), Structural Type of Dwelling (10) and Household Type Including Census Family Structure (11) for Private Households of Canada, Provinces and Territories, Census Metropolitan Areas and Census Agglomerations, 2016 Census - 100% Data (table). Data tables, 2016 Census. Statistics Canada Catalogue no. 98-400-X2016101. Ottawa, Ontario. Last updated, June 17, 2019.
Subedi, Rajendra, Lawson Greenberg and Martin Turcotte. 2020. “COVID-19 mortality rates in Canada’s ethno-cultural neighborhoods.” StatCan COVID-19: Data to Insights for a Better Canada. Ottawa: Statistics Canada. Available at: https://www150.statcan.gc.ca/n1/pub/45-28-0001/2020001/article/00079-eng.htm
World Health Organization, Coronavirus disease (COVID-19). 2020. “How is it transmitted?” Available at https://www.who.int/emergencies/diseases/novel-coronavirus-2019/question-and-answers-hub/q-a-detail/coronavirus-disease-covid-19-how-is-it-transmitted
- Date modified: