
Studies on Gender and Intersecting Identities
Intersectional perspective on the Canadian gender wage gap
Skip to text
Text begins
Acknowledgments
This study is funded by the Department for Women and Gender Equality.
La présente étude est financée par le ministère des Femmes et Égalité des genres.
Using data from the Labour Force Survey (LFS), this article examines how aggregate statistics of the gender wage gap (GWG) from 2007 to 2022 mask the distinct experiences of diverse groups – namely Indigenous living off-reserve (those self-identifying as First Nations, Metis and/or Inuk/Inuit), immigrants who landed in Canada in childhood (at the age of 18 or younger) and those who landed in Canada as adults (after the age of 18) compared to the wage gap among non-Indigenous men and women who were born in Canada. The focus is on paid workers aged 20 to 54 employed either full-time or part-time. Comparisons of the gender wage gap between groups of women can be made when a consistent base group of comparison is used. This article defines the gender wage gap as the difference between the average hourly wage rates of Canadian-born men and women from different groups relative to the average hourly wage rate of Canadian-born men.
- The gender wage gap narrowed between 2007 and 2022 but remained sizeable. The gender wage gap between Canadian-born men and women narrowed by 5.9 percentage points. Canadian-born women earned 9.2% less than their male counterparts in 2022 down from 15.0% in 2007. Immigrant women landing as children narrowed their gap with Canadian-born men by 4.2 percentage points from 14.7% in 2007 to 10.5% in 2022. The wage gap between Canadian-born men and Indigenous women narrowed by 7.1 percentage points from 27.2% in 2007 to 20.1% in 2022. Immigrant women landing as adults narrowed their gap with Canadian-born men by 6.5 percentage points from 27.4% in 2007 to 20.9% in 2022.
- Women from all groups ‘moved up’ in the pay distribution of Canadian-born men between 2007 and 2022. The median wage of Canadian-born women was positioned at the 41st percentile ranking of Canadian men in 2022 up from 37th percentile in 2007. The median wage of Indigenous women moved up 8 percentile rankings to the 33rd percentile ranking of Canadian-born men. The median wage of immigrant women landing as adults ranked the lowest at the 28th percentile of the pay distribution of Canadian-born men in 2022 up 6 percentile rankings from 2007.
- Women from the lower end of their wage distribution made more progress than women from the upper end. At the lower end of their pay distribution (5th percentile), women from all groups faced a smaller and more similar wage gap in 2022 than in 2007. For example, at the 5th percentile, Canadian-born women earned 2.8% less than Canadian-born men in 2022 compared to 12.1% in 2007. Similar numbers are reported for immigrant women landing as adults. Indigenous women and immigrant women landing as adults made the most gains. Indigenous women narrowed the wage gap by 11.2 percentage points from 17.5% in 2007 to 6.3% in 2022. Immigrant women landing as adults reduced their wage gap by 13.7 percentage points from 20.0% in 2007 to 6.3% in 2022. At the upper end of their pay distributions (95th percentile) in 2022, Indigenous women (23.8%) and immigrant women landing as adults (20.1%) faced larger pay gaps than Canadian-born women (12.9%) and immigrant women landing as children (11.3%). This is little changed from 2007.
- Indigenous women and immigrant women landing as adults faced larger gender wage gaps than Canadian-born women and immigrant women landing as children. This is consistent along most dimensions such as full-time or part-time status, education level and private or public sector.
- Women from all groups have strengthened their labour market qualifications which contributed to the narrowing of the gender pay gap in Canada.
- Indigenous women doubled the proportion of their workforce with a bachelor’s degree or above from 12.5% in 2007 to 24.8% in 2022. In addition, Indigenous women lowered their incidence in jobs starting within the last 12 months from 29.9% in 2007 to 21.7% in 2022 and increased their average job tenure to 6.7 years in 2022 up from 5.5 years in 2007.
- Canadian-born women and immigrant women landing as children were more likely to work in professional occupations than Indigenous and immigrant women landing as adults in 2007 and this gap grew by 2022. In 2022, 31.0% of Canadian-born women and 33.6% of immigrant women landing as children worked in a professional occupation, up from 22.0% and 21.0% in 2007. In comparison, 26.1% of immigrant women landing as adults and 22.9% of Indigenous women worked in professional jobs in 2022, up from 17.8% and 15.1% in 2007.
- Women’s relative improvements in human capital such as education, longer job tenure, and full-time employment played a smaller role in the narrowing of the wage gap than job characteristics. These factors explained 19.6% of the narrowing gender wage gap for Canadian-born women, 14.5% for Indigenous women, 27.6% for immigrant women landing as children and 19.9% for immigrant women landing as adults. Changes in industry and occupation explained a substantial fraction of the decrease in the gender wage gap between 2007 and 2022. This proportion varied by group ranging from 30.6% for Indigenous women to 74.2% for immigrant women landing as adults.
- The LFS data is used to show how much of the gender inequality in wages is accounted for by men and women working in the same ‘job’ defined as working in the same occupation in the same industry. When Canadian-born women worked in the same ‘job’ as Canadian-born men, they earned 9.2% less than their male counterparts in 2022. The within-job gender wage gaps were similar for Indigenous women (9.3%) and immigrant women landing as children (9.6%) in 2022. In the same year, immigrant women landing as adults faced the largest within-job gender wage gap (20.4%).
- Within-job gender differences shrunk for most groups but continue to be a substantial source of the wage gap. In fact, more than half of the gender wage gap remains when we compare men and women in the same job in 2022. For example, 67.4% of the gender difference in pay remains when we compare Canadian-born men and women in the same job. This was slightly lower for immigrant women landing as children (64.0%), Indigenous women (57.7%) and for immigrant women landing as adults (56.5%).
- Since employment rates vary between women from diverse groups and have advanced at different rates since 2007, it is possible that changing employment rates alters the measurement of the gender wage gap over time. When wages are linked to a consistent mix of characteristics at different points in time, the gender wage gap shrinks more between 2007 and 2022 than previously reported for all groups of women. Selection effects are small for Canadian-born women and immigrant women landing as children: their wage gap shrinks by at most an additional 0.4 to 1.4 percentage points for Canadian-born women and 0.1 to 0.7 percentage points for immigrant women landing as children. Selection effects are larger for Indigenous and immigrant women landing as adults. The wage gap shrinks by an additional 1.4 to 5.6 percentage points for Indigenous women and by an additional an 0.4 to 3.0 percentage points for immigrant women landing as adults.
1. Introduction
Women in Canada have increased their labour market qualifications relative to men and have entered occupations that were traditionally dominated by men (Drolet, 2011). Changing marital and fertility patterns along with more men sharing in domestic responsibilities have strengthened women’s labour force attachment and altered their career paths. Of all women aged 20 to 54, 81.3% were employed in 2022 up from 70.1% in 1997.Note
Legislative support for women’s employment and pay, such as employment equity, pay equity and job-protected maternity / parental leave remains a high priority for Canadian governments (Government of Canada, 2021). The effectiveness of these policy initiatives is often judged and debated by the evolution of the gender pay gap. Differences in the hourly wages of men and women aged 20 to 54 have narrowed from 18.5% in 1997 to 15.8% in 2007 and to 11.8% by 2022. Several factors help to explain the narrowing wage gap: a shift in the profile of workers across cohorts, longer on-the-job tenure and occupational changes among older workers, and increasing educational attainment and falling unionization rates for younger male workers (Baker and Drolet, 2010; Drolet, 2011; Fortin, 2019).
Despite the increase in the proportion of women working in Canada and the narrowing of the gender pay gap, disparities between groups of women persist. Research has repeatedly shown that Indigenous and immigrant women have worse labour market outcomes, including lower employment and lower earnings than their non-Indigenous (Drolet, 2022; Reid et al, 2020; Anderson, 2019; Hahmann et al, 2019) and non-immigrant counterparts (Drolet, 2022; Picot and Sweetman, 2012; Lamb, Banjeree and Verma, 2021; Hou and Picot, 2022).
These persistent inequalities are multifaceted. Indigenous women encounter barriers to employment which may be caused by a combination of factors for example the impact of colonization (such as discrimination, and negative stereotypes), intergenerational trauma, and subsequently lower levels of education and literacy (National Collaborating Centre for Aboriginal Health, 2017). The economic integration of immigrants in Canada has also been the subject of numerous studies. Immigrant women are more likely to be admitted as a dependent spouse (rather than a principal applicant) under the economic category of admission. They often have more difficulty in finding employment because of weak language skills and difficulty in having their skills, education or experience recognized (Houle and Yssad, 2010; Picot and Sweetman, 2012; Bonikowska and Hou, 2017; Frank and Hou, 2015).Note Many immigrant women also experience gendered obstacles such as discrimination in the labour market and the gender division of labour in the family (Liversage, 2009).
While much is already known about the gender pay gap in Canada, there is a lack of research through an intersectional lens. Using data from the Labour Force Survey (LFS), this article first examines how aggregate statistics of the gender wage gap (GWG) from 2007 to 2022 mask the distinct experiences of diverse groups – namely Indigenous living off-reserveNote (those self-identifying as First Nations, Metis and/or Inuk/Inuit), immigrants landing in Canada as children (at the age of 18 or younger) and those who landed in Canada as adults (after the age of 18) compared to gender wage gap among non-Indigenous born in Canada men and women (see Data sources, Methods and Definitions). Second, a detailed analysis of how various factors (such as demographic and job characteristics) that underlie the observed GWGs will determine whether each group faces unique challenges or whether they share common challenges. Third, we examine the extent to which gender disparities in wages within and between groups are the result of occupational segregationNote or from segregation across industries and workplaces. Finally, we examine whether changing employment rates by groups of women contribute to narrowing the gender wage gap.
This research improves our understanding of the GWG and whether the GWG faced by different groups of women either mirrors or deviates from broad patterns. This knowledge is essential to better tailor interventions that consider issues among specific groups and that move away from a one-size-fits-all approach to addressing the gender wage gap in Canada.
The results are presented for paid workers employed either full-time or part-time aged 20 to 54 who are not full-time students. Hourly wages are the preferred unit of analysis (Baker and Drolet, 2010).Note To highlight the differing experiences of Indigenous workers, non-Indigenous workers born in Canada, and immigrant workers, these groups are treated separately in the analysis.Note Note As such, Canadian-born refers to non-Indigenous workers born in Canada. The immigrant population is further disaggregated by their age at which they landed in Canada. Persons migrating as children (at age 18 or younger) have better labour market outcomes than those landing as adults (over the age of 18).Note
To ensure sufficient sample sizes for the disaggregated groups of interest, we combine monthly data (March and September) from 2007 and 2008 as a start point and compare to the combined data (from March and September) for 2021 and 2022 as an end point (see Data sources, Methods and Definitions). For brevity, we use 2007 to describe the estimates using combined data from 2007 and 2008 and we use 2022 to describe the estimates using combined data from 2021 and 2022.
This article defines the gender wage gapNote as the difference between the hourly wage rates of Canadian-born men and women from different groups relative to the hourly wage rate of Canadian-born men. A positive value indicates that men earn more than women. A negative value indicates that women earn more than men.
Of all women between the ages of 20 and 54, 81.3% were employed in 2022, up from 77.8% in 2007. By 2022, women accounted for half of all paid employees in Canada. While women are representing a larger proportion of the workforce, at the same time their population has become more diverse. Canadian-born women made up 68.2% of the paid female workforce in 2022, down from 77.9% in 2007. Immigrant women increased their representation in the paid workforce. In 2022, immigrant women landing as children made up 8.4% of paid employees while immigrant women landing as adults made up 19.3% of the paid employees. These numbers are up from 6.7% and 13.0% in 2007. Indigenous women made up 4.2% of the paid workforce of women in 2022, little changed from 2007.
2. Gender gap in hourly wages, within groups, 2007-2008 and 2021-2022
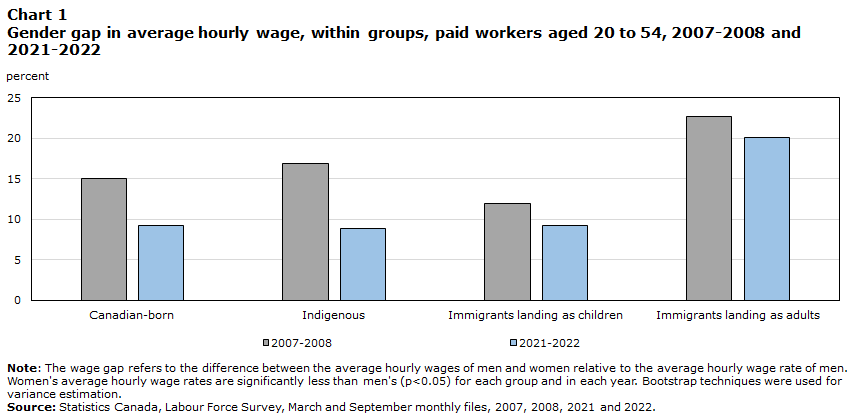
The within-group gender wage gap compares the average hourly wages of men and women from the same group (Chart 1). The gender wage gap among immigrants landing as adults was the largest among all the groups in 2022 with women earning 20.1% less than their male counterparts. Smaller gender wage gaps were noted among Indigenous workers (8.9%), immigrants landing during childhood (9.2%) and the rest of the Canadian-born population (9.2%).
The gap in hourly wages between men and women within the same group also narrowed over the period. The gender wage gap narrowed the most between Indigenous men and women (by 8.0 percentage points) and Canadian-born men and women (by 5.9 percentage points) and the least among immigrants regardless of age at arrival (by 2.7 percentage points).
Data table for Chart 1
| 2007-2008 | 2021-2022 | |
|---|---|---|
| percent | ||
| Canadian-born | 15.0 | 9.2 |
| Indigenous | 16.9 | 8.9 |
| Immigrants landing as children | 11.9 | 9.2 |
| Immigrants landing as adults | 22.7 | 20.1 |
|
Note: The wage gap refers to the difference between the average hourly wages of men and women relative to the average hourly wage rate of men. Women's average hourly wage rates are significantly less than men's (p<0.05) for each group and in each year. Bootstrap techniques were used for variance estimation. Source: Statistics Canada, Labour Force Survey, March and September monthly files, 2007, 2008, 2021 and 2022. |
||
These comparisons - showing how the hourly wages of men and women differ within groups - are insightful and useful. But given that the hourly wages of men vary between groups, it cannot tell us which group of women faces say, the largest gap, or the most persistent gap. It may even yield the false impression that various groups of women face a small gender wage gap. To explicitly account for the intersection between gender and group, it is necessary to compare the wages of each group of women to that of Canadian-born men.
3. How large are the gender wage gaps faced by diverse groups of women?
There is ample evidence in the Canadian context demonstrating that labour market outcomes are related to the population group to which an individual belongs. Analyses continually point to large and persistent earnings gaps between Indigenous and non-Indigenous workers, between immigrant and non-immigrant workers, and between men and women in general.
To better examine the intersection of gender and groups, the wage gap between Canadian-born men and individuals from our groups of interest are examined (Chart 2). Canadian-born men typically earn on average, more than men and women from all groups studied in both 2007 and 2022. For example, Canadian-born men earned 12.3% more than Indigenous men in 2022. This is little changed since 2007. Immigrant men have narrowed the gap in hourly wages with Canadian-born men, now earning virtually the same as their Canadian counterparts.

Data table for Chart 2
| 2007-2008 | 2021-2022 | |
|---|---|---|
| percent | ||
| Women | ||
| Canadian-born | 15.0 | 9.2 |
| Indigenous | 27.2 | 20.1 |
| Immigrants landing as children | 14.7 | 10.5 |
| Immigrants landing as adults | 27.4 | 20.9 |
| Men | ||
| Indigenous | 12.4 | 12.3 |
| Immigrants landing as children | 3.2 | 1.5 |
| Immigrants landing as adults | 6.1 | 1.0 |
|
Note: The wage gap refers to the difference between the average hourly wage rates of Canadian-born men and other groups relative to the average hourly wage rate of Canadian-born men. The average hourly wages of Canadian-born men are higher than all other groups at (p<0.05) in 2007-2008. The average hourly wages of Canadian-born men are higher than Indigenous men and all groups of women at (p<0.05) in 2021-2022. Bootstrap techniques were used for variance estimation. Source: Statistics Canada, Labour Force Survey, March and September monthly files, 2007, 2008, 2021 and 2022. |
||
When applying a consistent base group of comparison (that is, Canadian-born men) comparisons of the gender wage gap between groups of women can be made (Chart 2). The gender wage gaps are typically larger than those documented within groups since the average wages of men also vary by group. For example, Indigenous women earned 8.9% less than Indigenous men in 2022. However, compared with Canadian-born men, Indigenous women earned 20.1% and Indigenous men earned 12.3% less on average, than Canadian-born men.
Diverse groups of women experience the gender wage gap differently. Compared to Canadian-born men, gender wage gaps are largest for immigrant women landing as adults (20.9%) and Indigenous women (20.1%) and smallest for immigrant women landing as children (10.5%) and Canadian-born women (9.2%) in 2022.
The wage gap between Canadian-born men and women from each group has narrowed since 2007 (Chart 2). The gender gap for Canadian-born women narrowed by 5.9 percentage points. That is, Canadian-born women earned 9.2% less than their male counterparts in 2022 down from 15.0% in 2007. Immigrant women landing as children narrowed their gap with Canadian-born men by 4.2 percentage points from 14.7% in 2007 to 10.5% in 2022. The wage gap between Canadian-born men and both Indigenous women and immigrant women landing in Canada as adults, narrowed by 7.1 and 6.5 percentage points, respectively, between 2007 and 2022.
4. The intersectional gender wage gap in Canada, 2007 to 2022
The long-term trend has been a decline in the gender wage gap in Canada (Chart 3). The 2008 financial crisis caused a narrowing of gender wage gap for all groups. Between 2008 and 2011, the gender wage gap narrowed likely due to men’s wages being more impacted because of their over-representation in industries and occupations hardest hit by the downturn (LaRochelle-Côté and Gilmore, 2009). The recovery from the financial crisis yielded little change in the wage gap between 2011 and 2016 for most groups of women. Stronger labour market conditions in the late 2010s improved women’s wages relative to men’s (Drolet, 2022). This narrowed the gap with men for all groups of women. Employment losses during the COVID-19 pandemic had a larger impact on those women working part-time and in specific sectors like retail, food and accommodation and personal services (Bleakney, Masoud and Robertson, 2021; Hou and Picot, 2022). Since women are over-represented in these lower paying sectors, the average wages of women who remained employed increased more than those of men leading to a reduction in the pay gap.

Data table for Chart 3
| Canadian-born women | Indigenous women | Immigrant women landing as children | Immigrant women landing as adults | |
|---|---|---|---|---|
| Year | percent | |||
| 2007 | 15.0 | 28.5 | 13.2 | 26.8 |
| 2008 | 15.0 | 25.9 | 16.2 | 27.8 |
| 2009 | 14.8 | 24.7 | 15.8 | 27.5 |
| 2010 | 14.2 | 24.8 | 15.1 | 26.8 |
| 2011 | 12.9 | 23.4 | 14.8 | 24.0 |
| 2012 | 12.6 | 22.6 | 13.2 | 27.2 |
| 2013 | 13.1 | 21.6 | 13.5 | 26.9 |
| 2014 | 12.7 | 23.6 | 16.7 | 26.1 |
| 2015 | 12.0 | 22.1 | 13.4 | 25.6 |
| 2016 | 12.6 | 24.1 | 12.0 | 25.7 |
| 2017 | 11.5 | 23.1 | 12.3 | 25.0 |
| 2018 | 10.8 | 22.3 | 13.2 | 24.9 |
| 2019 | 11.0 | 20.0 | 12.9 | 23.2 |
| 2020 | 9.6 | 21.3 | 11.6 | 19.6 |
| 2021 | 8.9 | 20.9 | 10.4 | 20.6 |
| 2022 | 9.5 | 19.4 | 10.8 | 21.2 |
|
Note: The wage gap refers to the difference between the average hourly wage rates of Canadian-born men and women from different groups relative to the average hourly wage rate of Canadian-born men. Women's average hourly wage rates are significantly less than men's (p<0.05) for each group in each year. Bootstrap techniques were used for variance estimation. Source: Statistics Canada, Labour Force Survey, March and September monthly files, 2007 to 2022. |
||||
5. Gender wage gap at various points along the wage distribution
The evolution of the gender pay gap at the mean hides differences in the pay men and women receive at various points along the wage distribution. Here, gender-specific wage distributions are compared. This comparison yields two important findings (Chart 4). First, the GWG narrowed at the bottom (5th percentile) and middle (50th percentile or median) but not at the upper end (95th percentile). A closer look reveals that women gained the most in a relative sense at the lower end of the distribution. At the 5th percentile, the GWG narrowed by 7.5 percentage points from 12.5% in 2007 to 5.0% in 2022. At the median, the GWG narrowed by 3.1 percentage points from 16.4% in 2007 to 13.3% in 2022. The GWG is little changed at the 95th percentile.
Second, the GWG was more evenly distributed across the wage distribution in 2007 than in 2022. That is, women faced a more uniform wage gap throughout the distribution of wages in 2007 than in 2022. In 2007, women at the top of their wage distribution (at the 95th percentile) faced a pay gap of 15.6% compared to 12.5% at the bottom of their pay scale (at the 5th percentile). In 2022, women at the top of the wage distribution faced a larger pay gap of 15.0% than those at the bottom of the pay scale of 5.0%.Note

Data table for Chart 4
| 2007-2008 | 2021-2022 | |
|---|---|---|
| percent | ||
| Mean | 15.8 | 11.3 |
| 5th percentile | 12.5 | 5.0 |
| 50th percentile (median) | 16.4 | 13.3 |
| 95th percentile | 15.6 | 15.0 |
|
Note: The wage gap refers to the difference between the hourly wages of men and women relative to the hourly wage rate of men at select percentiles of wage distribution. Women's hourly wage rates are significantly less than men's (p<0.05) at each percentile and in each year. Bootstrap techniques were used for variance estimation. Source: Statistics Canada, Labour Force Survey, March and September monthly files, 2007, 2008, 2021 and 2022. |
||
Along most points of the wage distribution and in any given year, Indigenous women and immigrants landing as adults faced larger GWGs than women born in Canada and immigrant women landing as children relative to Canadian-born men (Chart 5). Note
Regardless of group, women from the lower end of their wage distribution made more progress than women from the upper end of the earnings distribution. At the lower end of the pay distribution (5th percentile), women from all groups faced a smaller and more similar wage gap in 2022 than in 2007. For example, Canadian-born women earned 2.8% less than Canadian-born men in 2022 compared to 12.1% in 2007. Similar numbers are reported for immigrant women landing as children. At the 5th percentile, Indigenous women and immigrant women landing as adults made the most gains. The wage gap for Indigenous women narrowed by 11.2 percentage points from 17.5% in 2007 to 6.3% in 2022. For immigrant women landing as adults, their wage gap narrowed by 13.7 percentage points from 20.0% in 2007 to 6.3% in 2022. At the upper end of the pay distribution (95th percentile) in 2022, Indigenous women (23.8%) and immigrant women landing as adults (20.1%) faced larger pay gaps than Canadian-born women (12.9%) and immigrant women landing as a child (11.3%). This is little changed from 2007.Note

Data table for Chart 5
| Canadian-born women | Indigenous women | Immigrant women landing as children | Immigrant women landing as adults | |
|---|---|---|---|---|
| percent | ||||
| 2007-2008 | ||||
| 5th percentile | 12.1 | 17.5 | 12.1 | 20.0 |
| 50th percentile | 15.7 | 29.3 | 16.0 | 31.4 |
| 95th percentile | 15.5 | 23.8 | 12.8 | 21.7 |
| 2021-2022 | ||||
| 5th percentile | 2.8 | 6.3 | 5.0 | 6.3 |
| 50th percentile | 9.8 | 18.8 | 12.6 | 24.5 |
| 95th percentile | 12.9 | 23.8 | 11.3 | 20.1 |
|
Note: The wage gap refers to the difference between the hourly wage rates of Canadian-born men and women from different groups relative to the hourly wage rate of Canadian-born men at select percentiles. Women's hourly wage rates are significantly less than men's (p<0.05) for each group, at each percentile and in each year. Bootstrap techniques were used for variance estimation. Source: Statistics Canada, Labour Force Survey, March and September monthly files, 2007, 2008, 2021 and 2022. |
||||
These percentile rankings refer to the wage distribution for each group of women. An alternative method is to calculate the median percentile ranking of women from each group in the Canadian-born men’s wage distribution.
Women from all groups ‘moved up’ in the pay distribution of Canadian-born men between 2007 and 2022. The median wage of Canadian-born women was positioned at the 41st percentile ranking of Canadian men in 2022 up from 37th percentile in 2007. This means that the median Canadian-born woman out-earned 41% of their male counterparts in 2022. The median wage of Indigenous women moved up 8 percentile rankings to the 33rd percentile ranking of Canadian-born men. The median wage of immigrant women landing as adults ranked the lowest at the 28th percentile of the pay distribution of Canadian-born men in 2022 up 6 percentile rankings from 2007.
6. Changes in women’s labour market qualifications since 2007
As the gender pay gap has narrowed in Canada, women have increased their relative labour market qualifications and their commitment to paid work.
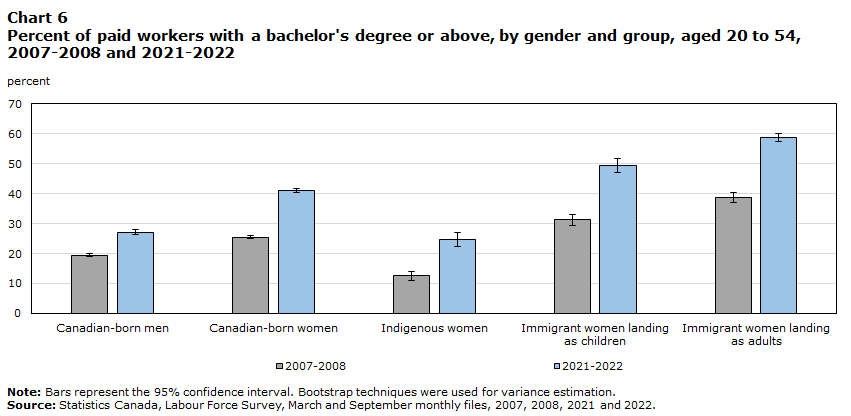
The educational attainment of women surpassed that of men in the early 2000s and continues to rise at a faster pace. In 2007, 27.3% of women and 23.0% of men in the paid workforce held a bachelor’s degree or above yielding a gender gap in favour of women of 4.4 percentage points. By 2022, this gender gap expanded to 10.9 percentage points with 44.5% of working women holding a bachelor’s degree or above compared to 33.6% of men. Women from all groups have become better educated (Chart 6). As such, the gender gap in education relative to Canadian-born men continued to widen in favour of women for most groups by 2022. Indigenous women improved their relative qualifications by doubling the proportion of their workforce with a bachelor’s degree or above from 12.5% in 2007 to 24.8% in 2022. This narrowed the gap relative to Canadian-born men by 4.5 percentage points between 2007 and 2022. By 2022, there was little difference in educational attainment between Indigenous women (24.8%) and Canadian-born men (27.2%) in the paid workforce. The fact that immigrant women are more likely to hold a bachelor’s degree or above is not new and partially reflects the change in immigration policies with preference given to highly skilled new immigrants (Picot and Sweetman, 2012).
Data table for Chart 6
| 2007-2008 | Standard error | 2021-2022 | Standard error | |||
|---|---|---|---|---|---|---|
| Lower bound | Upper bound | Lower bound | Upper bound | |||
| percent | ||||||
| Canadian-born men | 19.4 | 0.5 | 0.5 | 27.2 | 0.7 | 0.7 |
| Canadian-born women | 25.5 | 0.6 | 0.6 | 41.0 | 0.7 | 0.7 |
| Indigenous women | 12.5 | 1.5 | 1.5 | 24.8 | 2.3 | 2.3 |
| Immigrant women landing as children | 31.3 | 1.8 | 1.8 | 49.4 | 2.2 | 2.2 |
| Immigrant women landing as adults | 38.7 | 1.7 | 1.7 | 58.9 | 1.3 | 1.3 |
|
Note: Bars represent the 95% confidence interval. Bootstrap techniques were used for variance estimation. Source: Statistics Canada, Labour Force Survey, March and September monthly files, 2007, 2008, 2021 and 2022. |
||||||
Increases in women’s job tenure may be suggestive of women strengthening their commitment to paid work over the lifecourse.Note The LFS asks currently employed respondents ‘When did…start working for their current employer?’ In-progress job tenure measures the length of an on-going job or the amount of time the job has lasted at the time of the survey.Note The empirical literature suggests that job tenure may reflect changes in lifetime work experience. The expansion of maternity leave and job protection policies promotes women’s return to the labour market after the birth of a child(ren) and their job continuity (Baker and Milligan, 2008).Note
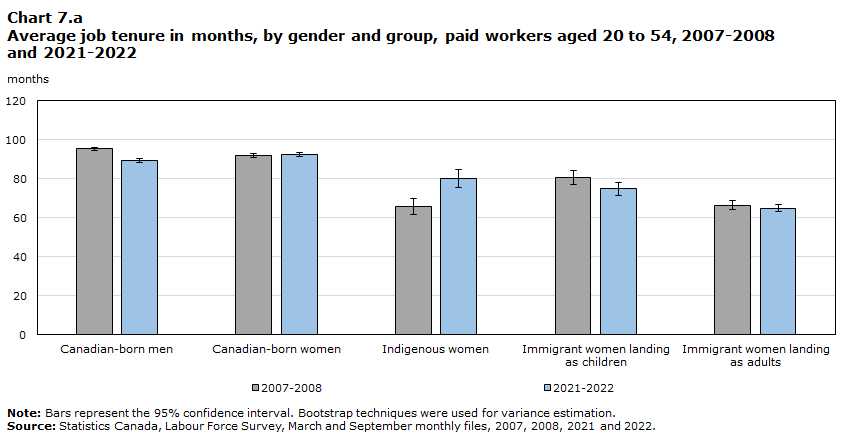
Job tenure varies among the different groups of women. While there is little gender difference in overall average job tenure of currently employed Canadian-born men and women, Canadian-born women typically have longer job tenure than other women. In 2022, the average job tenure of Canadian-born women was 92 months – 12 months longer than Indigenous women, 18 months longer than immigrant women landing in Canada as children and 28 months longer than immigrant women landing as adults (Chart 7a). The job tenure of immigrant women is little changed from 2007.
Indigenous women have made substantial gains averaging 81 months of job tenure in 2022 up from 66 months in 2007. This increase in average in-progress job tenure is consistent with fewer Indigenous women in ‘new’ jobs (Chart 7b). About 21.7% of Indigenous women were employed in jobs with an in-progress duration of less than one year in 2022 down from 29.9% in 2007.
Data table for Chart 7.a
| 2007-2008 | Standard error | 2021-2022 | Standard error | |||
|---|---|---|---|---|---|---|
| Lower bound | Upper bound | Lower bound | Upper bound | |||
| months | ||||||
| Canadian-born men | 95.2 | 1.0 | 1.0 | 89.4 | 1.0 | 1.0 |
| Canadian-born women | 91.8 | 0.9 | 0.9 | 92.3 | 1.1 | 1.1 |
| Indigenous women | 65.7 | 4.1 | 4.1 | 80.2 | 4.5 | 4.5 |
| Immigrant women landing as children | 80.6 | 3.5 | 3.5 | 74.7 | 3.5 | 3.5 |
| Immigrant women landing as adults | 66.4 | 2.2 | 2.2 | 64.8 | 1.8 | 1.8 |
|
Note: Bars represent the 95% confidence interval. Bootstrap techniques were used for variance estimation. Source: Statistics Canada, Labour Force Survey, March and September monthly files, 2007, 2008, 2021 and 2022. |
||||||

Data table for Chart 7.b
| 2007-2008 | Standard error | 2021-2022 | Standard error | |||
|---|---|---|---|---|---|---|
| Lower bound | Upper bound | Lower bound | Upper bound | |||
| percent | ||||||
| Canadian-born men | 20.7 | 0.4 | 0.4 | 18.3 | 0.5 | 0.5 |
| Canadian-born women | 19.3 | 0.4 | 0.4 | 17.6 | 0.5 | 0.5 |
| Indigenous women | 29.9 | 2.4 | 2.4 | 21.7 | 2.3 | 2.3 |
| Immigrant women landing as children | 21.7 | 1.7 | 1.7 | 22.5 | 1.7 | 1.7 |
| Immigrant women landing as adults | 22.6 | 1.2 | 1.2 | 20.9 | 1.1 | 1.1 |
|
Note: Bars represent the 95% confidence interval. Bootstrap techniques were used for variance estimation. Source: Statistics Canada, Labour Force Survey, March and September monthly files, 2007, 2008, 2021 and 2022. |
||||||
Employment in professional jobs is viewed as an indicator of increasing human capital. Entry into professional jobs typically require a university education, relevant work experience and have greater complexities and job responsibilities than non-professional jobs. Career interruptions in professional jobs may be more costly due to relatively higher wages in the profession and the fact that skills may depreciate during lengthy periods of withdrawal. Women’s representation in professional jobs was not felt equally among all groups (Chart 8). In 2022, 31.0% of Canadian-born women and 33.6% of immigrant women landing as children worked in a professional occupation compared to 26.1% of immigrant women landing as adults and 22.9% of Indigenous women.Note While women from all groups were more likely to work in professional jobs than Canadian-born men, their advantage grew throughout the period.Note

Data table for Chart 8
| 2007-2008 | Standard error | 2021-2022 | Standard error | |||
|---|---|---|---|---|---|---|
| Lower bound | Upper bound | Lower bound | Upper bound | |||
| percent | ||||||
| Canadian-born men | 13.9 | 0.4 | 0.4 | 18.7 | 0.5 | 0.5 |
| Canadian-born women | 22.0 | 0.5 | 0.5 | 31.0 | 0.6 | 0.6 |
| Indigenous women | 15.1 | 1.7 | 1.7 | 22.9 | 2.2 | 2.2 |
| Immigrant women landing as children | 21.0 | 1.6 | 1.6 | 33.6 | 2.1 | 2.1 |
| Immigrant women landing as adults | 17.8 | 1.2 | 1.2 | 26.1 | 1.1 | 1.1 |
|
Note: Bars represent the 95% confidence interval. Bootstrap techniques were used for variance estimation. Source: Statistics Canada, Labour Force Survey, March and September monthly files, 2007, 2008, 2021 and 2022. |
||||||
There exists a long-standing concern that the concentration of women in certain occupations and within occupations in selected tasks and levels has limited their labour market outcomes (Fortin and Huberman, 2002). Horizontal occupational segregation refers to the concentration of men and women across different occupations. A female-dominated occupation is when women make up more than 65% of total employment in the occupation. Nursing or administrative occupations are examples of female-dominated occupations (Appendix 1A). A male-dominated occupation is when women make up less than 35% of total employment in the occupation. Professional occupations in applied science and technical trades and transportations are examples of male dominated occupations.
More men and women worked in mixed occupations in 2022 than in 2007: 22.0% of men and 28.5% of women worked in a mixed occupation in 2007 compared to 30.3% and 39.6% respectively in 2022. Fewer women worked in female-dominated occupations in 2022 than in 2007: in 2022, 48.0% of women worked in a female-dominated occupations down from 59.1% in 2007. Among the diverse groups of women, immigrants landing as adults (53.3%) were the least likely to work in female-dominated occupations and the most likely to work in male-dominated occupations (18.4%) compared with women from other groups (Appendix 4).
When occupations are sorted by pay rates, women continue to be concentrated in low-wage occupations (Appendix 1B). Roughly 28.2% of women and 16.2% of men work in the five lowest paid occupations in 2022. Women’s representation in low-wage jobs was not felt equally among all groups. Indigenous (35.6%) and immigrant women landing as adults (34.7%) were more likely to work in low-wage occupations than Canadian-born women (26.0%) and immigrant women landing as children (28.0%). At the same time, women from all groups were reducing their concentration in sales, service and administrative support occupations.
Vertical occupational segregation or ‘the glass ceiling’ describes the concentration of women at the bottom of the occupational hierarchy and men at the top.Note It suggests that women face obstacles to career advancement that limits their ability to reach higher paid positions within occupations.Note To operationalize the concept of hierarchy within occupation, we compute a proxy measure based on the distribution of hourly wages within a given occupation: those earning less than the 25th percentile are at the lowest level within the occupation (Appendix 1B). Using this proxy measure, 29% of women are at lowest level (25th percentile or below) compared to 21.8% of men in 2022 while 29.8% of men are at the highest level (75th percentile or above) compared to 20.6% of women. Of all groups of women, Indigenous women and immigrant women landing as adults are more likely to be at the lowest hierarchical levels of an occupation.
Much like occupation, the sorting of men and women into industries may be viewed as another indicator of gender segregation (Appendix 2). Just over one quarter of Canadian-born men work in construction and manufacturing industries while about half of Indigenous and Canadian-born women work in health care and social assistance, educational services and retail trade. Immigrant women landing as children are more likely to work in professional, scientific and technical service industries and finance and insurance (20.9%) than Canadian-born women (13.7%).
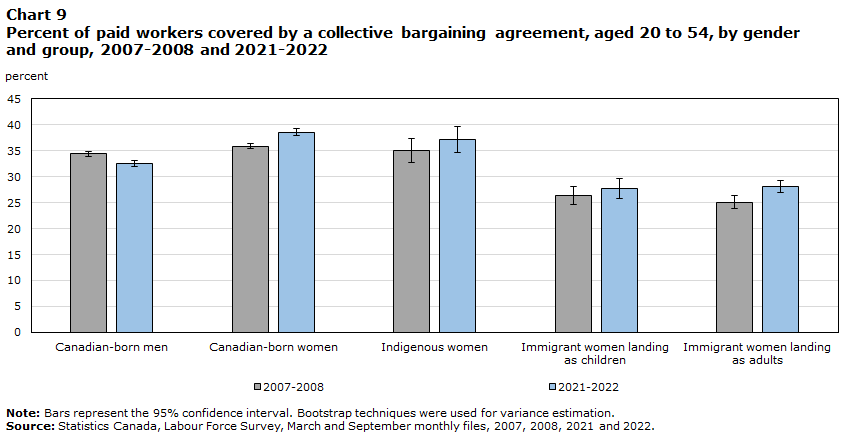
Employment in jobs covered by collective bargaining agreements also differs between men and women and among women from diverse groups. There continues to be a steady widening of the gender gap in the proportion of the workforce that is covered by a collective bargaining agreement in favour of women. Canadian-born men’s coverage fell from 34.4% in 2007 to 32.6% in 2022 while women’s coverage increased from 33.8% to 35.6%. The fall in men’s coverage is largely due to a drop in private sector coverage with public sector coverage remaining stable for both men and women. There are sharp contrasts in women’s coverage among the groups. In 2022, 38.6% of Canadian-born women and 37.1% of Indigenous women worked in jobs covered by a collective bargaining agreement compared to about 28% of all immigrant women (Chart 9). These differences owe mainly to immigrant women’s over-representation in the private sector where coverage rates are typically lower.
Data table for Chart 9
| 2007-2008 | Standard error | 2021-2022 | Standard error | |||
|---|---|---|---|---|---|---|
| Lower bound | Upper bound | Lower bound | Upper bound | |||
| percent | ||||||
| Canadian-born men | 34.4 | 0.5 | 0.5 | 32.6 | 0.6 | 0.6 |
| Canadian-born women | 35.9 | 0.5 | 0.5 | 38.6 | 0.6 | 0.6 |
| Indigenous women | 35.0 | 2.3 | 2.3 | 37.1 | 2.5 | 2.5 |
| Immigrant women landing as children | 26.4 | 1.7 | 1.7 | 27.7 | 1.9 | 1.9 |
| Immigrant women landing as adults | 25.1 | 1.3 | 1.3 | 28.1 | 1.2 | 1.2 |
|
Note: Bars represent the 95% confidence interval. Bootstrap techniques were used for variance estimation. Source: Statistics Canada, Labour Force Survey, March and September monthly files, 2007, 2008, 2021 and 2022. |
||||||
7. Gender wage gaps: how do the diverse groups of women fare?
This section examines whether the gender wage gaps by different groups of women relative to Canadian-born men either mirror or deviate from broad patterns by demographic, human capital and job characteristics. There are two general findings. First, regardless of labour market characteristic considered, gender wage differentials have narrowed over time but have not completely disappeared. Second, Canadian-born women typically face smaller gender wage gaps compared to Indigenous and immigrant women. This further illustrates the importance of examining the intersection of gender and group when studying gender wage differentials.
While all age groups experienced a drop in their gender wage gap relative to Canadian-born men between 2007 and 2022, the timing differs by group (Table 1). The most dramatic improvement for Canadian-born women occurred for those aged 45 to 49. The wage gap among those aged 45 to 49 was 20.5% in 2007 and fell to 13.5% in 2022, narrowing by 7.0 percentage points. The most striking gain occurred among young Indigenous women. The wage gap among those aged 20-24 was 19.8% in 2007 and fell to 8.4% in 2022, a narrowing of 11.4 percentage points. The most dramatic improvement for immigrant women occurred for those aged 25 to 29. The wage gap among those immigrant women landing in Canada as children was non-existent in 2022 down from 10.7% in 2007. The greatest improvement in the wage gap for immigrant women landing in Canada as adults occurred for those aged 25 to 29, falling from 30.5% in 2007 to 12.0% in 2022.
| Age | |||||||
|---|---|---|---|---|---|---|---|
| 20-24 | 25-29 | 30-34 | 35-39 | 40-44 | 45-49 | 50-54 | |
| percent | |||||||
| 2007-2008 | |||||||
| Canadian-born women | 10.6 | 8.8 | 11.3 | 16.4 | 17.6 | 20.5 | 18.8 |
| Indigenous women | 19.8 | 20.1 | 22.4 | 30.1 | 30.0 | 27.3 | 30.3 |
| Immigrant women landing as children | 10.4 | 10.7 | 8.8 | 10.3 | 16.7 | 19.0 | 17.1 |
| Immigrant women landing as adults | 25.6 | 30.5 | 28.3 | 31.9 | 33.5 | 34.3 | 33.3 |
| 2021-2022 | |||||||
| Canadian-born women | 5.0 | 5.1 | 7.1 | 10.0 | 11.3 | 13.5 | 14.1 |
| Indigenous women | 8.4 | 17.8 | 21.4 | 19.7 | 20.9 | 20.5 | 22.8 |
| Immigrant women landing as children | 6.9 | -0.7 | 2.6 | 10.2 | 12.9 | 13.9 | 17.3 |
| Immigrant women landing as adults | 16.3 | 12.0 | 17.2 | 26.7 | 30.9 | 29.9 | 29.9 |
|
Note: The wage gap refers to the difference between the average hourly wage rates of Canadian-born men and women from different groups relative to the average hourly wage rate of Canadian-born men. Women's average hourly wage rate is significantly less than men's (p<0.05) for each group and in each year, with the exception of immigrant women landing as children aged 25 to 29 and 30 to 34. Bootstrap techniques were used for variance estimation. Source: Statistics Canada, Labour Force Survey, March and September monthly files, 2007, 2008, 2021 and 2022. |
|||||||
There is a clear age profile of the gender wage gap for each group. In any given year, wage gaps are generally larger among older workers and smaller among younger workers. The smaller wage gap among young workers reflects the fact that women’s characteristics may be more like men’s early in their career and the impact of career interruptions has yet to take place. The larger wage gap among older workers reflects differing education, occupation and career interruption decisions. These age-specific GWGs reflect individuals from different birth periods. Since the characteristics of women have changed since earlier cohorts entered the workforce, cohort differences may explain part of the differences observed by age group.
The change in the gender wage gap for a given cohort is addressed by constructing repeated cross-sectional estimates that track the outcomes of individuals from the same birth period over time. Since data on immigrants and Indigenous identity is available starting in 2006, only the cohort of individuals aged 25 to 29 in 2007 and aged 40 to 44 in 2022 is examined (Table 1).
When the data are used in this way, a slightly different story is told. The gender wage gap among Canadian-born workers was 8.8% among those aged 25 to 29 in 2007. Fifteen years later, when the cohort was aged 40 to 44, the gender wage gap was 11.3%. That is, the gender wage gap widened by 2.5 percentage points. This is quite different from the cross- sectional evidence in 2022 where the gap among workers aged 40 to 44 was 6.2 percentage points higher than those aged 25 to 29.
Repeating the same exercise for the other groups cast further doubt on the correlation between age and the gender wage gap. For immigrants landing as children, their gender wage gap widened by 2.2 percentage points as they aged. For Indigenous and immigrants landing as adults, their gender wage gap remained stagnant as they aged. For example, the GWG for Indigenous women aged 25 to 29 was 20.1% in 2007 and fifteen years later, their wage gap was 20.9% in 2022. For immigrants landing as adults, their gender wage gap was about 30% in both 2007 and 2022.Note This is consistent with Drolet (2011) who concluded that ‘the gender wage gap early in an individual’s career is an increasingly good predictor of the wage gap throughout a generation’s working life.’
The gender wage gap differs by educational attainment with smaller gaps typically observed among those with higher education (Table 2). The exception is among those who immigrated after the age of 18. One explanation for this gap is that highly educated immigrant women may have trouble in having their credentials recognized, especially if these have not been acquired in Canada. Grouping the data by where immigrants obtained their degree shows that immigrant women educated in Canada fare better than those educated outside of Canada.
| Education level | |||
|---|---|---|---|
| High school or less | Some or completed college, trades or less than Bachelor level | Bachelor's degree or above | |
| percent | |||
| 2007-2008 | |||
| Canadian-born women | 20.7 | 18.5 | 15.7 |
| Indigenous women | 29.8 | 22.4 | 21.6 |
| Immigrant women landing as children | 20.3 | 20.3 | 18.5 |
| Immigrant women landing as adults | 33.1 | 29.5 | 35.8 |
| Immigrant women educated outside of Canada | Note ...: not applicable | 31.8 | 39.3 |
| Immigrant women educated in Canada | Note ...: not applicable | 20.2 | 18.7 |
| 2021-2022 | |||
| Canadian-born women | 15.1 | 18.1 | 11.5 |
| Indigenous women | 18.5 | 21.9 | 17.2 |
| Immigrant women landing as children | 20.7 | 22.9 | 14.9 |
| Immigrant women landing as adults | 27.5 | 30.3 | 29.5 |
| Immigrant women educated outside of Canada | Note ...: not applicable | 33.5 | 32.7 |
| Immigrant women educated in Canada | Note ...: not applicable | 23.5 | 15.7 |
|
... not applicable Note: The wage gap refers to the difference between the average hourly wage rates of Canadian-born men and women from different groups relative to the average hourly wage rate of Canadian-born men. Women's average hourly wage rate is significantly less than men's (p<0.05) for each group and in each year. Bootstrap techniques were used for variance estimation. Source: Statistics Canada, Labour Force Survey, March and September monthly files, 2007, 2008, 2021 and 2022. |
|||
Canadian-born women face lower gender wage gaps in each education group and in each year than their immigrant and Indigenous counterparts. In 2022, the gender wage gap among those with a bachelor’s degree or above was 11.5% for Canadian-born women compared to 17.2% for Indigenous women, 14.9% for immigrant women landing as children and 29.5% for immigrant women landing as adults. This is consistent with findings from the empirical literature from Canada. Bourdarbat and Conolly (2013) conclude that women choose less lucrative fields of study than men. Galarneau et al (2023) report that two years after graduation, racialized women with a bachelor’s degree earned less than non-racialized and non-Indigenous women.
The aggregate gender wage gap is influenced by the fact that more women work part-time and that part-time wages are lower than full-time wages (Antonie et al, 2020). Selection into part-time work may be family-related for women. The LFS asks respondents to cite the main reason for working part-time. Among women working part-time in 2022, 32.6% cited caring for own children, caring for elder relative or other personal or family responsibilities as their main reasons for working part-time. In contrast, 8.6% of men working part-time cited these reasons.
Working part-time is associated with higher wages for Canadian-born women and immigrant women landing during childhood relative to Canadian-born men working part-time (Chart 10). These women earned about 7.4% and 6.9% more than Canadian-born men working part-time in 2022. These findings likely reflect the heterogeneity among part-time workers. Examining the distributions in part-time work by industry and occupation reveals that for men, part-time work is concentrated in low-wage industries like retail and accommodation and food services (40%) and related occupations such as sales and service support occupations and other customer and personal service occupations (46%). The relatively high earnings of a subset of Canadian-born women and immigrant women landing as children working part-time is due to their higher incidence of part-time work in professional occupations in health, education and government (19% and 18%, respectively).Note
In contrast, working part-time has an adverse effect for Indigenous women and immigrant women landing as adults. That is, the hourly wages of Indigenous women and immigrant women landing as adults were about 9.1% and 6.8%, respectively, lower than Canadian-born men working part-time in 2022. The part-time work of Indigenous and immigrant women landing as adults is also concentrated in the same low-wage industries and occupations (39% and 36%, respectively) as men and in addition to their concentration in low-wage support occupations in business and health occupations (21% and 16%, respectively).

Data table for Chart 10
| 2007-2008 | 2021-2022 | |||||||
|---|---|---|---|---|---|---|---|---|
| Canadian-born women | Indigenous women | Immigrant women landing as children | Immigrant women landing as adults | Canadian-born women | Indigenous women | Immigrant women landing as children | Immigrant women landing as adults | |
| percent | ||||||||
| Full-time | 14.0 | 25.1 | 14.2 | 26.9 | 8.1 | 18.1 | 9.7 | 19.8 |
| Part-time | -4.6 | 18.4 | -6.9 | 10.0 | -7.4 | 9.1 | -6.9 | 6.8 |
|
Note: The wage gap refers to the difference between the average hourly wage rates of Canadian-born men and women from different groups relative to the average hourly wage rate of Canadian-born men. A negative wage gap means that women earn on average more than men. The average hourly wage rate for women working full-time is significantly less than men's (p<0.05) for each group and in each year. The average hourly wage rate for Canadian-born women working part-time is significantly greater than Canadian-born men's (p<0.05) in each year. The average hourly wage rate for Indigenous women and immigrant women landing as adults working part-time is less than Canadian-born men's (p<0.05) in each year. There is no difference between the average hourly wage rates of immigrant women landing as children and Canadian-born men working part-time (p<0.05) in each year. Bootstrap techniques were used for variance estimation. Source: Statistics Canada, Labour Force Survey, March and September monthly files, 2007, 2008, 2021 and 2022. |
||||||||
The gender wage gap is typically larger in the private sector than in the public sector (Chart 11). The smaller wage gap in the public sector may be attributable to several factors including, but not limited to, pay equity legislation having a larger impact on the public sector, higher unionization rates, differences in the educational attainment of the respective workforces, and so forth (Mueller, 2019). The higher wage premiums of women relative to men in the public sector may also explain why the gender gap in pay is smaller in the public sector than in the private sector (Mueller, 2019).
Indigenous women and immigrant women landing as adults face higher gender wage gaps in both the private and public sector compared to other women. Indigenous women in the private sector earn 27.7% less than Canadian-born men in 2022. The gender wage gap is half as large (15.6%) for Canadian-born women. In the public sector, immigrant women landing as adults earned 18.1% less than Canadian-born men while immigrant women landing as children earned 8.8% less.

Data table for Chart 11
| 2007-2008 | 2021-2022 | |||||||
|---|---|---|---|---|---|---|---|---|
| Canadian-born women | Indigenous women | Immigrant women landing as children | Immigrant women landing as adults | Canadian-born women | Indigenous women | Immigrant women landing as children | Immigrant women landing as adults | |
| percent | ||||||||
| Private sector | 22.6 | 35.2 | 18.0 | 30.5 | 15.6 | 27.7 | 13.3 | 22.5 |
| Public sector | 9.5 | 19.4 | 9.2 | 13.3 | 8.1 | 16.5 | 8.7 | 18.1 |
|
Note: The wage gap refers to the difference between the average hourly wage rates of Canadian-born men and women from different groups relative to the average hourly wage rate of Canadian-born men. Women's average hourly wage rates are significantly less than men's (p<0.05) for each group and in each year. Bootstrap techniques were used for variance estimation. Source: Statistics Canada, Labour Force Survey, March and September monthly files, 2007, 2008, 2021 and 2022. |
||||||||
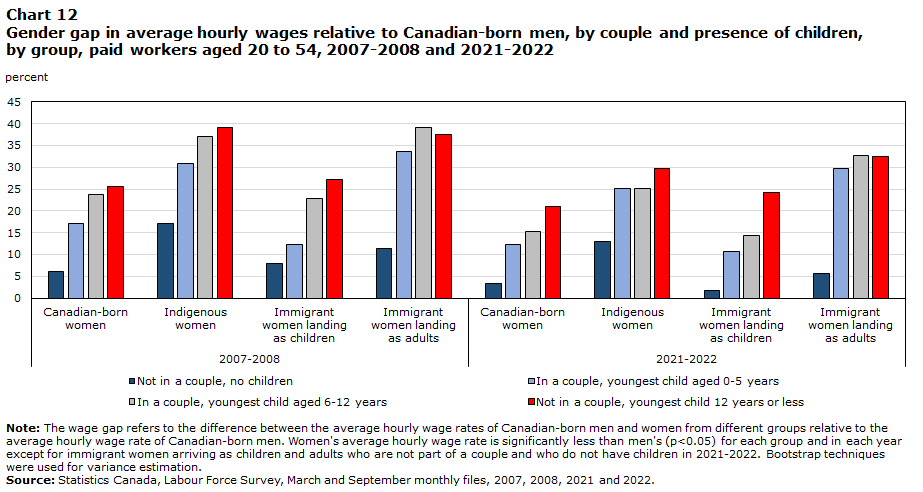
Marriage and motherhood status matters when examining gender wage gaps (Chart 12). The gender wage gap is smallest amongst men and women who are not part of a couple and do not have any children while the gender wage gap is larger when the presence and age of children are added. These gaps have narrowed for all groups between 2007 and 2022. Changing societal norms facing mothers in the workplace, declining fertility rates and men’s increasing involvement in family and household responsibilities are just some of the factors that may explain these trends.
Data table for Chart 12
| 2007-2008 | 2021-2022 | |||||||
|---|---|---|---|---|---|---|---|---|
| Canadian-born women | Indigenous women | Immigrant women landing as children | Immigrant women landing as adults | Canadian-born women | Indigenous women | Immigrant women landing as children | Immigrant women landing as adults | |
| percent | ||||||||
| Not in a couple, no children | 6.1 | 17.0 | 7.9 | 11.3 | 3.3 | 12.9 | 1.8 | 5.7 |
| In a couple, youngest child aged 0-5 years | 17.2 | 30.8 | 12.3 | 33.5 | 12.3 | 25.2 | 10.7 | 29.6 |
| In a couple, youngest child aged 6-12 years | 23.8 | 37.1 | 22.9 | 39.2 | 15.2 | 25.1 | 14.4 | 32.6 |
| Not in a couple, youngest child 12 years or less | 25.6 | 39.2 | 27.1 | 37.4 | 20.9 | 29.7 | 24.2 | 32.5 |
|
Note: The wage gap refers to the difference between the average hourly wage rates of Canadian-born men and women from different groups relative to the average hourly wage rate of Canadian-born men. Women's average hourly wage rate is significantly less than men's (p<0.05) for each group and in each year except for immigrant women arriving as children and adults who are not part of a couple and who do not have children in 2021-2022. Bootstrap techniques were used for variance estimation. Source: Statistics Canada, Labour Force Survey, March and September monthly files, 2007, 2008, 2021 and 2022. |
||||||||
When men and women are not part of a couple and do not have children, Canadian-born women earned 3.3% less, immigrant women landing as children earned 1.8% less, immigrant women landing as adults earned 5.7% less, and Indigenous women earned 12.9% less than Canadian-born men. These smaller wage gaps may be partially related to age (with younger workers having similar skills and levels of lifetime labour market experience) as well as to the fact that the effects of career interruptions and differentiated household responsibilities have not yet taken place.
Larger gender wage gaps were observed among couples with young children especially for Indigenous (25.2%) and immigrant women landing as adults (29.6%). This may reflect the fact that women with young children may be more likely to work part-time and may be more willing to accept lower wages in exchange for flexible work schedules. In addition, gender roles in source country and educational profiles of immigrant women may explain part of the difference.Note Wage gaps persist and widen slightly when the youngest child is aged 6 to 12.Note
Balancing the demands of work and family is especially difficult for lone mothers. Lone mothers with children aged 12 or younger face the largest wage gaps, especially Indigenous women (29.7%).Note A number of factors that cannot be explored with the LFS data may be at play. These factors may include preferences for staying at home with children, lower use of childcare services due to their availability and/or relatively higher cost and lower opportunity costs of not working.
8. What factors ‘explain’ the gap in 2007 and 2022 and do these factors differ among the groups of women?
This section examines how for each group of women, differences in their qualifications and their job characteristics affect the gender wage gaps they face in the labour market in 2007 and in 2022.
We proceed by decomposing the gender wage gap in 2007 and in 2022 using multivariate regressions and the Blinder-Oaxaca decomposition. In short, the wage gap in any given year is split into two parts: first, the part explained by differences in the characteristics of men and women (such as education or occupational distribution) and second, the part unexplained by the factors considered in this study.Note Two wage models are estimated. The Human Capital Model captures investments made by individuals to improve their productivity and therefore earnings. This specification includes controls for education, job tenure, full-time status as well as age. The Full Model controls for human capital factors as well as demographic characteristics (interaction of marital status and age of the youngest child and locationNote ) and job characteristics (such as union status, job permanency, firm size and private sector) and a series of industry and occupation variables. A complete description of the methods and variables are provided in the Data sources, Methods and Definitions section.
Over the 2007 to 2022 period, ‘the human capital portion of the wage gap has been squeezed out’ (Goldin, 2014). When the wage gap is adjusted for the human capital characteristics used in this study (age, education, job tenure and full-time status), the gap narrowed from 15.0% in 2007 to 12.6% in 2022 (Table 3). But by 2022, the human capital adjusted gap (12.6%) is larger than the unadjusted gap (11.2%). Why is the gap adjusted for human capital factors larger than the unadjusted gap for some groups? It mostly reflects the improvement in women’s educational attainment relative to men. Given that women are on average, better educated than men, and that wages are typically higher for those with higher education, the expectation would be that women would earn more than men holding all else constant. The fact that educated women actually earn less than their male counterparts explains why the adjusted gap is larger than the unadjusted gap.Note This may be partially driven by the fact that there are no controls for major field of study available in the LFS data. Boudarbat and Conolly (2013) concluded that major field of study explained a substantial portion (22%-32%) of the gap among post-secondary graduates. Drolet (2002) showed that major field of study explained at most 5% of the gap among all paid workers aged 18 to 64.
Does the observation that ‘the human capital portion of the wage gap has been squeezed out’ hold for the different groups of women relative to Canadian-born men? It does for Canadian-born women and immigrant women. Among Canadian-born workers, the human capital adjusted wage gap narrowed from 15.0% in 2007 to 11.8% in 2022 but remained larger than the unadjusted gap (8.9%) in 2022. Adjusted wage gaps are also larger than the unadjusted wage gaps for all immigrant women. The observation does not hold for Indigenous women. As will be discussed in more detail shortly, their human capital adjusted gaps narrowed considerably over this period from 19.7% in 2007 to 15.0% in 2022.
Job characteristics continue to play a role in explaining the gender wage gap in Canada. When the gender wage gap among all workers is adjusted for human capital, demographic, and job characteristics (full-time status, job permanency, union coverage, firm size, and private sector) including industry and occupation, the gap narrowed slightly from 11.0% in 2007 to 9.3% in 2022. Overall, the adjusted gender wage gap is lower in the full model (9.2%) than the unadjusted model (11.2%) in 2022. However, this is not the case for most groups of women in 2022. For Canadian-born women, their adjusted gap (8.9%) is similar to the unadjusted gap (8.5%). For immigrant women landing as adults, their adjusted gap (24.1%) is larger than their unadjusted gap (23.3%). The pattern differs for Indigenous women. From 2007 to 2022, their unadjusted gender wage gaps narrowed from 31.5% to 20.8%. Their adjusted gaps narrowed from 19.7% to 15.0% in the human capital model and from 10.1% to 10.9% in the full model. This suggests that, at least for Indigenous women both human capital and job characteristics continue to play a role in explaining their gender wage gap relative to Canadian-born men.
| Unadjusted log wage gapTable 3 Note 1 | Log wage gap adjusted for human capital variables Table 3 Note 2 | Log wage gap adjusted for all variablesTable 3 Note 3 | |
|---|---|---|---|
| 2007-2008 | |||
| All workers | 0.171 | 0.150 | 0.110 |
| Relative to Canadian born men | |||
| Canadian-born women | 0.163 | 0.150 | 0.106 |
| Indigenous women | 0.315 | 0.197 | 0.101 |
| Immigrant women landing as children | 0.164 | 0.153 | 0.138 |
| Immigrant women landing as adults | 0.325 | 0.304 | 0.287 |
| 2021-2022 | |||
| All workers | 0.112 | 0.126 | 0.093 |
| Relative to Canadian born men | |||
| Canadian-born women | 0.089 | 0.118 | 0.089 |
| Indigenous women | 0.208 | 0.150 | 0.109 |
| Immigrant women landing as children | 0.114 | 0.135 | 0.118 |
| Immigrant women landing as adults | 0.233 | 0.304 | 0.241 |
|
|||
The adjusted wage gaps shown in Table 3 are analyzed in more detail in Table 4. Further details on the contribution of differences in the labour market characteristics of men and women in general and among groups of women to the gender wage gap are explored. Table 4 shows the fraction of the gender wage gap in 2007 and 2022 accounted for by differences in the characteristics of men and women using the full model. All fractions are presented as a percentage of the unadjusted gap. A negative value indicates that holding all else constant, we would expect women to have a higher average wage.
The explained component of the gender wage gap declined between 2007 and 2022 for all groups. Among all workers, the explained component declined from 32.0% in 2007 to 13.0% in 2022. The explained component was mostly positive in 2007 (apart from immigrant women landing as adults) but by 2022, the explained component was mostly negative (except for Indigenous women). A negative explained component means that based on the differences in explanatory variable between men and women, the expectation is that women would be paid more than men. The unexplained component accounted for a substantial and increasingly larger share of the gender wage gap for all groups. Among all workers, the unexplained portion rose from 68.0% in 2007 to 87.0% in 2022. However, the unexplained component exceeded 100.0 for Canadian-born and immigrant women in 2022. This may be partially driven by the fact that there are no controls for actual labour market experience.Note
| All workers | Relative to Canadian-born men | |||||||||
|---|---|---|---|---|---|---|---|---|---|---|
| Canadian born women | Indigenous women | Immigrant women landing as children | Immigrant women landing as adults | |||||||
| 2007-2008 | 2021-2022 | 2007-2008 | 2021-2022 | 2007-2008 | 2021-2022 | 2007-2008 | 2021-2022 | 2007-2008 | 2021-2022 | |
| percent | ||||||||||
| Total explained | 32.0 | 13.0 | 31.0 | -4.4 | 63.2 | 44.9 | 10.3 | -10.6 | -4.0 | -18.3 |
| Human capital | -1.6 | -10.5 | -5.5 | -23.7 | 12.1 | 7.4 | -1.1 | -10.0 | -17.4 | -28.2 |
| Age | -2.3 | -4.1 | -3.2 | -5.1 | 2.0 | 1.4 | 5.3 | 8.4 | -12.6 | -16.2 |
| Education level | -5.2 | -11.5 | -9.4 | -24.6 | 4.7 | 0.4 | -14.6 | -27.1 | -10.3 | -16.9 |
| Job tenure | -0.2 | -0.7 | -0.2 | -0.9 | 4.3 | 1.6 | 2.4 | 3.6 | 2.6 | 2.0 |
| Full-time status | 6.1 | 5.8 | 7.3 | 6.9 | 1.1 | 4.0 | 5.8 | 5.1 | 2.9 | 2.9 |
| Demographics | -2.0 | -6.6 | -3.0 | -10.1 | -12.3 | -5.3 | -30.3 | -26.1 | -22.6 | -24.5 |
| Location | 1.3 | 0.9 | 2.1 | 2.4 | -7.5 | -3.9 | -28.6 | -28.4 | -15.9 | -12.0 |
| Couple and parenthood | -3.3 | -7.5 | -5.1 | -12.5 | -4.8 | -1.4 | -1.7 | 2.3 | -6.7 | -12.5 |
| Job characteristics | 35.6 | 30.0 | 39.4 | 29.2 | 63.2 | 42.8 | 41.7 | 25.5 | 36.1 | 34.4 |
| Private sector | -2.5 | -2.6 | -2.4 | 2.1 | 0.0 | 0.9 | -0.8 | 0.7 | 0.1 | 0.1 |
| Firm size | -1.3 | -2.6 | -1.7 | -5.6 | 4.1 | -0.1 | -3.5 | -4.3 | 1.3 | -0.1 |
| Permanent job | 0.7 | 1.4 | 0.5 | 1.1 | -0.1 | 1.1 | 0.4 | 1.6 | 0.6 | 1.0 |
| Unionized | -0.6 | -2.8 | -0.5 | -4.2 | -0.7 | -1.3 | 2.8 | 2.6 | 1.7 | 1.2 |
| Industry and occupation | 39.3 | 36.6 | 43.5 | 35.8 | 59.9 | 42.2 | 42.8 | 24.9 | 32.4 | 32.2 |
| Total unexplained | 68.0 | 87.0 | 69.0 | 104.4 | 36.8 | 55.1 | 89.7 | 110.6 | 104.0 | 118.3 |
| Source: Statistics Canada, Labour Force Survey, March and September monthly files, 2007, 2008, 2021 and 2022. | ||||||||||
These figures hide dramatic differences in the explanatory power of specific variables to account for the gender wage gap. Education level consistently explains a larger and typically negative portion of the gender wage gap. Consistent with the higher educational attainment of women, the expectation is that women would be paid more than men. Among all workers, education level served to widen the gap by 5.2% in 2007 to 11.5% in 2022. Relative to Canadian-born men, higher education widened the gap by 24.6% for Canadian-born women and 27.1% for immigrant women landing as children in 2022. Relatively higher education for Canadian-born men explained 4.7% of the wage gap with Indigenous women in 2007. Since education levels of Indigenous women approached those of Canadian-born men in 2022, education explained 0.4% of the wage gap.
Which individual education categories have the highest explanatory power? The total negative effect of education is driven by (i) more men than women having a high school diploma or less and (ii) more women than men having a bachelor’s degree or above. Both factors favour women. This is observed for most groups of women and in each period considered. The exception is the wage gap for immigrant women landing as adults where having a Bachelor’s degree or above was the main driver of the negative effect of education.
Women’s over-representation in part-time work and in non-permanent jobs explained about 7.2% of the gender wage gap in 2022. This was little changed from 2007. Job status, that is work hours and job permanency, explained between 3.9% to 8.0% of the pay gap between Canadian-born men and all groups of women as these job characteristics pertained to a substantially larger share of men than women and due to higher wage premiums associated with permanent full-time work.
The combined effect of industry and occupation in explaining the gender wage gap is sizeable for all groups and in both 2007 and 2022.Note In 2022, the combined effect explains 24.9% (for immigrant women landing as children) to 42.2% (for Indigenous women) of the gender wage gap relative to Canadian-born men. Male-dominated occupations and industries such as professional occupations in natural and applied science and occupations in trades and transportation and industries such as construction, manufacturing and the agriculture, forestry, mining, and utilities explain part of the gender wage gap since they are relatively lucrative occupations. Industries and occupations related to business, education and health are more favourable to all groups of women.
9. What accounts for the narrowing of the gender wage gap and does this differ between groups of women?
The previous section described the factors that contributed to the wage gap in 2007 and 2022. This section describes the factors that narrowed the wage gap between 2007 and 2022. Blau and Kahn (2017) adapt an approach developed by Juhn, Murphy and Pierce (1991) that provides an alternative perspective on changes in the gender wage gap over time (see Data sources, Methods and Definitions for description). This method partitions the narrowing in the actual gender wage gap into (i) the effects of changing means, (ii) the effects of changing coefficients and (iii) the effect of changing unexplained gaps. A positive percentage means that the variable contributed to the narrowing of the gap while a negative percentage means that the variable widened the gap.
| All workers | Relative to Canadian-born men | ||||
|---|---|---|---|---|---|
| Canadian-born women | Indigenous women | Immigrants landing as children women | Immigrants landing as adults women | ||
| in logs | |||||
| Log wage gap in 2007-2008 | 0.171 | 0.163 | 0.315 | 0.164 | 0.325 |
| Log wage gap in 2021-2022 | 0.112 | 0.089 | 0.208 | 0.114 | 0.233 |
| Change in log wage gap | -0.059 | -0.073 | -0.107 | -0.051 | -0.092 |
| Effect of changing means | -.042 | -.052 | -.046 | -.045 | -.052 |
| Effect of changing coefficients | .001 | -.003 | -.011 | .016 | .023 |
| Effect of changing unexplained gap | -.018 | -.018 | -.051 | -.021 | -.063 |
| percent | |||||
| Total change in log wage gap | 100.0 | 100.0 | 100.0 | 100.0 | 100.0 |
| Effect of changing means | 71.1 | 71.7 | 42.6 | 89.3 | 56.2 |
| Age | 4.0 | 0.0 | 1.9 | -3.6 | 1.4 |
| Education level | 10.7 | 14.7 | 8.1 | 28.2 | 19.0 |
| Location | 0.5 | 0.4 | -6.4 | -1.6 | -9.1 |
| Couple and parenthood | 0.5 | 0.5 | -2.8 | -11.3 | 3.9 |
| Job tenure | 1.2 | 0.7 | 5.3 | -3.5 | 0.4 |
| Job status | 4.2 | 4.2 | 1.1 | 2.9 | 0.5 |
| Unionized | 3.9 | 3.8 | 2.3 | 3.8 | 3.2 |
| Firm size | 2.0 | 4.1 | 3.1 | 0.8 | 4.4 |
| Private sector | 1.0 | -0.7 | -0.5 | -0.6 | -0.5 |
| Industry and occupation | 43.0 | 44.0 | 30.6 | 74.2 | 33.0 |
| Effect of changing coefficients | -1.6 | 3.6 | 10.1 | -31.5 | -25.1 |
| Age | -2.8 | -0.8 | 0.8 | 2.1 | -5.1 |
| Education level | -3.7 | -5.4 | 3.9 | -14.3 | -12.2 |
| Location | 1.5 | 1.4 | -4.5 | -30.4 | -18.1 |
| Couple and parenthood | 4.0 | 3.4 | 2.0 | 0.8 | 4.2 |
| Job tenure | -0.5 | 0.0 | 4.8 | 3.1 | 3.4 |
| Job status | 1.9 | 3.4 | 2.1 | 3.5 | 2.1 |
| Unionized | -0.3 | 0.1 | 0.0 | -0.7 | -0.5 |
| Firm size | -1.0 | -1.0 | 0.1 | -2.4 | 0.4 |
| Private sector | -3.4 | -7.3 | -4.8 | -3.5 | 0.6 |
| Industry and occupation | 2.6 | 9.8 | 5.6 | 10.2 | 0.2 |
| Effect of changing unexplained gap | 30.6 | 24.8 | 47.2 | 42.3 | 68.8 |
|
Note: Methodology from Blau and Kahn (2017) adapted approach developed by Juhn, Murphy and Pierce (1991). See Data source, Methods and Definitions section for full details. Source: Statistics Canada, Labour Force Survey, March and September monthly files, 2007, 2008, 2021 and 2022. |
|||||
The effect of changing means measures the contribution of changes in gender differences in measured labour market characteristics on changes in the gender wage gap (Table 5). The variables used in this study explain 71.1% of the narrowing of the overall wage gap between 2007 and 2022. This proportion varies between groups of women relative to Canadian-born men: explaining 42.6% of the narrowing wage gap with Indigenous women and 89.3% of the wage gap with immigrant women landing as children.
Improvements in human capital remain an important factor explaining the narrowing of the gender wage gap between 2007 and 2022 for all groups of women. In general, women’s relative improvement in education, longer job tenure, and full-time employment explained 16.1% of the narrowing gap. This proportion varied by group ranging from 19.6% for Canadian-born women to 27.6% for immigrant women landing as children. Changes in industry and occupation also explained a substantial fraction (43.0%) of the decrease in the gender wage gap overtime for all groups of women. This proportion varied by group ranging from 30.6% for Indigenous women to 74.2% for immigrant women landing as adults. Women from all groups reduced their concentration in service and support occupations and increased their representation in professional occupations. Adverse trends were noted for Canadian-born men – particularly their continued movement away from unionized jobs and from production jobs.
The effect of changing coefficients measures the impact of changes returns to (or how the labour market compensates) wage-determining characteristics on the changing gender pay gap (Table 5). For example, the wage gap may widen (narrow) if there is an increase (decrease) in the return for working in a given occupation or industry in which men are heavily concentrated. For Canadian-born women, changes in the returns to labour market characteristics did not play a key role in the decreasing gender pay gap relative to Canadian-born men (3.6%). The effect of changing coefficients negatively impacted immigrant women particularly due to declining returns to education and to location.
The effect of changing unexplained gaps measures the impact of changes in the unexplained component on changes in the gender pay gap (Table 5). The decline in the unexplained gender wage gap accounted for 30.6% of the narrowing of pay gap between 2007 and 2022. Relative to Canadian-born men, decreases were greatest among immigrant women landing as adults (68.8%) and smallest for Canadian-born women (24.8%). Blau and Kahn (2017 and 2007) noted that this decrease may be attributable to a number of factors including but not limited to decrease in discrimination towards women in the labour market, a decrease in gender differences in wage-determining characteristics that are not included in this study as well as shifts in the demand for labour that favours women.
10. How much of the gender inequality in wages is accounted for by men and women working in the same occupation in the same industry?
The previous sections documented the importance of human capital, job characteristics along with occupation and industry in explaining the persistence in gender pay differences and in explaining why gender pay differentials have narrowed. This section takes on a new perspective. Previous research on the gender pay gap suggests that men and women who do the same work for the same employer receive similar pay, so that the sorting of people into jobs is believed to explain most of the pay gap (Petersen and Morgan, 1995; Penner et al, 2019).
Here, we use the LFS data to show how much of the gender inequality in wages is accounted for (i) by men and women working in the same occupation; (ii) by men and women working in the same industries and (iii) by men and women working in the same job defined here as working in the same occupation in the same industry.Note
The analysis takes its inspiration from Penner et al (2023). We estimate 4 Ordinary Least Squares regression models. The dependent variable is logarithm of hourly wages, and the independent variables include a constant, gender, age, education, job tenure and full-time status. The first model controls for human capital characteristics (age, education, job tenure and full-time status). In subsequent models, we include the covariates in Model 1 and introduce a fixed effect that compares only men and women in the same industry (Model 2), only men and women who work in the same occupation (Model 3), and only men and women who work in the same job defined as working in the same occupation and in the same industry (Model 4). The exercise is repeated for women from different groups relative to Canadian-born men. The results are in Table 6.
| Group | Year | Unadjusted log wage gap | Baseline Gap (Model 1) | Within | Proportion within job | ||
|---|---|---|---|---|---|---|---|
| Industry (Model 2) | Occupation (Model 3) | Job (in same occupation and same industry) (Model 4) | |||||
| All workers | 2007-2008 | -0.171 | -0.179 | -0.168 | -0.160 | -0.143 | 79.9 |
| 2021-2022 | -0.112 | -0.145 | -0.132 | -0.124 | -0.103 | 71.0 | |
| Relative to Canadian-born men | |||||||
| Canadian-born women | 2007-2008 | -0.163 | -0.163 | -0.160 | -0.159 | -0.138 | 84.7 |
| 2021-2022 | -0.089 | -0.138 | -0.120 | -0.118 | -0.093 | 67.4 | |
| Indigenous women | 2007-2008 | -0.315 | -0.221 | -0.166 | -0.157 | -0.132 | 59.7 |
| 2021-2022 | -0.208 | -0.163 | -0.129 | -0.127 | -0.094 | 57.7 | |
| Immigrant women landing as children | 2007-2008 | -0.164 | -0.171 | -0.137 | -0.124 | -0.106 | 62.0 |
| 2021-2022 | -0.114 | -0.150 | -0.122 | -0.121 | -0.096 | 64.0 | |
| Immigrant women landing as adults | 2007-2008 | -0.325 | -0.414 | -0.346 | -0.303 | -0.269 | 65.0 |
| 2021-2022 | -0.233 | -0.361 | -0.289 | -0.251 | -0.204 | 56.5 | |
|
Note: The entries represent the coefficient on a dummy variable for women. A negative coefficient indicates that the hourly wages of women are less than those of men. All coefficients are significantly different from reference group (men) at 95% significance level. The Baseline Gap (Model 1) reports the difference in log wages controlling for age, education, job tenure and full-time status. Building on Model 1, subsequent models provide estimates of within industry (Model 2), within occupation (Model 3) and within same occupation and industry (Model 4) using fixed effects for industry, occupation and job cell. The final column reports the proportion of the gender difference from the Baseline Gap that remains when comparing men and women working in the same occupation and same industry. See Data sources, Methods and Definitions section for full details. Source: Statistics Canada, Labour Force Survey, March and September monthly files, 2007, 2008, 2021 and 2022. |
|||||||
Within-job gender differences are smaller but sizeable in 2022. For example, after making adjustments for differences in human capital factors (age, education, job tenure and full-time status Model 1), the gender gap in hourly wages in 2022 ranged from 13.8% for Canadian-born women to 36.1% for immigrant women landing as adults relative to Canadian-born men. The within-job gender differences (Model 4) are similar for Canadian-born women (9.3%), Indigenous women (9.4%) and immigrant women landing as children (9.6%). Immigrant women landing as adults faced the largest within-job gender differences (20.4%) in the same year.
Within-job gender differences shrunk for most groups but continue to be a substantial source of the wage gap. Comparing the results from Model 1 to Model 4, within-job differences account for 67.4% of the gap for Canadian-born women in 2022 down from 84.7% in 2007. In other words, 67.4% of the gender difference in pay remains when we compare Canadian-born men and women in the same job. This was slightly lower for Indigenous women (57.7%) and for immigrant women landing as adults (56.5%).
The role of sorting of men and women into occupations and industries in creating gender pay differences is highlighted when comparing the results of Model 2 and Model 3. Here, the evidence suggests that sorting into both industries and occupations play a role in producing gender differences in pay for all groups but more so for Indigenous and immigrant women landing as adults. For Indigenous women, after adjusting for differences in human capital factors (Model 1), their gender gap in hourly wages in 2022 was 16.3% compared to 12.7% within-occupations (Model 3). The numbers for immigrant women landing as adults were 36.1% and 25.1% in the same year. In summary, the large observed gap for Indigenous women in 2022 was mostly due to job sorting. In comparison, immigrant women landing as adults were disadvantaged in both job sorting and within-job pay gaps.
11. How do changing employment rates contribute to the narrowing gender wage gap?
Since women’s employment rates were lower in 2007 than in 2022, it is necessary to examine the possible contribution of changing rates to the narrowing of the gender wage gap. For example, a selection bias is created when employed women have a greater earnings potential than women who are not employed. As more women with lower earnings potential enter the labour market, this would represent a change in the selection bias and would alter the measurement of the gender wage gap over time.
Baker et al (1995) demonstrate a simple selection correction technique to control for changing selection bias that may affect comparisons of the unadjusted wage gap over time. To isolate the impact of changing selection bias, wages are linked to a consistent mix of characteristics at different points in time (see Data sources, Methods and Definitions).
| Change in the gender log wage gap between 2007-2008 and 2021-2022 | |||
|---|---|---|---|
| Unadjusted log wage gap | Selectivity adjusted log wage gap k = 0 | Selectivity adjusted log wage gap k = 0.9 | |
| All workers | -.059 | -.060 | -.068 |
| Relative to Canadian-born men | |||
| Canadian-born women | -.073 | -.077 | -.087 |
| Indigenous women | -.107 | -.121 | -.163 |
| Immigrant women landing as children | -.051 | -.052 | -.058 |
| Immigrant women landing as adults | -.092 | -.096 | -.122 |
| Source: Statistics Canada, Labour Force Survey, March and September monthly files, 2007, 2008, 2021 and 2022. | |||
At the aggregate level, 80.0% of women aged 20 to 54 were employed in 2022, up from 77.4% in 2007. The selectivity-adjusted wage gap shrinks slightly more than previously reported for 2007 to 2022: an additional 0.1 to 0.9 percentage point increase over the 5.9 percentage point change in the unadjusted wage gap (Table 7).
Given that employment rates vary between women from diverse groups and have advanced at different rates since 2007, these aggregate results may not be reflective of the situation for diverse groups of women. Canadian-born women (83.3%) had the highest rate in 2022 followed by immigrant women landing as children (79.5%), Indigenous women (73.0%) and immigrant women landing as adults (71.6%). Indigenous women reported the largest gain in employment since 2007 (9.1 percentage points).
Addressing selection bias for all groups of women shrinks the wage gap more than previously reported for 2007 to 2022 but to varying degrees. Selection effects are small for Canadian-born women and immigrant women landing as children. The wage gap shrinks by an additional 0.4 to 1.4 percentage points for Canadian-born women and 0.1 to 0.7 percentage points for immigrant women landing as children. Selection effects are larger for Indigenous and immigrant women landing as adults. The wage gap shrinks by an additional 1.4 and 5.6 percentage points for Indigenous women and by an additional 0.4 and 3.0 percentage points for immigrant women landing as adults. This suggests that for Indigenous and immigrant women landing as adults, the average skills of new entrants in the labour market command lower wages than those employed in both years.
12. Conclusion and discussion
Given issues of gender wage inequality, it is worthwhile to examine whether the wage outcomes vary for groups of women with different population characteristics as well as the degree to which they confirm or deviate from typical patterns.
The main conclusion is that the data presented here do not support the idea that the overall gender wage gap is a good indicator of the gaps faced by different groups of women. Along many dimensions – such as educational attainment, part-time status, sector and cohort - Canadian-born women typically face smaller gender wage gaps compared to Indigenous and immigrant women landing as adults. This further illustrates the importance of examining the intersection of gender and group when studying wage differentials between men and women.
Another major finding is that many of the traditional explanations of the gender wage gap continue to be relevant for understanding gender wage differentials and changes in the gap over time. While the convergence between men and women from all groups in terms of traditional human capital factors such as education, job tenure, and shifts in occupations played an important role in narrowing the gap, these factors explain little of the gap in 2022.
Another major finding is that within-job gender differences are smaller than the overall unadjusted gender gaps but remain sizeable, shrunk for most groups, and continue to be a substantial source of the overall wage gap. Furthermore, sorting into jobs plays a much larger role in producing gender differences in pay for Indigenous and immigrant women landing as adults. How men and women are distributed across jobs reflects several supply-side and demand-side factors, preferences of individual workers as well as traditional roles within families. This remains an active area for future research.
Understanding differences in pay between men and women is complex and requires analysis from a number of different perspectives. Our review of the data was designed to shed light on how Indigenous and immigrant women experience the Canadian labour market differently than Canadian-born women. Taking these factors into consideration informs policymakers interested in issues related to gender, diversity, inclusion, and equity.
Data sources, Methods and Definitions
Data sources
This article uses March and September data from Labour Force Survey (LFS) from 2007 to 2022. The LFS is a monthly household survey collecting information about the labour market activities of the population aged 15 years excluding residents of collective dwellings, persons living on reserves and other settlements in the province, and full-time members of the Canadian forces.
The analytical sample includes paid workers aged 20 to 54 living in the ten provinces excluding full-time students and unpaid family members. Full-time students are excluded since their main activity is going to school. Unpaid family members are excluded since some survey questions are asked differently or not at all comparable to those asked to paid workers.
This article focusses on mutually exclusive and exhaustive population groups as defined by the available LFS data:
- Data for the Indigenous population have been available in the LFS since 2007. Respondents are asked to self-identify as being an Indigenous person, that is, First Nations (North American Indian), Métis, or Inuk (Inuit). A person may also identify with more than one group. Analysis by Indigenous groups was not possible due to small sample sizes.
The LFS target population excludes persons living on reserves and other Indigenous settlements in the province. All information in this article reflects the situation of people living off-reserve in Canada’s ten provinces. According to the 2021 Census, about 80% of the Indigenous population lived off-reserve in the provinces in 2021.
Although the LFS produces data on the territories, a different methodology is used than in the provinces. As a result, estimates for the territories are not included this analysis. According to the 2021 Census (Statistics Canada, 2022a and 2022b), the Inuit population is relatively small (about 75,500) and mostly reside in Nunavut and the Northwest Territories. As such, a large portion of them is not covered in this analysis. - The Canadian-born population refers to non-Indigenous persons born in Canada.
- In January 2006, questions were added to the LFS to identify Canada’s immigrant population. Canada’s immigrant population comprises those individuals not born in Canada and who are granted the right to live in Canada permanently. Persons not born in Canada and that do not reside permanently in Canada are excluded from the analysis.
Respondents are asked to report the year in which they landed in Canada. This may not necessarily coincide with the year in which they arrived in Canada. This important distinction cannot be made with the LFS data.
The immigrant population is further disaggregated by their age at which they landed in Canada. Persons migrating as children (at age 18 or younger) have better labour market outcomes than those landing as adults (over the age of 18). We recognize that outcomes can further vary depending on the respondent migrated in early, middle or older childhood or adulthood. See Rumbaut (2004) for a detailed discussion.
In our sample, about one third of all immigrant women landed in Canada in childhood and two thirds landed in adulthood in both 2007 and 2022. About 90% of Immigrant women landing in Canada as children were considered a long-term immigrant (having arrived more than 10 years ago) while immigrant women landing as adults, are almost equally split between those considered a long-term or recent immigrant.
To ensure sufficient sample sizes for the disaggregated populations of interest, March and September monthly files are pooled for each reference year. These months are independent of one another since the LFS follows a rotating panel sample design in which households remain in sample for six consecutive months.
For analysis of changes over time, combined March and September data from 2007 and 2008 are compared to combined data from survey year 2021 and 2022. Sample weights are adjusted accordingly. Bootstrap methods were used for variance estimation.
When assessing changes in the GWG over time, it is ideal to compare similar points in the business cycle since the impact of economic downturns differs for men and women. Here, the choice of start and end points is data driven since data for Indigenous and immigrant populations first became available after 2007 and 2022 is the most recent data available. Using other similar points in the business cycle (as measured by the unemployment rates), say 2007-2008 and 2017-2018, yields similar qualitative conclusions as the ones reported here.
| 2007-2008 | 2021-2022 | |
|---|---|---|
| number | ||
| Canadian-born men | 65,876 | 48,514 |
| Canadian-born women | 67,542 | 48,128 |
| Indigenous women | 2,694 | 2,822 |
| Immigrant women landing as a child | 3,527 | 3,865 |
| Immigrant women landing as an adult | 6,495 | 10,210 |
| Total | 146,134 | 113,539 |
|
Note: Analytical sample includes paid workers, aged 20 to 54, who are not full-time students. Excludes non-permanent residents. Source: Statistics Canada, Labour Force Survey, March and September monthly files from 2007, 2008, 2021 and 2022. |
||
Methods
1. Blinder-Oaxaca Decomposition
For each year (t), men’s and women’s wage structures (i=m,f) were estimated by the relationship between hourly wages and observed characteristics using ordinary least squares (OLS):
Where the natural logarithm of hourly wages is the dependent variable, X is a vector of wage-determining characteristics described in variables used (age, education, location, couple status and age of youngest child, job status, job tenure, private sector, union status, firm size, industry, and occupation). β is a vector of regression coefficients showing the return to each characteristic. Each coefficient is the percentage change in hourly wage rates associated with a one-unit change in the explanatory variable. We do not make the distinction between a difference in log points and percentage points, even though the approximation is less precise as the difference grows.
The Blinder-Oaxaca decomposition procedure allows for an identification of (i) the proportion of the wage gap owing to differences in worker characteristics and (ii) a portion owing to differences in the returns to those characteristics as well as differences in the constant term. The decomposition is based on the OLS property that the sample average wage, , is equal to the product of the average vector of characteristics, , and the estimated regression coefficient . The log wage differential for each year can be written as:
2. Decomposition of the change in the gender wage gap over time
Following Blau and Kahn (2017, 1997) and Juhn, Murphy and Pierce (1991), the change in the unadjusted wage gap over time can be decomposed into a portion attributable to (i) the effect of changing means, (ii) the effect of changing coefficients and (iii) the effect of changing unexplained gaps.
Using the OLS wage equations in Equation 1.1 for men and women in each of the two years (where t = 0 for 2007-08; t = 1 for 2021-22), then the change in the gender gap in wages can be decomposed into:
The effect of changing means:
The effect of changing coefficients:
The effect of changing unexplained gaps:
Where is a vector of characteristics, and is a vector of estimated regression coefficients; is the male-female difference in the variable immediately following.
3. Within-job wage inequality
Following Penner et al (2023), we estimate 4 OLS regression models with the general form:
The dependent variable is the log earnings for individual i in year t, is a vector of independent variables. The basic model adjusts for human capital characteristics (sex, age, education, job tenure and full-time status). Model 2 includes the covariates of Model 1 and a fixed effect for industry . Model 2 estimates the gender wage gap comparing men and women who work in the same industry. Model 3 and Model 4 are similar to Model 2 but contain the fixed effects for occupation . or occupation-industry . Note that the β coefficients differ in each model. Of interest is the β coefficient on the sex variable (= women) which is interpreted as the relative difference between the average female and male earnings.
4. Addressing selection issues: Simple selection correction
Following Baker et al (1995), the wages of employed workers are estimated by the regression
where is the natural logarithm of the hourly wage of worker i, within the employed population p, of gender g, in time t; and is a vector of wage-determining characteristics (age, education, combination of being in a couple and the age of the youngest child, and location).
The wages of those not employed (whether unemployed or not in the labour force) are estimated using the regression coefficients and their mean characteristics .
Using 2007-2008 as the base year (t=0), a weighted estimate of the mean log wage is calculated for men and women as in year t = 2021-2022: , where and is the employment rate of gender g in year t.
If more women are employed in 2021-2022 than in 2007-2008, ( , Baker et al (1995) determine that this simple correction eliminates new entrants from the mean in year t = 2021-2022. They reason that the inclusion of new entrants lowers women’s mean wage in year t, and as such understates the change in the position of those workers employed in both years. This method estimates sample means with the same mix of characteristics at different points in time.
Also, Baker et al (1995), note that controls for observable differences between those employed and those not employed. It may be sensible to control for unobservable differences by multiplying by a factor of k. Those not participating in the paid labour market are assumed to receive wage offers that are lower than those participating in the paid labour market, as such following Baker et al. (1995), unadjusted results are presented for k=1.0 and k=0.9 .
Definitions
The gender wage gap (GWG) is defined as the difference between the average hourly wage rates of men and women relative to the average hourly wage rate of men. A positive value indicates that men earn more than women. A negative value indicates that women earn more than men.
Hourly wages are adjusted for inflation using the Consumer Price Index.
(Statistics Canada. Table 18-10-0005-01 Consumer Price Index, annual average, not seasonally adjusted https://www150.statcan.gc.ca/t1/tbl1/en/tv.action?pid=1810000501)
Variables used
Age (7 groups): 20 to 24 years; 25 to 29 years; 30 to 34 years; 35 to 39 years; 40 to 44 years; 45 to 49 years; 50 to 54 years.
Education (3 groups): high school diploma or less; post-secondary certificate of diploma, trades certificate or diploma, community college, CEGEP, university certificate below Bachelor’s; Bachelor’s degree or above.
Job tenure (length of current job: 6 groups): 12 months or less; 13 to 35 months; 36 to 59 months; 60 to 119 months; 120 to 239 months; 240 months or longer.
Full-time: equal to one if respondent works 30 hours or more per week, 0 if not.
Permanent job: equal to one if respondent is in a permanent job, 0 if not.
Union status: equal to one if respondent is in a union or covered by a collective bargaining agreement, 0 if not.
Firm size (total number of persons employed at all locations: 4 groups): less than 20; 20-99; 100-499; 500+.
Private sector: equal to one if respondent is employed in private sector, 0 if employed in the public sector.
Couple and parenthood (8 groups): not in a couple and no children; in a couple and no children; in a couple and youngest child aged 0 to 5 years; in a couple and youngest child aged 6 to 12 years; in a couple and youngest child aged 13 to 17 years; in a couple and youngest child over 18 years; not in a couple, youngest child 12 years or younger; not in a couple, youngest child 13 to 17 years; not in a couple, youngest child 18 years or older.
Location (12 groups): Atlantic region; Toronto; Montreal; Vancouver; mid-sized CMA (Ottawa, Hamilton, Winnipeg, Calgary, Edmonton); rest of Quebec; rest of Ontario; rest of Manitoba; Saskatchewan; rest of Alberta; rest of British Columbia.
Industry: North American Industry Classification System 2017, 15 groups.
Occupation: National Occupation Classification 2021, 34 groups.
References
Anderson T. 2019. “Employment of First Nations men and women living off reserve.” 2019, in Aboriginal Peoples Survey, Statistics Canada Catalogue no. 89‑653‑X2019004. Online at: https://www150.statcan.gc.ca/n1/pub/89-653-x/89-653-x2019004-eng.htm
Antonie L, Gatto L and Plesca M. 2020. “Full-Time and Part-Time Work and the Gender Wage Gap”. 2020, in Atlantic Economic Journal, Vol. 48, pp. 313–32
Baker M, Dwayne B, Desaulniers A, and Grant M. 1995. “The distribution of the male/female earnings differential, 1971-1990.” 1995, in Canadian Journal of Economics 28(3): 479-501.
Baker M and Milligan K. 2008. “Maternal employment, breastfeeding, and health: Evidence from maternity leave mandates.” 2008, in Journal of Health Economics, Vol. 27, Issue 4, pp. 871-887.
Baker M, and Drolet M. 2010. “A new view of the male/female pay gap.” Canadian Public Policy Volume 36 Issue 4, December 2010, pp. 429-464.
Becker, G. S. 1994. Human Capital: A Theoretical and Empirical Analysis with Special Reference to
Education, Third Edition. Chicago and London: University of Chicago Press.
Blau F. and Kahn L. 1997. “Swimming Upstream: Trends in the Gender Wage Differential in 1980s”, in Journal of Labor Economics, 1997, vol. 15, issue 1, pp. 1-42.
Blau F. and Kahn L. 2007. “The Gender Pay Gap: Have Women Gone as Far as They Can?”, in Academy of Management Perspectives, 2007, Vol. 21, No. 1, pp. 7-2. Online at: http://www.jstor.org/stable/4166284
Blau F and Kahn L. 2017. “The Gender Wage Gap: Extent, Trends and Explanations.” 2017, in Journal of Economic Literature, Vol. 55(3), pp. 789–965.
Bleakney A, Masoud H and Robertson H. 2021. “Labour market impacts of COVID-19 on Indigenous people living off reserve in the provinces: March 2020 to August 2021.” 2021, in StatCan COVID‑19:
Data to Insights for a Better Canada. Statistics Canada Catalogue no. 45‑28‑0001.
Bonikowska A and Hou F. 2017. “Labour Market Outcomes of Immigrant Women who Arrive as Dependents of Economic Immigrant Principal Applicants.” 2017, in Analytical Studies Branch Research Paper Series, no. 390. Statistics Canada Catalogue no. 11F0018M.
Bonikowska A, Drolet M, and Fortin NM. 2019. “Earnings inequality and the gender pay gap in Canada: The role of women’s under-representation among top earners.” In Economic Insights, catalogue no. 11-626-X. Ottawa: Statistics Canada.
Boudarbat B and Connolly M. 2013. “The gender wage gap among recent post-secondary graduates in Canada: a distributional approach.” 2013, in Canadian Journal of Economics, Vol. 46, No. 3, pp. 1037-1065.
Drolet M. 2001. “The male-female wage gap.” 2001, in Perspectives on Labour and Income. Statistics Canada Catalogue no. 75-001-XIE.
Drolet, M. 2002. “New Evidence on Gender Pay Differentials: Does Measurement Matter?” 2002, in Canadian Public Policy, Vol. 28, No. 1, pp. 1-16. Online at: https://www.jstor.org/stable/3552156
Drolet M. 2011. “Why has the gender wage gap narrowed?” 2011, in Perspectives on Labour and Income, Statistics Canada Catalogue no. 75-001-X.
Drolet M. 2020. “Equally mobile, equally stable: Gender convergence in labour mobility and job stability in Canada.” 2020, in Labour Statistics: Research Papers, Statistics Canada Catalogue no. 75-004-M – 2020001.
Drolet M. 2022. “Unmasking differences in women’s full-time employment.” 2022, in Insights on Canadian Society, Statistics Canada Catalogue no. 75-006-X.
Fortin N and Huberman M. 2002. “Occupational Gender Segregation and Women's Wages in Canada: An Historical Perspective.” 2002, in Canadian Public Policy, Vol. 28, (s1), pp. 11-39.
Fortin N. 2019. “Increasing earnings inequality and the gender pay gap in Canada: Prospects for convergence.” 2019, in Canadian Journal of Economics, Volume 52, Issue 2.
Frank K and Hou F. 2015. “Source-country Female Labour Force Participation and Wages of Immigrant Women in Canada.” 2015, in Analytical Studies Branch Research Paper Series, no. 365. Statistics Canada Catalogue no. 11F0018M. Online at: Source-country Female Labour Force Participation and the Wages of Immigrant Women in Canada (statcan.gc.ca)
Galarneau D, Brunet S and Corak L. 2023. “Early career job quality of racialized Canadian graduates with a bachelor’s degree, 2014 to 2017 cohorts.” 2023, in Insights on Canadian Society, Statistics Canada Catalogue no. 75-006-X.
Goldin, Claudia. 2014. “A grand gender convergence: Its last chapter.” In American Economic Review 104(4): 1091-1119.
Government of Canada. 2021. “Government of Canada announces that the Pay Equity Act will come into force on August 31, 2021.” Ottawa: Employment and Social Development Canada.
Hahmann T, Robertson H and Badets N. 2019. “Employment characteristics of Métis women and men aged 25 to 54 in Canada.” 2019, in Aboriginal Peoples Survey, Statistics Canada Catalogue no. 89-653-X2019002.
Heisz A. 2005. “The evolution of job stability in Canada: Trends and Comparisons with U.S. Results.” 2005, in Canadian Journal of Economics. 38(1): 105–127.
Hou F and Picot G. 2022. “Immigrant labour market outcomes during recessions: Comparing the early 1990s, late 200s and the COVID-19 recessions.” 2022, in Economic and Social Reports, Statistics Canada Catalogue no. 36-28-001.
Houle R and Yssaad L. 2010. “Recognition of newcomers’ foreign credential and work experience.” 2010, in Perspectives on labour and income, Statistics Canada Catalogue no. 75-001-X.
Hudon T. 2015. “Immigrant women.” Women in Canada: A Gender-based Statistical Report. Statistics Canada Catalogue no. 89-503-X.
Juhn C, Murphy K, and Pierce B. 1991. “Accounting for the slowdown in black–white wage convergence.” 1991.
Lamb D, Banjeree R and Verma A. 2021. “Immigrant-non-immigrant wage differentials in Canada: A comparison between standard and nonstandard jobs.” International Migration Vol. 59, no. 5, pp. 114–133.
LaRochelle-Côté S. and Gilmore J. 2009. “Canada’s employment downturn.” Perspectives on Labour and Income. Statistics Canada Catalogue no. 75-001-X. 10(12), December. Online at: https://www150.statcan.gc.ca/n1/pub/75-001-x/75-001-x2009112-eng.pdf
Liversage A. 2009. “Life below a Language threshold’? Stories of Turkish marriage migrant women
in Denmark.”2009, in European Journal of Women’s Studies, Vol. 16 No. 3, pp. 229-24.
Mueller R. 2019. “The Gender Pay Gap in the Public Sector: Evidence from the Labour Force Survey”. 2019, in SSRN Electronic Journal. Online at: The Gender Pay Gap in the Public Sector: Evidence from the Canadian Labour Force Survey by Richard Mueller :: SSRN
NCCIH (National Collaborating Centre for Aboriginal Health). 2017. “Employment as a social determinant of First Nations, Inuit and Metis Health”).
Penner AM and Willer R. 2019. Men’s Overpersistence and the Gender Gap in Science and Mathematics. 2019. in Socius: Sociological Research for a Dynamic World Vol. 5.
Penner AM, Petersen T, Hermansen AS et al. 2023. Within-job gender pay inequality in 15 countries. Nat Hum Behav 7, 184–189 (2023).
Petersen, T. and L.A. Morgan. 1995. “Separate and unequal: occupation-establishment sex segregation and the gender wage gap” in American Journal of Sociology, Vol. 101 pp. 329-367.
Picot G and Sweetman A. 2012. “Making It in Canada: Immigration Outcomes and Policies.” IRPP
Study 29. Montréal: Institute for Research on Public Policy.
Reid A, Chen H and Guertin R. 2020. “Labour market outcomes of postsecondary graduates, class of 2015.” 2020, in Education, learning and training: Research Paper Series, Statistics Canada Catalogue no. 81-595-M.
Rumbaut RG. 2004. “Ages, Life Stages, and Generational Cohorts: Decomposing the Immigrant First and Second Generations in the United States.” 2004, in The International Migration Review. Vol. 38, No. 3, Conceptual and Methodological Developments in the Study of International Migration (Fall, 2004), pp. 1160-1205.
Schirle T. 2015. “The Gender Wage Gap in the Canadian Provinces, 1997-2014.” 2015, in Canadian Public Policy, Vol.41, No. 4, pp. 309-319 Online at: https://www.jstor.org/stable/43699183
Schirle T and Sogaolu M. 2020. “A Work in Progress: Measuring Wage Gaps for Women and Minorities in the Canadian Labour Market.” 2020, The C.D. Howe Institute. Online at: https://www.cdhowe.org/public-policy-research/work-progress-measuring-wage-gaps-women-and-minorities-canadian-labour-market
Statistics Canada. 2022a. “Indigenous identity by Registered or Treaty Indian status and residence by Indigenous geography: Canada, provinces and territories”, Table: 98-10-0264-01. Online at: https://www150.statcan.gc.ca/t1/tbl1/en/tv.action?pid=9810026401.
Statistics Canada. 2022b. “Indigenous population continues to grow and is much younger than the non-Indigenous population, although the pace of growth has slowed”, in The Daily. 2022-09-21.>.
Zhang S, Garner R, Heidinger L and Findly L. (2017). “Parents’ use of child care services and differences in use by mothers’ employment status.” 2020, in Insights on Canadian Society, Statistics Canada Catalogue no. 75-006-X.
Appendices
| Occupation | Distribution of employment | Proportion of employment in occupation that are women | ||||
|---|---|---|---|---|---|---|
| Men | Women | |||||
| 2007-2008 | 2021-2022 | 2007-2008 | 2021-2022 | 2007-2008 | 2021-2022 | |
| percent | ||||||
| Legislative and senior managers | 0.6 | 0.3 | 0.3 | 0.2 | 30.3 | 35.5 |
| Specialized middle management in administrative services, financial and business services and communication | 2.0 | 1.9 | 2.1 | 2.3 | 50.9 | 53.4 |
| Professional: finance and business | 2.7 | 4.2 | 4.3 | 6.8 | 60.9 | 61.1 |
| Administrative and financial supervisors | 1.8 | 2.8 | 4.2 | 5.2 | 68.8 | 64.3 |
| Administrative and transportation logistics | 0.8 | 1.3 | 6.3 | 7.2 | 89.2 | 84.6 |
| Administrative and financial support and supply chain logistics | 3.6 | 2.5 | 12.0 | 6.5 | 76.4 | 70.0 |
| Specialized middle management occupations in engineering, architecture, science and information systems | 0.8 | 1.3 | 0.3 | 0.4 | 25.9 | 24.3 |
| Professional: natural and applied sciences | 6.8 | 10.2 | 2.1 | 3.6 | 23.0 | 25.2 |
| Technical related to natural and applied sciences | 5.3 | 4.9 | 1.8 | 1.8 | 25.2 | 26.1 |
| Specialized middle management in health care | 0.1 | 0.1 | 0.3 | 0.4 | 75.6 | 79.2 |
| Professionals: health treating, consultation services, therapy and assessment | 0.3 | 0.6 | 1.2 | 1.8 | 78.3 | 73.7 |
| Nursing and allied health professionals | 0.3 | 0.5 | 3.8 | 4.7 | 92.7 | 89.8 |
| Technical occupations in health | 0.6 | 0.8 | 2.9 | 3.7 | 81.3 | 80.8 |
| Assisting occupations in support of health services | 0.5 | 0.8 | 3.7 | 4.6 | 88.8 | 85.5 |
| Managers in public administration, in education and social and community services and in public protection services | 0.7 | 0.7 | 0.8 | 1.1 | 53.8 | 58.7 |
| Professional: law | 0.3 | 0.4 | 0.3 | 0.6 | 52.1 | 62.8 |
| Professional: education services | 2.9 | 2.9 | 6.3 | 7.7 | 67.9 | 71.8 |
| Professional: social and community services or government services | 1.3 | 1.8 | 2.7 | 4.1 | 66.5 | 69.0 |
| Front-line public protection services and paraprofessional in legal, social, community, education services | 1.9 | 2.0 | 3.8 | 4.8 | 66.6 | 70.2 |
| Assisting education and in legal and public protection | 0.5 | 0.6 | 1.4 | 1.7 | 72.1 | 72.5 |
| Care providers and legal and public protection support OR Student monitors, crossing guards and related | 0.1 | 0.1 | 0.9 | 0.9 | 90.1 | 90.7 |
| Specialized middle management in art, culture, recreation and sport | 0.1 | 0.1 | 0.1 | 0.1 | 55.2 | 59.3 |
| Professional: art and culture | 0.5 | 0.6 | 0.6 | 0.6 | 57.4 | 51.7 |
| Technical OR Support in art, culture and sport | 1.2 | 1.2 | 1.5 | 1.4 | 54.9 | 53.4 |
| Middle management in retail and wholesale trade and customer services | 2.7 | 1.7 | 2.5 | 1.2 | 47.1 | 41.0 |
| Retail sales and service supervisors and specialized in sales and services | 3.3 | 4.0 | 3.1 | 3.9 | 47.2 | 47.9 |
| Sales and services, other customer and personal services | 8.7 | 8.2 | 13.2 | 9.7 | 59.7 | 53.0 |
| Sales and service support occupations | 5.1 | 4.7 | 9.7 | 6.6 | 65.1 | 57.6 |
| Middle management occupations in trades and transportation | 1.1 | 1.2 | 0.3 | 0.3 | 20.6 | 18.0 |
| Technical trades and transportation officers and controllers | 30.1 | 27.4 | 2.6 | 2.6 | 7.6 | 8.4 |
| Middle management occupations in production and agriculture | 0.3 | 0.2 | 0.1 | 0.1 | 16.1 | 22.0 |
| Supervisors in natural resources, agriculture and related production | 2.9 | 2.7 | 0.5 | 0.7 | 15.2 | 18.5 |
| Middle management occupations in manufacturing and utilities | 0.9 | 0.9 | 0.2 | 0.3 | 17.9 | 25.9 |
| Processing, manufacturing and utilities supervisors and utilities operators and controllers | 9.4 | 6.7 | 4.3 | 2.5 | 30.5 | 26.0 |
| Source: Statistics Canada, Labour Force Survey, March and September monthly files, 2007, 2008, 2021 and 2022. | ||||||
| Occupation | Median hourly wagesAppendix 1B Note 1 | Gender wage gap | Percent earning less than P25 in occupationAppendix 1B Note 2 | |||||
|---|---|---|---|---|---|---|---|---|
| Men | Women | |||||||
| 2007-2008 | 2021-2022 | 2007-2008 | 2021-2022 | 2007-2008 | 2021-2022 | 2007-2008 | 2021-2022 | |
| Legislative and senior managers | 64.4 | 76.8 | 19.4 | 6.2 | 19.3 | 22.3 | 38.3 | 29.7 |
| Specialized middle management in administrative services, financial and business services and communication | 46.2 | 54.1 | 19.8 | 6.5 | 20.5 | 19.3 | 27.8 | 28.5 |
| Professional: finance and business | 35.9 | 38.2 | 16.2 | 14.4 | 19.2 | 24.6 | 27.5 | 27.3 |
| Administrative and financial supervisors | 28.6 | 30.8 | 12.2 | 9.3 | 17.9 | 16.6 | 24.8 | 26.5 |
| Administrative and transportation logistics | 25.5 | 26.1 | 19.0 | 18.7 | 24.2 | 23.3 | 24.9 | 23.9 |
| Administrative and financial support and supply chain logistics | 23.0 | 23.2 | 3.6 | 2.4 | 17.8 | 21.7 | 31.6 | 27.8 |
| Specialized middle management occupations in engineering, architecture, science and information systems | 56.3 | 60.1 | 15.8 | 9.8 | 23.6 | 22.9 | 29.7 | 31.0 |
| Professional: natural and applied sciences | 42.3 | 44.7 | 9.3 | 11.0 | 22.6 | 23.3 | 31.9 | 31.4 |
| Technical related to natural and applied sciences | 30.5 | 32.0 | 8.8 | 8.2 | 19.9 | 22.8 | 37.8 | 31.7 |
| Specialized middle management in health care | 50.8 | 50.0 | 5.0 | 0.3 | 22.4 | 16.9 | 25.7 | 26.8 |
| Professionals: health treating, consultation services, therapy and assessment | 43.3 | 45.0 | 9.4 | 5.7 | 16.4 | 25.8 | 26.1 | 24.9 |
| Nursing and allied health professionals | 41.0 | 42.0 | -3.2 | -6.8 | 16.3 | 19.8 | 27.5 | 26.2 |
| Technical occupations in health | 29.4 | 31.4 | 1.9 | 12.2 | 26.4 | 32.1 | 24.6 | 22.7 |
| Assisting occupations in support of health services | 22.7 | 23.4 | 3.9 | 0.3 | 32.0 | 35.9 | 24.2 | 23.9 |
| Managers in public administration, in education and social and community services and in public protection services | 50.3 | 52.7 | 9.6 | 13.0 | 7.4 | 10.4 | 33.4 | 33.2 |
| Professional: law | 47.4 | 56.3 | 9.2 | 8.2 | 11.2 | 13.1 | 29.8 | 29.8 |
| Professional: education services | 40.3 | 43.3 | 9.1 | 9.0 | 19.6 | 19.6 | 27.4 | 27.0 |
| Professional: social and community services or government services | 37.0 | 38.5 | 3.4 | 8.5 | 25.3 | 22.4 | 25.0 | 26.3 |
| Front-line public protection services and paraprofessional in legal, social, community, education services | 26.1 | 26.6 | 35.1 | 36.5 | 23.4 | 18.5 | 26.0 | 25.6 |
| Assisting education and in legal and public protection | 27.1 | 26.7 | 22.4 | 17.6 | 17.2 | 16.6 | 31.4 | 30.7 |
| Care providers and legal and public protection support OR Student monitors, crossing guards and related | 17.1 | 20.0 | 28.7 | 10.2 | 12.3 | 14.2 | 26.3 | 26.4 |
| Specialized middle management in art, culture, recreation and sport | 34.9 | 50.2 | 7.7 | 25.9 | 27.6 | 23.6 | 23.4 | 28.0 |
| Professional: art and culture | 31.7 | 35.6 | 2.7 | 3.3 | 24.1 | 11.1 | 25.7 | 32.3 |
| Technical OR Support in art, culture and sport | 24.4 | 28.2 | 8.0 | 12.1 | 22.8 | 21.0 | 26.7 | 29.5 |
| Middle management in retail and wholesale trade and customer services | 27.1 | 36.3 | 28.9 | 21.5 | 16.9 | 18.6 | 32.6 | 31.7 |
| Retail sales and service supervisors and specialized in sales and services | 22.5 | 23.5 | 22.4 | 18.1 | 16.5 | 23.1 | 29.3 | 27.3 |
| Sales and services, other customer and personal services | 18.9 | 21.0 | 17.2 | 12.9 | 15.5 | 20.2 | 36.2 | 34.2 |
| Sales and service support occupations | 14.9 | 17.0 | 16.1 | 7.1 | 20.1 | 21.1 | 28.0 | 30.0 |
| Middle management occupations in trades and transportation | 40.6 | 45.0 | 21.3 | 9.4 | 19.9 | 22.8 | 42.9 | 34.5 |
| Technical trades and transportation officers and controllers | 27.1 | 29.3 | 20.9 | 18.0 | 23.4 | 23.0 | 44.2 | 47.0 |
| Middle management occupations in production and agriculture | 29.3 | 42.7 | 28.8 | 23.4 | 18.6 | 20.4 | 38.9 | 50.4 |
| Supervisors in natural resources, agriculture and related production | 25.4 | 26.5 | 39.5 | 22.8 | 18.6 | 21.9 | 56.9 | 42.5 |
| Middle management occupations in manufacturing and utilities | 45.5 | 48.1 | 13.1 | 7.9 | 22.3 | 25.4 | 36.1 | 23.8 |
| Processing, manufacturing and utilities supervisors and utilities operators and controllers | 22.7 | 24.0 | 30.2 | 19.9 | 15.7 | 17.7 | 45.1 | 44.1 |
|
||||||||
| Industry | Distribution of employment | Proportion of employment in industry that are women | Median hourly wagesAppendix 2 Note 1 | Gender wage gap | ||||||
|---|---|---|---|---|---|---|---|---|---|---|
| 2007-2008 | 2021-2022 | |||||||||
| Men | Women | Men | Women | 2007-2008 | 2021-2022 | 2007-2008 | 2021-2022 | 2007-2008 | 2021-2022 | |
| percent | dollars | percent | ||||||||
| Agriculture, forestry, fishing, hunting & mining, quarrying and oil and gas extraction & utilities | 6.1 | 2.0 | 5.4 | 1.8 | 24.4 | 24.1 | 34.30 | 40.00 | 21.3 | 9.3 |
| Construction | 10.8 | 1.7 | 12.5 | 2.2 | 13.0 | 14.5 | 29.10 | 32.00 | 18.4 | 14.5 |
| Manufacturing | 20.0 | 8.4 | 14.0 | 6.1 | 29.0 | 29.4 | 26.40 | 27.50 | 22.4 | 12.5 |
| Wholesale | 5.2 | 2.9 | 4.8 | 2.5 | 35.1 | 33.2 | 26.00 | 28.90 | 19.9 | 10.2 |
| Retail trade | 9.3 | 12.1 | 9.7 | 10.5 | 56.0 | 50.8 | 17.60 | 20.00 | 23.8 | 16.0 |
| Transporting and warehousing | 7.6 | 2.9 | 6.7 | 2.6 | 27.4 | 26.8 | 27.10 | 28.20 | 9.1 | 12.4 |
| Information and cultural industries | 4.2 | 4.1 | 4.1 | 3.2 | 48.4 | 42.6 | 27.10 | 31.70 | 16.8 | 11.6 |
| Finance and insurance | 3.7 | 7.3 | 5.4 | 6.9 | 65.9 | 55.0 | 29.70 | 36.10 | 28.8 | 20.5 |
| Real estate and rental and leasing | 1.1 | 1.3 | 1.4 | 1.3 | 51.5 | 47.0 | 23.70 | 28.30 | 15.9 | 11.9 |
| Professional, scientific and technical services | 6.5 | 5.6 | 9.3 | 7.9 | 45.8 | 44.9 | 32.60 | 36.90 | 24.0 | 19.7 |
| Educational services | 4.8 | 10.7 | 4.8 | 12.9 | 68.6 | 71.9 | 34.30 | 36.60 | 10.5 | 10.1 |
| Health care and social assistance | 3.5 | 20.4 | 4.8 | 24.4 | 85.1 | 82.9 | 26.40 | 28.00 | 6.5 | 6.2 |
| Accommodation and food services | 4.0 | 6.4 | 3.4 | 4.5 | 61.2 | 55.8 | 14.90 | 17.50 | 13.7 | 8.7 |
| Management of companies and enterprises OR Administrative and support, waste management and remediation services OR Other services (except public administration) | 7.0 | 7.4 | 6.6 | 5.9 | 50.6 | 45.8 | 19.80 | 23.10 | 14.7 | 7.6 |
| Public administration | 6.3 | 6.8 | 7.1 | 7.5 | 51.3 | 50.3 | 36.50 | 40.00 | 10.5 | 7.8 |
|
||||||||||
| Occupation | Canadian-born women | Indigenous women | Immigrant women landing as children | Immigrant women landing as adults | ||||
|---|---|---|---|---|---|---|---|---|
| 2007-2008 | 2021-2022 | 2007-2008 | 2021-2022 | 2007-2008 | 2021-2022 | 2007-2008 | 2021-2022 | |
| percent | ||||||||
| Professional: finance and business | Note ...: not applicable | 6.5 | Note ...: not applicable | Note ...: not applicable | 6.5 | 9.7 | Note ...: not applicable | 7.6 |
| Administrative and transportation logistics | 6.8 | 7.6 | Note ...: not applicable | Note ...: not applicable | 5.7 | 6.8 | Note ...: not applicable | Note ...: not applicable |
| Administrative and financial support and supply chain logistics | 12.0 | 6.5 | 11.4 | 8.0 | 14.8 | 7.2 | 10.4 | |
| Professional: natural and applied sciences | Note ...: not applicable | Note ...: not applicable | Note ...: not applicable | Note ...: not applicable | Note ...: not applicable | Note ...: not applicable | 6.9 | |
| Assisting occupations in support of health services | Note ...: not applicable | Note ...: not applicable | 5.0 | 7.0 | Note ...: not applicable | Note ...: not applicable | 4.9 | 7.4 |
| Professional: education services | 7.0 | 9.3 | Note ...: not applicable | Note ...: not applicable | Note ...: not applicable | Note ...: not applicable | Note ...: not applicable | Note ...: not applicable |
| Professional: social and community services or government services | Note ...: not applicable | Note ...: not applicable | 4.9 | 6.5 | Note ...: not applicable | Note ...: not applicable | Note ...: not applicable | Note ...: not applicable |
| Sales and services, other customer and personal services | 13.2 | 9.1 | 15.6 | 12.3 | 14.5 | 10.5 | 12.3 | 10.6 |
| Sales and service support occupations | 9.0 | Note ...: not applicable | 15.3 | 8.2 | 8.2 | 6.30 | 13.2 | 9.2 |
| Processing, manufacturing and utilities supervisors and utilities operators and controllers | Note ...: not applicable | Note ...: not applicable | Note ...: not applicable | Note ...: not applicable | Note ...: not applicable | Note ...: not applicable | 12.6 | Note ...: not applicable |
| Total employment in top five occupations | 48.0 | 39.0 | 52.2 | 42.0 | 49.7 | 40.5 | 53.4 | 41.7 |
|
... not applicable Source: Statistics Canada, Labour Force Survey, March and September monthly files, 2007, 2008, 2021 and 2022. |
||||||||
| Occupation | Canadian-born men | Canadian-born women | Indigenous women | Immigrant women landing as children | Immigrant women landing as adults | |||||
|---|---|---|---|---|---|---|---|---|---|---|
| 2007-2008 | 2021-2022 | 2007-2008 | 2021-2022 | 2007-2008 | 2021-2022 | 2007-2008 | 2021-2022 | 2007-2008 | 2021-2022 | |
| percent | ||||||||||
| Female-dominatedAppendix 4 Note 1 | 22.4 | 21.3 | 64.5 | 63.0 | 63.7 | 60.5 | 62.3 | 58.8 | 57.4 | 53.3 |
| Male-dominated Appendix 4 Note 2 | 57.9 | 56.0 | 10,7 | 10.7 | 11.5 | 9.9 | 11.9 | 14.0 | 23.1 | 18.4 |
| Mixed Appendix 4 Note 3 | 19.7 | 22.7 | 24.9 | 26.3 | 24.8 | 29.6 | 25.9 | 27.3 | 19.5 | 28.3 |
| Total | 100.0 | 100.0 | 100.0 | 100.0 | 100.0 | 100.0 | 100.0 | 100.0 | 100.0 | 100.0 |
|
||||||||||
| Sample | Year | Mean | 5th percentile | 50th percentile (median) | 95th percentile |
|---|---|---|---|---|---|
| coefficient | |||||
| All men vs all women | 2007-2008 | -0.167 | -0.119 | -0.171 | -0.074 |
| 2021-2022 | -0.113 | -0.041 | -0.121 | -0.131 | |
| Canadian-born women vs Canadian-born men | 2007-2008 | -0.205 | -0.163 | -0.207 | -0.047 |
| 2021-2022 | -0.156 | -0.082 | -0.162 | -0.111 | |
| Indigenous women vs Canadian-born men | 2007-2008 | -0.276 | -0.245 | -0.281 | 0.019 |
| 2021-2022 | -0.198 | -0.114 | -0.196 | -0.152 | |
| Immigrant women landing as children vs Canadian-born men | 2007-2008 | -0.199 | -0.172 | -0.204 | -0.021 |
| 2021-2022 | -0.175 | -0.118 | -0.194 | -0.079 | |
| Immigrant women landing as adults vs Canadian-born men | 2007-2008 | -0.465 | -0.346 | -0.506 | -0.060 |
| 2021-2022 | -0.405 | -0.242 | -0.457 | -0.130 | |
|
Note: Entries represent the coefficient on a dummy variable for women from a regression of log hourly wages controlling for age and education. All coefficients are significantly different from reference group (men) at 95% significance level. The estimated regressions are OLS for the mean and quartile regressions at the indicated quantiles. Source: Statistics Canada, Labour Force Survey, March and September monthly files, 2007, 2008, 2021 and 2022. |
|||||
| 2007-2008 | 2021-2022 | |
|---|---|---|
| percent | ||
| All workers | 14.5 | 10.6 |
| Canadian-born women | 13.6 | 9.1 |
| Indigenous women | 26.2 | 18.3 |
| Immigrant women landing as children | 13.9 | 12.1 |
| Immigrant women landing as adults | 29.2 | 24.2 |
|
Note: The wage gap refers to the difference between the median hourly wage rates of Canadian-born men and women from different groups relative to the median hourly wage rate of Canadian-born men. Source: Statistics Canada, Labour Force Survey, March and September monthly files, 2007, 2008, 2021 and 2022. |
||
- Date modified: