Why has the gender wage gap narrowed?

Archived Content
Information identified as archived is provided for reference, research or recordkeeping purposes. It is not subject to the Government of Canada Web Standards and has not been altered or updated since it was archived. Please "contact us" to request a format other than those available.
By Marie Drolet
Full article in PDF
For this article...
Studies by...
- Women in the labour market
- Women's wages grew faster than men's
- Unadjusted wage gap narrowed
- Wage gap narrowed at all levels of pay
- Wage gap narrowed most among older workers
- Factors contributing to the narrowing wage gap
- For older workers, longer job tenure and shifts in occupation reduced the gap
- Higher education and declining unionization narrowed gap for younger workers
- Declining correlation between wage gap and age
- Does the gender wage gap increase as workers age?
- The role of changing 'selection bias'
- Summary
- Data sources and definitions
The fact that men continue to earn more than women is not new but it is an issue that demands frequent re-examination. The female-to-male earnings ratio—based on the annual earnings of full-year, full-time workers—has held steady at 0.72 since the early 1990s (Statistics Canada 2009). This contrasts with the preceding 20 years during which there was a steady, if modest, narrowing of the earnings gap (Baker et al. 1995). Does this mean that progress towards equal pay has stalled?
Restricting male–female comparisons to full-year, full-time employees does not ensure that equal quantities of work are being compared. That requires a measure that includes both pay and a precise unit of work: hourly wages. On an hourly wage basis, the gap in pay between full-time women and men closed by more than 5 percentage points from the early 1990s to the late 2000s (Baker and Drolet [forthcoming]).1
The main purpose of this article is to examine the factors that contributed to the narrowing of the wage gap (see Data sources and definitions). This article first shows how the relative position of women in the labour market has changed since the 1980s. Next, changes in the wages among men and among women are examined before changes in the wage gap between men and women are addressed. The core analyses estimate the effects of changes in the relative characteristics of male and female workers, the compensation they receive for these characteristics, and labour force participation relative to the evolution of the wage gap. Finally, whether the changing labour market participation of women affects measurement of the wage gap is addressed by way of a selection model.
Women in the labour market
Of women between the ages of 25 and 54, 4 out of 5 participated in the labour market in 2009. That year, women accounted for just over one-half of all employees. But it is the changing relative position of men and women in the Canadian labour market that can be linked to shifts in their labour market outcomes (namely wages).
Job tenure is a case in point. The gender difference in 'in-progress'2 job tenures fell from 33.1 months in 1978 to 6.7 months in 2008 (Chart A). This is due to an increase in average tenure among women: from 68.1 months in 1978 to 92.7 months in 2008—a difference of about 2 years. Alternatively, women were more likely to be in jobs that just started (1 to 3 months tenure) than were men until the early 1990s. After that point there was no appreciable gender difference in the proportion of new starts (Chart B).
The educational attainment of women has been rising in recent decades and now surpasses that of men (Chart C). For example, the proportion of women age 25 to 54 in the labour force that held a university degree rose from 15.7% in 1990 to 29.3% in 2008. The corresponding numbers for men are 17.7% and 25.3%.3 In 2008, 62% of undergraduate degrees and 54% of graduate degrees were granted to women.4
Structural changes in the Canadian economy—like a shift away from manufacturing jobs—had a disproportionately larger impact on the unionization rates of men. As a result, the male–female unionization gap disappeared. In fact, in recent years the proportion of women in unionized jobs5 has been higher than the corresponding figure for men (Chart D).
Women's wages grew faster than men's
Before changes in wage differences between men and women over time are addressed, changes in the relative hourly wages among men and among women must be documented separately (Chart E). On average, women's real wages increased by 11.6% between 1988 and 2008. While increases occurred across all age and wage groups, the most dramatic improvement was among women age 45 to 49 (17.8%) and those at the higher end of the wage distribution (16.0%).
The situation among men is quite different. Overall, men's real wages edged up by 1.3% between 1988 and 2008. However, changes were not consistent across age and wage groups. On average, men age 35 and over and men at the lower end of the wage distribution saw their real wages decline between 1988 and 2008.
Unadjusted wage gap narrowed
The ratio of women's to men's average hourly wages (Chart F) rose from 0.757 to 0.833. In other words, the unadjusted wage gap narrowed by 7.6 percentage points. The gap converged by 5.4 percentage points between 1988 and 1998 and then by 2.2 percentage points the following decade. This is consistent with trends in wage ratios of full-time workers reported in Baker and Drolet (forthcoming).
Wage gap narrowed at all levels of pay
The wage gap narrowed throughout the wage distribution between 1988 and 2008, but it is at the lowest end of the wage distribution where the gap shrank the most (by 11.5 percentage points) and the upper end where the gap shrank the least (by 6.7 percentage points).6
That the gap shrank the most at the lower end of the pay scale corresponds to other results. Between 1988 and 2008, the gap shrank substantially among part-time workers (by 14.1 percentage points) and among workers in clerical occupations (by 12.1 percentage points).
Most female-dominated occupations, like those in health and education, had relatively small wage gaps in 1988 and experienced little change over the period. The exception is clerical occupations—with a wage gap of 24% that was halved by 2008.
Although women dramatically increased their representation in high-wage occupations like management, the wage gaps within these occupations are clearly larger than average. This is not surprising since increasing representation is first apparent in lower-level positions within the occupations. In 2006, for example, women comprised 26% of senior managers compared to 37% of managers at other levels (Statistics Canada 2007).
The wage gap among university graduates remained at 16% over the 1998 to 2008 period. Frenette and Coulombe (2007) attribute the lack of movement in the gap to persistent differences in the fields of study chosen by men and women. Women continue to outnumber men in education and the humanities, while men outnumber women in mathematics and engineering.7
Wage gap narrowed most among older workers
While the wage gap converged in all age groups, older workers experienced the greatest change.8 Reading down the columns in Table 1, the wage gap among workers age 25 to 29 shrank by 5.6 percentage points between 1988 and 2008 (Table 1). Over the same period, the gender wage gap shrank by 16.2 percentage points among 50- to 54-year-olds. Most of the convergence of the gap among younger workers occurred before 1998, while it continued throughout the period for older workers.
Factors contributing to the narrowing wage gap
Factors contributing to the decline in the gender wage gap have not been extensively studied in Canada. Baker and Drolet (forthcoming) show that almost two-thirds of the narrowing wage gap among full-time workers between 1981 and 2008 can be accounted for by changes in the relative characteristics of male and female workers. They conclude that although no one characteristic dominates, changes in educational attainment and the occupations in which men and women work play important roles.
This study adds information on factors contributing to the narrowing wage gap within age groups since compositional changes may have occurred differently for workers of different ages (see Accounting for changes in the wage gap).
For older workers, longer job tenure and shifts in occupation reduced the gap
Between 1988 and 2008, the female–male wage gap closed by 16.2 percentage points among 50- to 54-year-olds. The real wages of women age 50 to 54 grew by 23.4% compared to a slight decline in the real wages of their male counterparts (-1.4%). Roughly two-thirds of the narrowing gender wage gap can be explained by compositional changes (Table 2). In particular, older men were less likely to hold management jobs in 2008 (about 14.0%) than their 1988 counterparts (about 20.0%). This shift, combined with the fact that managers generally earn higher wages, accounted for over one-quarter of the decline in the gender pay gap. Changes in job tenure accounted for another 14.6% of the decline in the wage gap. This was driven by a significant increase in the proportion of women holding long-term jobs9 (14.2 percentage points).
Higher education and declining unionization narrowed gap for younger workers
The growth in real wages of younger women (7.8%) outpaced that of younger men (0.5%) between 1988 and 2008, contributing to the narrowing wage gap among 25- to 29-year-olds. Roughly two-thirds of the narrowing gender wage gap can be explained by compositional changes.
Changes in educational attainment and choice of occupation increased the real wages of younger women. By 2008, 24.1% of younger men and 36.5% of younger women held a university degree. Since education is positively correlated with wages, the increasing educational attainment of younger women accounts for about one-quarter of the narrowing gender wage gap.10 Younger women also moved away from low-paying occupations—like clerical and sales occupations—towards high-paying occupations in health and education, further contributing to the decline in the gender wage gap.
On the other hand, structural changes in the economy had a larger impact on younger men. Younger men experienced a drop in union coverage of 11.3 percentage points. Because unionized workers earn more than non-unionized workers, the contraction of the gender unionization gap lowered the wages of men relative to women. This accounted for 26.8% of the narrowing gender wage gap.
Changes in the pay structure within some industries also contributed to the narrowing gap. For example, men traditionally held most high-paying manufacturing jobs—like auto assembly and metal fabricating—while women held jobs in lower-paying sectors like textiles and clothing. However, the average hourly wages of younger men in manufacturing fell by about 2% between 1988 and 2008 but rose by roughly 10% for younger women.
Declining correlation between wage gap and age
One clear result is that the gender wage gap generally increases with age (reading across the rows of data Table 1, second panel). Since women's characteristics have changed significantly since the earlier cohorts entered the workforce, at any point in time older women's characteristics will be quite different from those of younger women. Women's characteristics, although similar to men's early in their careers, may diverge due to differing educational, occupational and career interruption decisions. When combined, the large gender wage gap among older workers and the smaller wage gap among younger workers are easily explained.
Although there is a correlation between the wage gap and age in all survey years, this correlation becomes smaller each successive year. The gender wage gap was 20.1 percentage points smaller among workers age 25 to 29 than among workers age 50 to 54 in 1988. By 2008, the difference in the gap between younger and older workers shrank to 9.4 percentage points.
The weakening correlation between the wage gap and age suggests a 'cohort replacement effect': as younger cohorts replace older ones, the overall gap declines simply because the gap is smaller (and remains smaller) in new cohorts than in those that preceded them.
Does the gender wage gap increase as workers age?
The comparison made above is between workers from different birth periods. It does not answer the question, "Does the gender wage gap increase as workers age?" The change in the gender wage gap for a given cohort11 over time can be found by reading Table 1 diagonally.12
Using this approach, the gender wage gap was 15.4 percentage points among workers age 25 to 29 in 1988. Ten years later, when the cohort was age 35 to 39, there was a gender wage gap of 19.5 percentage points. Finally, in 2008, when the cohort was age 45 to 49, the wage gap was 21.6 percentage points. These numbers show that the wage gap widened by about 6.2 percentage points for the 1988 cohort over 20 years. This is quite a different finding from the cross-sectional evidence in 2008 where the gap among workers age 45 to 49 in 2008 was 11.7 percentage points higher than among those age 25 to 29. The cross-sectional data tend to overstate the correlation between the wage gap and age.
Repeating the same exercise for the other age groups casts further doubt on the strength of the correlation between age and the gender wage gap observed in cross-sectional data. In fact, the gender wage gap remained stagnant for some cohorts as they aged. For example, among workers age 30 to 34, the gender wage gap was 20.6 percentage points in 1988 and 19.3 points in 2008. For other cohorts, the data show no clear pattern. So for at least some cohorts, part of the narrowing wage gap may be attributable to the fact that men's and women's wages no longer diverged as they aged.
Why did the wages of men and women in these cohorts stop diverging as they aged? Two possible explanations are related to career paths. First, as women's children age, they may be able to devote more time and energy to the paid labour market (by accepting promotions or acquiring training). As a result, the wage gap within a given cohort may have narrowed or remained stagnant since women's enhanced work effort improved their relative earnings capacity. Second, female workers have traditionally been viewed as more likely to quit and be absent from work (Hill 1979), and these predetermined notions of job performance may influence pay as well as job placement (Chandler et al. 1994). However, recent empirical evidence shows that there is little gender difference in permanent quit rates and absenteeism (Zhang 2007). As a result, the wage gap within a given cohort may have narrowed or remained stagnant since quits and absenteeism can no longer be viewed as important explanations for women's lower wages.
The role of changing 'selection bias'
Since women's employment rates were lower in the past, the possible contribution of changing participation rates to the narrowing of the earnings gap should be considered. For instance, if women working in the 1980s had 'above-average' earnings potential relative to those not working in the 1980s, it would constitute a selection bias. As women's employment rates increased, more women with 'average' earnings potential entered the labour market. Such a scenario would represent a change in the selection bias, altering the measurement of the wage gap.
To isolate the impact of changing selection bias, wages must be linked to a consistent mix of characteristics at different points in time. Baker et al. (1995) illustrate a technique to control for changing selection biases that may affect comparisons of unadjusted differentials over time. The technique can also include an adjustment that allows the analyst to make assumptions about unobserved characteristics.
After selection bias is taken into account (see Addressing selection issues: Simple selection correction), the adjusted wage gap shrinks more than previously reported for 1988 to 2008: an additional 1.6 percentage-point increase over the 7.6 percentage-point change in the unadjusted gap. This indicates that the average skills of new entrants in the labour market command lower wages than those who participated both years. If this assumption is extended to unobservable characteristics,13 the gap shrinks an additional 5.1 percentage points compared to the change in the unadjusted gap. According to these assumptions, addressing the selection issue further reduces the gender wage gap between 1988 and 2008 by between 1.6 and 5.1 percentage points.14
For those age 25 to 29 in 1988, the unadjusted gender wage gap widened by 6.2 percentage points over the following 20 years (Table 3). Using selectivity-adjusted wages, the gap widened by 5.4 percentage points or by 2.4 percentage points when unobserved characteristics were taken into account. According to these assumptions, the growth of the wage gap for this cohort is overstated by between 0.8 and 3.8 percentage points when selection effects have not been taken into account. This provides further evidence that the correlation between the wage gap and age is overstated in cross-sectional tabulations.15
Summary
This article explored factors contributing to the decline in the gender pay gap over time. The first major finding—that the growth in women's relative wages outpaced that of men—suggests that the changing composition of the labour force and changes in how the labour market compensates workers played a role in narrowing the gender wage gap.
The second major finding—that men and women entering today's labour market are more alike in terms of characteristics and wages than they were in the past—suggests that part of the decline in the gender wage gap may be due to a cohort-replacement effect. As the younger cohorts 'replace' older cohorts, the overall wage gap declines simply because the gap is smaller for the new cohorts than for those who preceded them.
The third major finding—that cross-sectional evidence tends to overstate the correlation between the wage gap and age—suggests that part of the decrease in the gender wage gap is related to the fact men and women's wages did not diverge as they aged to the same extent as in the past.
These findings provide some insight into the functioning of the Canadian labour market. First, the gender wage gap early in an individual's career is an increasingly good predictor of the wage gap throughout a generation's working life. Second, further declines in the gender pay gap may be difficult to determine since, after the 1988 cohort, there are only moderate declines in the wage gap for younger women from cohort to cohort.
Data sources and definitions
For clarity and consistency, this article refers to the gender wage gap although other measures are presented in the tables. The female–male wage ratio is calculated by dividing the female wage rate for a particular group or cohort by the male wage rate for the same group or cohort. The wage gap for women is calculated by subtracting the female–male wage ratio from 1.0 and expressing it as a percentage (e.g., .169 = 16.9%). The narrowing (or widening) of the gap is calculated by subtracting the gap in the second period from the gap in the first period.
The data are drawn from the 1988 to 1990 Labour Market Activity Survey (LMAS), the 1993 to 1996 Survey of Labour and Income Dynamics (SLID), and the 1998 to 2008 Labour Force Survey (LFS). The unit of measurement is hourly wages expressed in 2007 dollars. Wages refer to usual wages or salaries before taxes and other deductions. Tips, commissions and bonuses are included and paid overtime is excluded.
Following Baker and Drolet (forthcoming), this study looks at paid employees, age 25 to 54, in their main job in May of the reference year. The age restriction limits the impact of social and economic trends: by age 25 most individuals have completed their schooling,16 while the trend towards early retirement did not affect those under age 55.17
The years 1988, 1998 and 2008 were selected since they occur at roughly comparable points in the business cycle. If women's progress is sensitive to business-cycle fluctuations as suggested by Baker et al. (1995), choosing years at comparable points in the cycle should minimize any business cycle effects and any change in the gender wage gap would represent a structural change. The longer period also allows time for compositional changes to occur.
This study uses a proxy measure of experience based on age. This proxy overstates women's actual labour market experience and deviates further from the actual measure as workers age.18 The experience gap widens among female workers as they age, partially reflecting the fact that older women were part of a generation that was less inclined to combine work and family than younger women. As long as older female workers in 2008 had, on average, longer work experience than their counterparts in 1988, actual work experience would explain part of the wage gap convergence. The findings of Drolet (2001) suggest that the omitted variable—actual labour market experience—was increasing for women during the period.
Accounting for changes in the wage gap
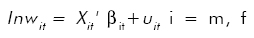
For each year (t), men's and women's wage structures (i=m,f) were estimated by the relationship between hourly wages and observed characteristics using ordinary least squares (OLS)
 (Equation 1)
where the natural logarithm of hourly wages is the dependent variable, X is a vector of wage-determining characteristics (age, age squared, education [3 groups], part-time, union, married or common law, tenure [6 groups], industry [17 groups], occupation [10 groups], and province [10 groups]);19 β is a vector of regression coefficients showing the return to each characteristic; and u is a normally distributed error term. Each coefficient is the percentage change in hourly wage rates associated with a one-unit change in the explanatory variable.
The literature has developed using Blinder-Oaxaca's decomposition procedure that allows for an identification of the proportion of the gender wage gap owing to differences in worker characteristics and a portion owing to differences in the returns to those characteristics as well as differences in the constant term. The decomposition is based on the OLS property that the sample average wage, , is equal to the product of the average vector of characteristics,
  , and the estimated regression coefficients
  .
.
The log wage differential for each year (t) can then be expressed as:20
 .21 (Equation 2).
Following Baker et al. (1995), the change in the unadjusted wage differential over time can be decomposed into a part due to changes in the mean characteristics within the sample and changes in the returns to those characteristics. The change between periods (t-1) and t may be expressed as
 (Equation 3).
The first component is the change in the wage gap due to changes in the relative mean characteristics across groups weighted at group-specific prices at time t. The second term is the change due to trends in the relative returns of these characteristics across groups, weighted by group-specific period (t-1) means of the explanatory variables.
Addressing selection issues: Simple selection correction
Following Baker et al. (1995), the wages of those in the sample of participants (or those with wages observed) are estimated by the regression  where
where  is the natural logarithm of the hourly wage of worker i, within the sample of participants p, of gender g, in time t; and
  is a vector or wage determining characteristics (age, education, marital status, presence of preschool children, and region). Second, the wages of those not in the sample of participants n (or those with unobserved wages)
  are estimated using the regression results
  and their mean characteristics,
 . Using 1998 as the designated base year (t=0), a weighted estimate of the mean log wages is calculated for men and women as:
  , where
 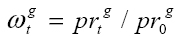 and
and  is the employment rate of gender g in year t. Finally, by construction
  controls for observable differences between participants and non-participants, however, it may be prudent to control for unobservable differences by multiplying by k. If those not participating in the paid labour market are assumed to receive wage offers lower than those participating in the labour market, then k < 1. Following Baker et al. (1995), adjusted results are presented for k = 1.0 and k = 0.9.
Notes
- A complete analysis of the differences in the level and trend of the gender earnings gap and the gender wage gap can be found in Baker and Drolet (forthcoming).
- These measures do not reflect completed job tenure—they measure job length at the time of the survey. Job tenure measures the number of consecutive months or years a person has worked for the current (or most recent) employer. The employee may have worked in one or more occupations or in one or more locations or businesses and still be considered to have continuous tenure if the employer has not changed. But if a person has worked for the same employer over different periods of time, job tenure measures the most recent period of uninterrupted work. A temporary layoff does not constitute an interruption.
- Author's calculations from Labour Force Survey estimates, CANSIM Table 282-0004.
- Author's calculations from CANSIM Table 477-0014.
- Includes those not represented by a union but covered by a collective bargaining agreement.
- The percentile rankings refer to each sex's own wage distribution. An alternative method is to calculate the average female percentile ranking in the male wage distribution. This indicator shows that women 'moved up' in the male pay distribution—on average, women out-earned 32% of men in 1988, 37% in 1998 and 39% in 2008.
- CANSIM Table 477-0013.
- Baker and Drolet (forthcoming) note similar results for full-time workers.
- Long-term jobs are those that last at least 20 years.
- Information on major field of study is missing from this analysis. See Frenette and Coulombe (2007) for a more detailed discussion.
- Here the term 'cohort' is used to describe a 'synthetic cohort' defined by date of birth. A synthetic cohort is constructed from repeated cross-sectional surveys. This permits the average labour market outcomes (in this case wages) of workers in different birth periods to be tracked over time. This differs from studies using panel data that track the outcomes of individual workers over time. As long as the cross-sectional sample is representative, this approach should approximate changes in the gender wage ratio over time for workers within the same birth period. A drawback of this approach is the assumption that the population is fixed. In other words, individuals observed working at age 25 to 29 in 1988 are assumed to be the same individuals working at age 45 to 49 in 2008. Addressing selection issues: Simple selection correction addresses this assumption and re-estimates changes in the gender wage differential over time.
- Baker and Drolet (forthcoming) present similar results graphically in their Figure 6.
- Setting k=0.9 as indicated in Addressing selection issues: Simple selection correction.
- Similar results are noted by workers of specific age groups.
- The sample of non-participants includes persons who are unemployed, persons who are not in the labour force but able to work, and persons who are self-employed. Alternative samples of non-participants (unemployed only, unemployed, and those not in the labour force) were used to perform a similar analysis. All samples produced similar results.
- Neill (2009) reports that, for the 18- to 24-year-old population, enrolment in full-time university studies increased between 1979 and 2003. This may affect the gender wage ratio for this age group since the type of younger adult working may be systematically changing.
- Milligan and Schirle (2008) document significant changes in the employment rates of older (55 and over) men and little change in the employment rates of older women. Changing retirement patterns may influence the gender wage ratio among older workers since the type of older adult working may be systematically changing.
- Drolet (2001) shows that, in 1997, younger women (25 to 34) spent 84% of their potential years of work experience working full-year, full-time compared to 74% of older women (45 to 54), while men spent over 90% of their potential years of work experience working full-year, full-time, regardless of age. These numbers were calculated using data from the Survey of Labour and Income Dynamics.
- The variables used have been harmonized to provide a consistent concept over the survey years. Concordances for industry coding (from the Standard Industrial Classification [SIC]—used up until 1998—to the North American Industry Classification System [NAICS]) and occupation coding (from the Standard Occupational Classification [SOC] to the National Occupational Classification [NOC]) were used to match, as consistently as possible, at aggregate levels. See Baker and Drolet (forthcoming) for a complete description.
- Results from this specification should be interpreted cautiously since access to occupations, industries and unionized workplaces may be affected by differential treatment of men and women in the labour market.
- The male wage structure is used for comparative purposes. While it is recognized that the choice of wage structure matters (Drolet 2001), questions related to pay differentials are often framed in a manner that asks whether women are paid the same as comparable men.
References
Baker, Michael and Marie Drolet. (forthcoming). "A new view of the male–female pay gap in Canada." Canadian Public Policy. Vol. 36, no. 4. December 2010.
Baker, Michael, Dwayne Benjamin, Andrée Desaulniers and Mary Grant. 1995. "The distribution of the male/female earnings differential, 1970–1990." Canadian Journal of Economics.Vol. 28, no. 3. August. p. 479-501.
Chandler, Timothy D., Yoshinori Kamo and James D. Werbel. 1994. "Do delays in marriage and childbirth affect earnings?" Social Science Quarterly.Vol. 75, no. 4. December. p. 838-853.
Drolet, Marie. 2001. "The male–female wage gap." Perspectives on Labour and Income. Vol. 2, no. 12. December. Statistics Canada Catalogue no. 75-001-XIE. p. 5-13. (accessed November 25, 2010).
Frenette, Marc and Simon Coulombe. 2007. Has Higher Education Among Young Women Substantially Reduced the Gender Gap in Employment and Earnings? Statistics Canada Catalogue no. 11F0019M – No. 301. Analytical Studies Branch Research Paper Series. Ottawa. 26 p. (accessed November 25, 2010).
Hill, Martha S. 1979. "The wage effects of marital status and children." The Journal of Human Resources.Vol. 14, no. 4. Autumn. p. 579-593. (accessed November 25, 2010).
Milligan, Kevin and Tammy Schirle. 2008. Working While Receiving a Pension: Will Double Dipping Change the Elderly Labour Market? Mimeo. Paper prepared for the John Deutsch Institute Conference on Retirement Policy Issues in Canada, October 25-26, 2007, Kingston, Ontario. University of British Columbia. 18 p. (accessed November 25, 2010).
Neill, Christine. 2009. "Tuition fees and the demand for university places." Economics of Education Review.Vol. 28, no. 5. October. p. 561-570. (accessed November 25, 2010).
Statistics Canada. 2009. Income Trends in Canada. Statistics Canada Catalogue no. 13F0022XCB. Ottawa.
Statistics Canada. 2007. Women in Canada: Work Chapter Updates 2006. Statistics Canada Catalogue no. 89F0133XIE. Ottawa. 23 p. (accessed November 25, 2010).
Zhang, Xuelin. 2007. Gender Differences in Quits and Absenteeism in Canada. Statistics Canada Catalogue no. 11F0019M – No. 296. Analytical Studies Branch Research Paper Series. Ottawa. 36 p. (accessed November 25, 2010).
Author
Marie Drolet is with the Social Analysis Division. She can be reached at 613-951-5691 or perspectives@statcan.gc.ca.
- Date modified: