
The Canadian Index of Multiple Deprivation
User Guide

Archived Content
Information identified as archived is provided for reference, research or recordkeeping purposes. It is not subject to the Government of Canada Web Standards and has not been altered or updated since it was archived. Please "contact us" to request a format other than those available.
Skip to text
Text begins
Correction Notice
The population counts have been revised with the appropriate version. The appropriate version of population data was used to calculate the 2016 and 2021 CIMD indices and the CIMD scores and quintiles are correct. The adjustment to the files does not affect the “fitness for use”.
For more information, users should consult The Canadian Index of Multiple Deprivation: Dataset related to this product.
Acknowledgements
This project has benefited from the input and comments of many participants.
In particular, the Canadian Centre for Justice Statistics (CCJS) at Statistics Canada gratefully acknowledges the contributions of Dr. Flora Matheson, Dr. Jim Dunn of St. Michael’s Hospital, and their team. Together, they developed the 2006 Canadian Marginalization Index, which was the inspiration for the Canadian Index of Multiple Deprivation (CIMD). Dr. Matheson and her team were consulted about the inception of the CIMD and continuously provided valuable feedback and support throughout its development.
Additionally, CCJS also acknowledges the contributions of several divisions at Statistics Canada, including the Social Statistics Methods Division, the International Cooperation and Methodology Innovation Centre, the Dissemination Division, the Standards Division, the Social and Aboriginal Statistics Division, and the Census Operations Division.
Background of the Canadian Index of Multiple Deprivation
By their very nature, measures of deprivation and marginalization can be difficult to analyze through traditional administrative data sources simply because certain populations of interest may not be well-represented. The use of area-based, geographically derived indexes, however, have a long history and are increasingly used in social population research (e.g., health, education and justice). One of the benefits of these indexes is that they can provide information for even the most marginalized populations.
One such index, developed by the research team, led by Dr. Flora Matheson at St. Michael’s Hospital, is the 2006 Canadian Marginalization Index (CAN-Marg) (Matheson et al. 2012b). Having used the 2006 CAN-Marg to inform research concerning issues of overrepresentation in the justice system, the Canadian Centre for Justice Statistics (CCJS) at Statistics Canada worked in collaboration with Dr. Matheson and her team to develop a revised index using the most recent microdata from the 2016 Census of Population.
As part of the 2016 index, it was decided to develop both national and provincial/regional indexes. As a result of the change in scope to include these sub-national indexes, the methodology employed in the process varied from that used for the 2006 CAN-Marg. Given the nature and extent of the changes relative to the 2006 CAN-Marg, the 2016 index was renamed the “Canadian Index of Multiple Deprivation” (CIMD). In addition, the four associated dimensions of deprivation were also revised and re-named to ensure a better reflection of the data included within each dimension. The new dimensions of deprivation included in the CIMD are: residential instability, economic dependency, ethno-cultural composition and situational vulnerability.
It should be noted that the CAN-Marg and the CIMD share a similar foundation, and they should be viewed as complementary data sources. While the CAN-Marg is longitudinal in nature, using the same census variables across iterations of the index to allow for comparisons across time, the CIMD accounts for the evolving nature of the variables associated with marginalization and provides users with a dynamic cross-sectional view of deprivation.
The information in this user guide outlines uses for the index as well as a brief description of the methodology behind the development of all included indexes. This user guide also provides instructions on how to use the index, considerations when using the CIMD data, as well as instructions for citing the index.
Uses for the index
The CIMD allows for an understanding of inequalities through various measures of social well-being, including health, education and justice. While it is a geographically-based index of deprivation and marginalization, it can also be used as a proxy for an individual.Note 1 When coupled with a research file, the CIMD can be used for comparisons by geographical location or by selected sub-groups (e.g., males versus females, offenders versus non-offenders, etc.). As a result, the CIMD has the potential to be widely used by researchers on a variety of topics related to socio-economic research. Other uses for the index include:
- Policy planning and evaluation. The CIMD serves as an area-based measure of socio-economic conditions and, as such, it can help to better understand social inequalities by region, especially outside major urban centres for which data may not be as readily available. For example, if the objective is to better understand neighbourhoods requiring a need for more affordable housing, the CIMD could help identify neighbourhoods in need of additional resources.
- Research and analysis. The CIMD can be used as a proxy for individual-level information, meaning that information is available for various populations of interest. As a result, the CIMD could be used to analyze various issues, such as the socio-economic inequalities between offenders who have one contact with the criminal justice system versus those who have repeated contact.
- Resource allocation. As a geographical measure of health and social well-being, the CIMD can be used to identify marginalized communities and allow for better allocation of resources. For instance, in light of the recent opioid crisis in many areas of Canada, the CIMD could be used to better understand characteristics of areas in which overdoses appear to be highest, and therefore assist in the planning and allocating of resources that are required and help reduce the number of instances.
Methodology
To create the CIMD, microdata from the 2016 Census of Population were used to derive indicators at the dissemination area (DA)-level. A DA is a small, relatively stable geographic unit composed of one or more adjacent dissemination blocksNote 2 where populations generally range from 400 to 700 persons. DAs cover all the territory of Canada, and are the smallest standard geographic area for which all census data are disseminated. Using data from the provinces, the index provides information for 54,775 DAs. For more information on the Census of Population, see Statistics Canada 2016.
Creating the four dimensions of deprivation
Factor analysis, which summarizes data so that relationships and patterns can be easily interpreted and understood, was used for the CIMD. This statistical technique reduces a large number of variables into a few numbers of factors by grouping variables into distinct themes. It allows researchers to investigate concepts that are not easily measured by collapsing a large number of variables into a few interpretable factors. In factor analysis, each factor captures a certain amount of overall variation in the observed variables. The factors that explain the least amount of variance are typically discarded.Note 3
For the purpose of the CIMD, thirty-seven variables were chosen for the preliminary model. These variables were selected because of their known association with deprivation and marginalization, as established by the CAN-Marg and through consultations with subject matter experts. Some variables were conceptually similar to others, so a preliminary factor analysis was conducted to identify variables that were found to be related to multiple themes. These variables were subsequently removed, resulting in 24 initial input variables (Appendix A). The next step was to remove variables that were not significantly correlated with any factors. This resulted in 17 variables contributing to the four dimensions of deprivation for the national index (Figure 1).
A separate factor analysis was conducted for the national index and each of the provincial/regional indexes. The following section provides specifics for each index.
Dimensions and corresponding indicators
As previously mentioned, the four dimensions of deprivation included in the CIMD are: residential instability, economic dependency, ethno-cultural composition and situational vulnerability. Each dimension, as described below, encapsulates a comprehensive range of concepts, providing the user with multi-faceted data to examine different aspects of deprivation.
The first dimension of deprivation, residential instability, speaks to the tendency of neighbourhood inhabitants to fluctuate over time, taking into consideration both housing and familial characteristics. For example, the indicators in this dimension at the national-level measure concepts such as the proportion of the population who have moved in the past five years, the proportion of persons living alone, and the proportion of occupied units that are rented rather than owned.
Economic dependency, the second dimension of deprivation in the CIMD, relates to reliance on the workforce, or a dependence on sources of income other than employment income. For example, the indicators included in this dimension, at the national-level, measure concepts such as the proportion of the population aged 65 and older, the dependency ratio (the population aged 0-14 and population aged 65 and older divided by the population aged 15-64), and the proportion of the population not participating in the labour force.
The third dimension of deprivation is ethno-cultural composition. This dimension refers to the community make-up of immigrant populations, and at the national-level, for example, takes into consideration factors such as the proportion of population who are recent immigrants, the proportion of the population who self-identified as visible minority,Note 4 the proportion of the population born outside of Canada, and the proportion of the population with no knowledge of either official language (linguistic isolation).
Situational vulnerability is the fourth dimension represented in the CIMD, speaks to variations in socio-demographic conditions in the areas of housing and education, while taking into account other demographic characteristics. For example, the indicators in this dimension at the national-level measure concepts such as the proportion of the population aged 25 to 64 without a high-school diploma, the proportion of the population identifying as Aboriginal, and the proportion of dwellings needing major repairs.
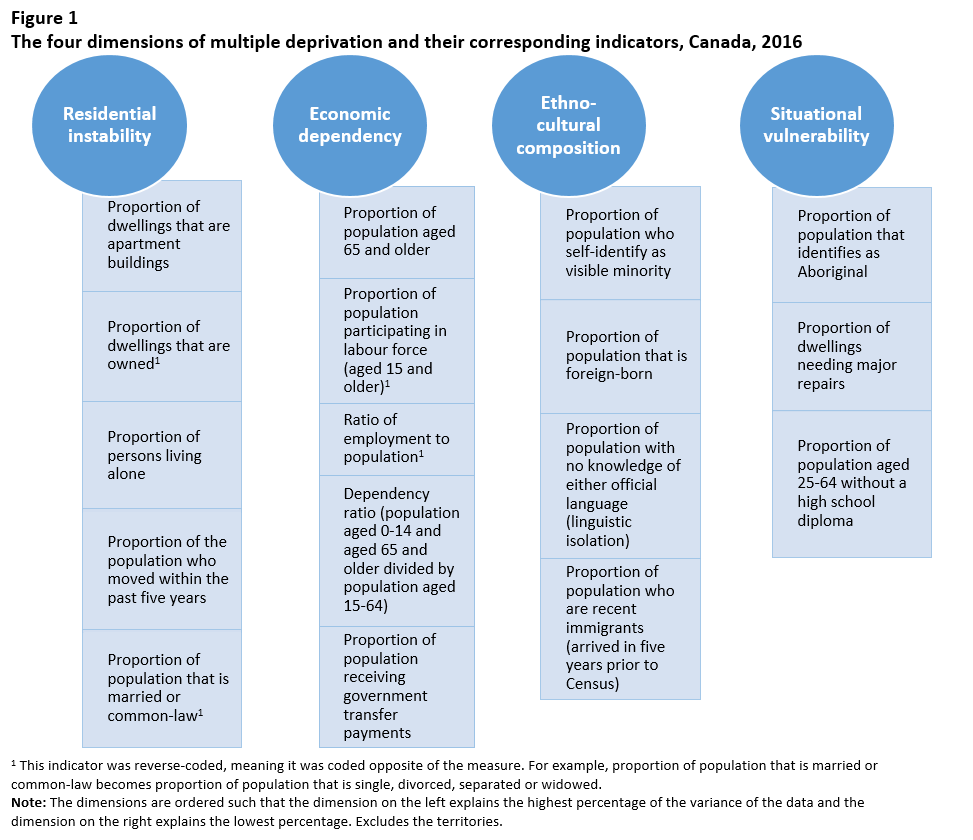
Description for Figure 1
The four dimensions of multiple deprivation and their corresponding indicators, Canada, 2016
The first dimension is residential instability which includes the following indicators: proportion of dwellings that are apartment buildings, proportion of dwellings that are owned,Note 1 proportion of persons living alone, proportion of the population who moved within the past five years, and proportion of population that is married or common-law.Note 1
The second dimension is economic dependency which includes the following indicators: proportion of population aged 65 and older, proportion of population participating in labour force (aged 15 and older),Note 1 ratio of employment to population,Note 1 dependency ratio (population aged 0-14 and aged 65 and older divided by population aged 15-64), and proportion of population receiving government transfer payments.
The third dimension is ethno-cultural composition which includes the following indicators: proportion of population who self-identify as visible minority, proportion of population that is foreign-born, proportion of population with no knowledge of either official language (linguistic isolation), and proportion of population who are recent immigrants (arrived in five years prior to Census).
The fourth dimension is situational vulnerability which includes the following indicators: proportion of population that identifies as Aboriginal, proportion of dwellings needing major repairs, and proportion of population aged 25-64 without a high school diploma.
Note: The dimensions are ordered such that the dimension on the left explains the highest percentage of the variance of the data and the dimension on the right explains the lowest percentage. Excludes the territories.
Provincial and regional indexes
In addition to the national index, three provincial and two regional indexes were developed. The provincial indexes include: Quebec, Ontario and British Columbia. Given confidentiality and data quality considerations, data for the Atlantic provinces, and the Prairie provinces were grouped to create indexes at the regional-level. Specifically, the CIMD is available for the Atlantic region (Newfoundland and Labrador, Prince Edward Island, Nova Scotia and New Brunswick), and the Prairie region (Manitoba, Saskatchewan and Alberta). The Territories (Yukon, Northwest Territories and Nunavut) were excluded from the analysis, as the factors which were found to be relevant in the provinces were not found to be applicable in the territorial context.
In order to create the provincial and regional indexes, the 24 initial input variables that were associated with the four dimensions of deprivation at the national-level were used as the starting point. From there, the same process of factor analysis that was used for the national index was performed using the corresponding microdata for each of the three provinces and two regions.
Provincial and regional indexes were created as a result of different indicator variables loading within the four dimensions of deprivation for each province and region. For example, the variable related to single parent families is an indicator of deprivation within the dimension of situational vulnerability for British Columbia, but not at the national-level. These individual indexes, therefore, better illustrate differences of deprivation—as well as inequalities in various measures of socio-economic characteristics—within the different provinces and regions.
When to use the national or provincial and regional indexes
It is important to note that provincial and regional indexes should not be direct comparisons, as the variables included within each of the four dimensions varies depending by index. For comparability across provinces and regions, the national-level CIMD should be used.
Defining the area of study can help determine which index to use–the national index or a specific provincial or regional index. For example, to compare areas of deprivation between provinces or regions, or between Canada and a selected province or region, then the national index should be used, since the variables included in each dimension of deprivation are constant for all areas. Although DAs and provincial/regional scores appear in both the national index as well as the respective provincial and regional index, factor scores, quintile values and indicator variables will differ depending on the index.
The provincial and regional indexes should be used when users are interested in comparing levels of deprivation for DAs within a certain province or region, as they provide a finer level of granularity. For instance, to compare residential instabilities within major cities in a specific province, then the index for that specific province should be used. For information specific to a province included in a regional index, the province variable within the CIMD file can be used to isolate the requisite DAs for the selected province.
The figures that follow illustrate the variables that loaded into the four dimensions of deprivation for each of the provincial and regional indexes.
The Canadian Index of Multiple Deprivation: Atlantic region
In the Atlantic region, which includes Newfoundland and Labrador, Prince Edward Island, Nova Scotia and New Brunswick, 17 of the 24 input variables were found to be associated with the four dimensions of deprivation (Figure 2). In total, data are available for 4,377 DAs in the Atlantic region.

Description for Figure 2
The four dimensions of multiple deprivation and their corresponding indicators, Atlantic region, 2016
The first dimension is residential instability which includes the following indicators: proportion of persons living alone, proportion of dwellings that are owned,Note 1 proportion of dwellings that are apartment buildings, proportion of population that is married or common-law,Note 1 and proportion of the population who moved within the past five years.
The second dimension is economic dependency which includes the following indicators: proportion of population aged 65 and older, proportion of population participating in labour force (aged 15 and older),Note 1 dependency ratio (population aged 0-14 and aged 65 and older divided by population aged 15-64), ratio of employment to population,Note 1 and proportion of population receiving government transfer payments.
The third dimension is ethno-cultural composition which includes the following indicators: proportion of population who are recent immigrants (arrived in five years prior to Census), proportion of population with no knowledge of either official language (linguistic isolation), proportion of population that is foreign-born, and proportion of population who self-identify as visible minority.
The fourth dimension is situational vulnerability which includes the following indicators: proportion of population that identifies as Aboriginal, proportion of dwellings needing major repairs, and proportion of population aged 25-64 without a high school diploma.
Note: The dimensions are ordered such that the dimension on the left explains the highest percentage of the variance of the data and the dimension on the right explains the lowest percentage. The Atlantic region includes the provinces of Newfoundland and Labrador, Prince Edward Island, Nova Scotia and New Brunswick.
The Canadian Index of Multiple Deprivation: Quebec
In Quebec, 18 of the 24 input variables were found to be associated with the four dimensions of deprivation (Figure 3). Data are available for 13,410 DAs in Quebec.
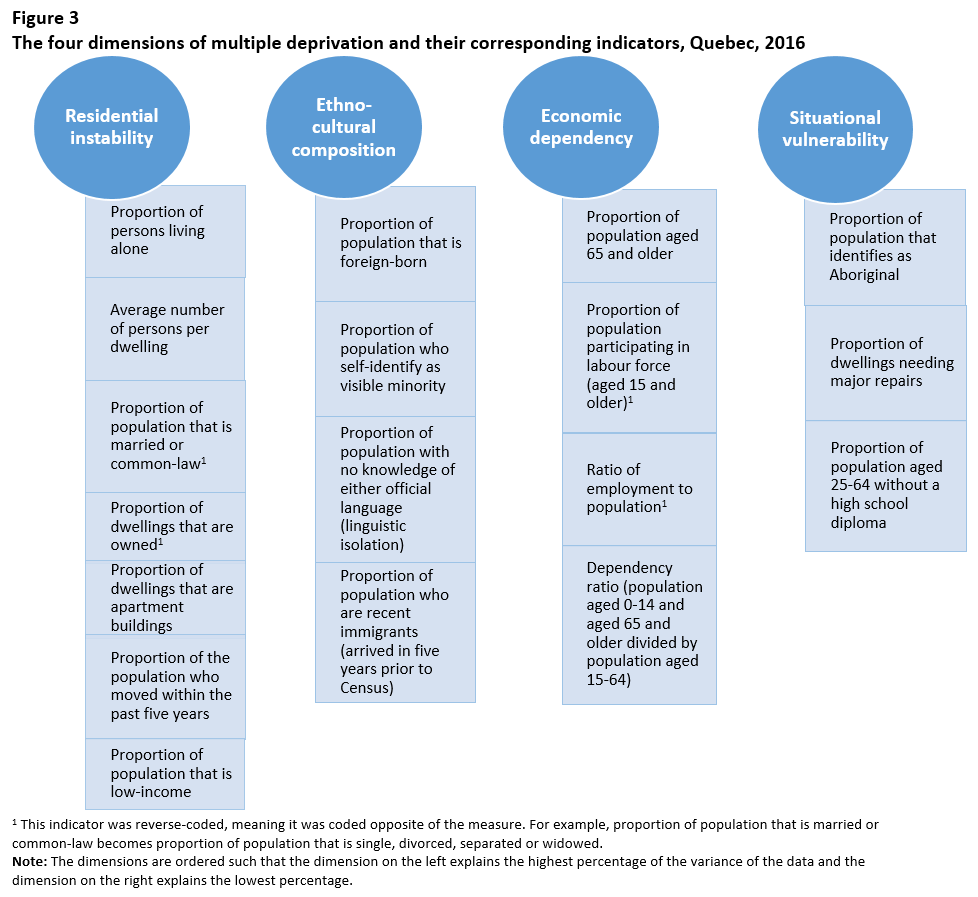
Description for Figure 3
The four dimensions of multiple deprivation and their corresponding indicators, Quebec, 2016
The first dimension is residential instability which includes the following indicators: proportion of persons living alone, average number of persons per dwelling, proportion of population that is married or common-law,Note 1 proportion of dwellings that are owned,Note 1 proportion of dwellings that are apartment buildings, proportion of the population who moved within the past five years, and proportion of population that is low-income.
The second dimension is ethno-cultural composition which includes the following indicators: proportion of population that is foreign-born, proportion of population who self-identify as visible minority, proportion of population with no knowledge of either official language (linguistic isolation), and proportion of population who are recent immigrants (arrived in five years prior to Census).
The third dimension is economic dependency which includes the following indicators: proportion of population aged 65 and older, proportion of population participating in labour force (aged 15 and older),Note 1 ratio of employment to population1Note 1 and dependency ratio (population aged 0-14 and aged 65 and older divided by population aged 15-64).
The fourth dimension is situational vulnerability which includes the following indicators: proportion of population that identifies as Aboriginal, proportion of dwellings needing major repairs, and proportion of population aged 25-64 without a high school diploma.
Note: The dimensions are ordered such that the dimension on the left explains the highest percentage of the variance of the data and the dimension on the right explains the lowest percentage.
The Canadian Index of Multiple Deprivation: Ontario
In Ontario, 17 of the 24 input variables were found to be associated with the four dimensions of deprivation (Figure 4). Data are available for 19,893 DAs in Ontario.

Description for Figure 4
The four dimensions of multiple deprivation and their corresponding indicators, Ontario, 2016
The first dimension is residential instability which includes the following indicators: proportion of dwellings that are apartment buildings, proportion of dwellings that are owned,Note 1 proportion of persons living alone, proportion of the population who moved within the past five years, and proportion of population that is married or common-law.Note 1
The second dimension is economic dependency which includes the following indicators: proportion of population aged 65 and older, proportion of population participating in labour force (aged 15 and older),Note 1 ratio of employment to population,Note 1 dependency ratio (population aged 0-14 and aged 65 and older divided by population aged 15-64), and proportion of population receiving government transfer payments.
The third dimension is ethno-cultural composition which includes the following indicators: proportion of population that is foreign-born, proportion of population who self-identify as visible minority, proportion of population with no knowledge of either official language (linguistic isolation), and proportion of population who are recent immigrants (arrived in five years prior to Census).
The fourth dimension is situational vulnerability which includes the following indicators: proportion of population that identifies as Aboriginal, proportion of population aged 25-64 without a high school diploma, and proportion of dwellings needing major repairs.
Note: The dimensions are ordered such that the dimension on the left explains the highest percentage of the variance of the data and the dimension on the right explains the lowest percentage.
The Canadian Index of Multiple Deprivation: Prairie region
In the Prairie region, which includes Manitoba, Saskatchewan and Alberta, 14 of the 24 input variables were found to be associated with the four dimensions of deprivation (Figure 5). In total, data are available for 9,891 DAs in the Prairie region.

Description for Figure 5
The four dimensions of multiple deprivation and their corresponding indicators, Prairie region, 2016
The first dimension is situational vulnerability which includes the following indicators: proportion of population that identifies as Aboriginal, proportion of population that is low-income, proportion of population aged 25-64 without a high school diploma, proportion of dwellings needing major repairs, and proportion of single parent families.
The second dimension is ethno-cultural composition which includes the following indicators: proportion of population that is foreign-born, proportion of population who self-identify as visible minority, proportion of population who are recent immigrants (arrived in five years prior to Census), and proportion of population with no knowledge of either official language (linguistic isolation).
The third dimension is residential instability which includes the following indicators: proportion of persons living alone, average number of persons per dwelling,Note 1 and proportion of dwellings that are apartment buildings.
The fourth dimension is economic dependency which includes the following indicators: dependency ratio (population aged 0-14 and aged 65 and older divided by population aged 15-64), and proportion of population aged 65 and older.
Note: The dimensions are ordered such that the dimension on the left explains the highest percentage of the variance of the data and the dimension on the right explains the lowest percentage. The Prairie region includes the provinces of Manitoba, Saskatchewan and Alberta.
The Canadian Index of Multiple Deprivation: British Columbia
In British Columbia, 17 of the 24 input variables were found to be associated with the four dimensions of deprivation (Figure 6). Data are available for 7,204 DAs in British Columbia.
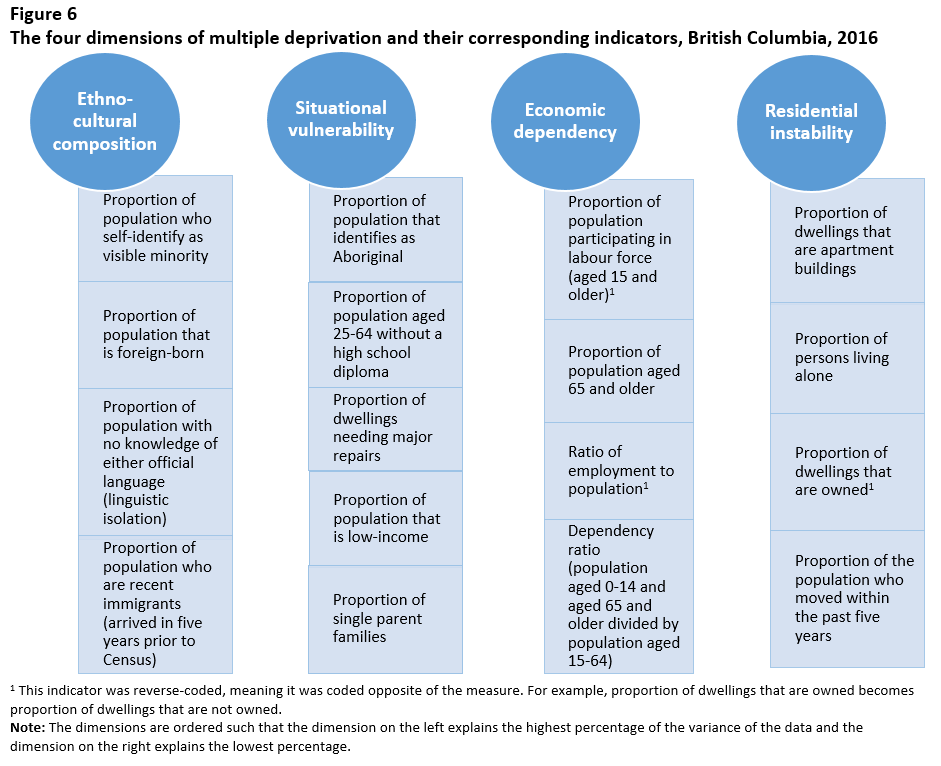
Description for Figure 6
The four dimensions of multiple deprivation and their corresponding indicators, British Columbia, 2016
The first dimension is ethno-cultural composition which includes the following indicators: proportion of population who self-identify as visible minority, proportion of population that is foreign-born, proportion of population with no knowledge of either official language (linguistic isolation), and proportion of population who are recent immigrants (arrived in five years prior to Census).
The second dimension is situational vulnerability which includes the following indicators: proportion of population that identifies as Aboriginal, proportion of population aged 25-64 without a high school diploma, proportion of dwellings needing major repairs, proportion of population that is low-income, and proportion of single parent families.
The third dimension is economic dependency which includes the following indicators: proportion of population participating in labour force (aged 15 and older),Note 1 proportion of population aged 65 and older, ratio of employment to population,Note 1 and dependency ratio (population aged 0-14 and aged 65 and older divided by population aged 15-64).
The fourth dimension is residential instability which includes the following indicators: proportion of dwellings that are apartment buildings, proportion of persons living alone, proportion of dwellings that are ownedNote 1 and proportion of the population who moved within the past five years.
Note: The dimensions are ordered such that the dimension on the left explains the highest percentage of the variance of the data and the dimension on the right explains the lowest percentage.
Analytical guidelines
For each dimension, the CIMD is provided in two forms: factor scoresNote 5 and quintiles.
Factor scores were constructed from the factor analysis process. Lower scores for each dimension correspond to areas that are the least marginalized, while higher scores for each dimension relate to areas that are the most marginalized.
For ease of use, the CIMD also provides users with quintile rankings. Within each dimension, the factor scores were ordered from smallest to largest and then divided into five equally sized groups, or quintiles, and categorized from 1 through 5. A value of 1 corresponds to DAs that were the least deprived for that dimension, and a value of 5 corresponds to DAs that were the most deprived. Note that depending on a DA’s characteristics, it could be the most deprived for one dimension and the least deprived for another.
Creating a composite dimension of deprivation
Depending on the research question and the geographical area of interest, it may be possible to create a composite dimension, or summary score, of deprivation using the quintile scales provided in the CIMD. In order to create a composite index, correlations between individual dimensions and the outcome would first need to be compared to determine if the associations are in the equivalent direction. If all of the dimensions are moving in the same direction, then a composite score of deprivation may be generated by summing the quintile scores across each of the dimensions, and dividing by 4. This will produce a summary score from 1 to 5, with 1 representing the least deprived and 5 representing the most deprived.
Using the index as an individual-level proxy
While the original intent of the CIMD was to act as a geographical indicator, the index can also be used as a proxy for individual-level (i.e., person-level) information.Note 6 For example, CCJS originally created a 2006 version of the CIMD specific to Saskatchewan in order to better understand factors that contribute to initial, as well as repeated contact, with the criminal justice system. This analysis looked at the various dimensions of deprivation (e.g., residential instability) and compared them across sub-groups of offenders, highlighting differences of deprivation among one-time offenders, repeat offenders and chronic offenders (Boyce et al. 2018). In order to achieve this, postal codes of individuals within the cohort of interest were mapped to corresponding DAs.
It should be noted that if the CIMD data will be merged with another data file where DA information is not available, clean postal code information is required. The recommended tool is the Postal Code Conversion File (PCCF)Note 7 which links six character postal codes to standard geographic areas such as DAs (Statistics Canada 2017). By linking postal codes to DAs, the conversion file facilitates the extraction of subsequent aggregation of data for selected DAs. As such, when postal code information is available, it is possible to link special extracts of data to various sources. For more information on the Postal Code Conversion File (PCCF), see Statistics Canada 2017.
Data considerations
Global non-response rate
For reasons of data quality, DAs with a global non-response rate equal to or greater than 50% were excluded from the factor analysis (Statistics Canada 2016).
Dissemination area suppression
All provincial DAs from the 2016 Census of Population were used in the creation of the indexes. However, for reasons of confidentiality, factor scores and quintiles were suppressed for 519 DAs with populations of less than 40 (Statistics Canada 2016). Stated otherwise, while CIMD data are available for nearly all of the provincial DAs, there is a small subset for which data are not available.
Cross-sectional data
The CIMD is based on 2016 Census of Population microdata and, as such, should not be compared with the 2006 or 2011 CAN-Marg for trend analysis. As mentioned, the CIMD is a cross-sectional index which allows users to observe the levels of deprivation and marginalization at one point in time while the CAN-Marg is longitudinal in nature, allowing for comparisons across time.
Grouping Atlantic and Prairie regions
As indicated earlier, it was necessary to group certain provinces into the Atlantic and Prairie regions for data quality reasons. As such, a unique index is not available for these provinces. However, as discussed, it is possible to use data from a specific province by separating specific provincial DAs within those regions.Note 8
Instructions for citing the data
In referencing the Index, please use the following citation:
Statistics Canada. 2019. “The Canadian Index of Multiple Deprivation”. Statistics Canada Catalogue no. 45-20-0001.
For additional information on the foundations of the original Canadian Marginalization Index, the seminal work of Matheson et al. can also be referenced:
Matheson, F. I., et al. 2012. "Development of the Canadian Marginalization Index: a new tool for the study of inequality." Canadian Journal of Public Health, S12-S16.
Matheson, F. I., et al. 2011. Ontario Marginalization Index (ON-Marg): User Guide, St. Michael's Hospital.
Appendix A
| Variable description | Factor analysis status |
|---|---|
| Proportion of persons living alone | Included |
| Average number of persons per dwelling | Included |
| Proportion of dwellings that are apartment buildings | Included |
| Proportion of population that is married or common-law | Included |
| Proportion of dwellings that are owned | Included |
| Proportion of population who moved within the past five years | Included |
| Proportion of population aged 25-64 without high school diploma | Included |
| Proportion of single parent families | Included |
| Proportion of population receiving government transfer payments | Included |
| Proportion of population that is low-income | Included |
| Proportion of dwellings needing major repairs | Included |
| Proportion of population aged 65 and older | Included |
| Dependency ratio (population aged 0-14 and population aged 65 and older divided by population aged 15-64) | Included |
| Proportion of population participating in the labour force (aged 15 and older) | Included |
| Proportion of population who are recent immigrants (arrived in five years prior to Census) | Included |
| Proportion of population who self-identify as visible minority | Included |
| Proportion of population that identifies as Aboriginal | Included |
| Proportion of population that is foreign-born | Included |
| Proportion of population with no knowledge of either official language (linguistic isolation) | Included |
| Proportion of population aged 15-24 not attending school | Included |
| Proportion of population that is self-employed | Included |
| Proportion of population that is female | Included |
| Ratio of employment to population | Included |
| Proportion of children younger than age 6 | Included |
| Proportion of population that are youth (aged 5-15) | Removed |
| Proportion of population that is unemployed (aged 15 and older) | Removed |
| Residential mobility (different house as 1 year ago) | Removed |
| Average household income | Removed |
| Average dollar value of dwelling | Removed |
| Proportion of occupied units that are rentals | Removed |
| 2016 population count | Removed |
| Average number of persons per room | Removed |
| Average income of individuals | Removed |
| Median income of individuals | Removed |
| Proportion of persons separated, divorced or widowed | Removed |
| Proportion of persons per square kilometer | Removed |
| Proportion of population with no religious affiliation | Not availableTable A1 Note 1 |
| Proportion of owner households spending 30% or more of household income on major payments | Not availableTable A1 Note 1 |
| Proportion of tenant household spending 30% or more of household income on rent | Not availableTable A1 Note 1 |
| Proportion of population at least 15 years old and doing unpaid housework | Not availableTable A1 Note 1 |
| Proportion of population at least 15 years old looking after children without pay | Not availableTable A1 Note 1 |
| Proportion of population at least 15 years old and providing unpaid care or assistance to seniors | Not availableTable A1 Note 1 |
| Unemployment rate in private households with children younger than age 6 | Not availableTable A1 Note 1 |
|
|
References
Boyce, J., S.Te, and S. Brennan. 2018. “Economic profiles of offenders in Saskatchewan.” Juristat. Statistics Canada Catalogue no. 85-002-X.
Kim, J.-O. and C.W. Mueller. 1978a. “Factor analysis: Statistical methods and practical issues.” Sage University Paper Series on Quantitative Applications in the Social Sciences. no. 07-014.
Kim, J.-O. and C.W. Mueller. 1978b. “Introduction to factor analysis: What it is and how to do it.” Sage University Paper Series on Quantitative Applications in the Social Sciences. no. 07-013.
Matheson, F.I., J.R. Dunn, K.L.W. Smith, R. Moineddin, and R.H. Glazier. 2012a. Canadian Marginalization Index: User Guide, St. Michael's Hospital.
Matheson, F.I., J.R. Dunn, K.L.W. Smith, R. Moineddin, and R.H. Glazier. 2012b. “Development of the Canadian Marginalization Index: A new tool for the study of inequality.” Canadian Journal of Public Health. Vol. 103, p. S12-S16.
O’Rourke, N. and L. Hatcher. 2014. A step-by-step approach to using SAS for factor analysis and structural equation modeling. SAS Institute Inc., Second Edition.
Statistics Canada. 2017. Postal Code Conversion File (PCCF), Reference Guide. Statistics Canada Catalogue no. 92-154-G.
Statistics Canada. 2016. Guide to the Census of Population, 2016. Statistics Canada Catalogue no. 98-304-X.
- Date modified: