
Indigenous Peoples Thematic Series
Access to prescription insurance and medication use during the COVID-19 pandemic among First Nations people living off reserve, Métis and Inuit in the provinces
by Andrew Canning, Lydia Clarke-Rehman, Iman Dar, Nazih Nasrallah and Mohan B. Kumar
Skip to text
Text begins
Acknowledgements
This study was a collaboration with the Congress of Aboriginal Peoples (CAP), carried out as part of the Transformational Approach to Indigenous Data (TAID) with the goal of building Indigenous data capacity and improving the visibility of Indigenous People in Canada’s National Statistics.
Highlights
Lack of access to prescription insurance can cause adverse health impacts, particularly for marginalized populations, including Indigenous people, who experience a higher burden of pre-existing conditions and inadequate access to health care. Prescription insurance coverage in Canada is currently comprised of a mix of private plans (employer-sponsored and self-funded) and public plans, which vary by province. The federal government also provides coverage to select groups, including Status First Nations people and Inuit under the federally-run Non-Insured Health Benefits program (NIHB). Previously prescription insurance and medication use were examined in the provinces for the general Canadian population and among racialized and immigrant subpopulations, but not among Indigenous groups.
To address these gaps, this study used data from the 2021 Survey on Access to Health Care and Pharmaceuticals During the Pandemic (SAHCPDP) to examine prescription insurance and medication use during the previous 12 months among First Nations people living off reserve, Métis and Inuit living in the provinces. Key findings from the study include the following:
- Close to three-quarters of First Nations people living off reserve (74%) reported having full-year prescription insurance coverage, which was about 10 percentage points higher than for Métis (63%), Inuit (65%) and non-Indigenous people (64%).
- Non-Status First Nations people (23%) were nearly twice as likely to report having no prescription insurance coverage compared to Status First Nations people (12%).
- About two-thirds of First Nations people living off reserve and non-Indigenous people (67%) had medication needs in the past 12 months. Métis (70%) were more likely and Inuit (56%) less likely to have medication needs compared to non-Indigenous people.
- Medication for cardiovascular issues (heart disease, high cholesterol, and high blood pressure) was the most commonly reported prescription medication type across Indigenous and non-Indigenous groups. The percentage of individuals needing medications to treat these conditions ranged from 24%E of Inuit to 33% of non-Indigenous people. Across Indigenous groups, over one in four used medications to treat mental health conditions, which was almost 10 percentage points higher than for non-Indigenous people (27% First Nation people, 27% for Métis, 26%E for Inuit, and 18% for non-Indigenous people).
- Among those with medication needs, First Nations people living off reserve were less likely to lack full-year prescription insurance coverage (24%) compared to non-Indigenous people (33%), though large disparities were apparent between Status First Nations people (18%) and non-Status First Nations people (44%).
- Overall, the percentage of individuals reporting out-of-pocket spending on medications was lower among First Nations people living off reserve (38%) and Inuit (24%E ) than that reported by Métis (68%) and non-Indigenous people (70%). Non-Status First Nations people (69%) were more likely to report out-of-pocket spending on prescription medications than Status First Nations people (29%). Specifically, non-Status First Nations people (39%) were nearly twice as likely to spend up to $250 on prescription medications compared to Status First Nations people (21%), and nearly four times as likely to spend $250 or more (29% versus 8%).
- Among First Nations people living off reserve, those who had less than full-year prescription insurance coverage were nearly three times more likely to not adhere to their prescription medication due to cost (22%) than those who had full-year coverage (8%E). This trend remained after adjusting for other factors, with those who lacked full-year coverage having three times higher odds of non-adherence compared to their counterparts who had full-year coverage.
- Among Métis, those who had less than full-year prescription insurance coverage were more than twice as likely to non-adhere to their prescription medication due to cost (20%) than those who had full-year coverage (8%). This trend remained after adjusting for other factors, with those who lacked full-year coverage having more than twice the odds of non-adherence compared to their counterparts who had full-year coverage.
Introduction
Despite the enduring legacies of colonialism, and being subjected to systemic exclusion, marginalization, discrimination in the health care system and broadly, First Nations people, Métis and Inuit have demonstrated resilience and resourcefulness through traditional community-based systems, developing innovative ways of bridging gaps in financial and policy support (Allan & Smylie, 2015). Nonetheless, they continue to experience barriers and racism in the health care system, including with respect to access to medicines (Moscou et al., 2023).
Access to affordable pharmaceuticals is essential to managing and addressing the health care needs of the population. Many in Canada, including Indigenous people, rely on prescription medication insurance to meet their medication needs (Health Canada, 2020). Insurance coverage in Canada has been described as a complex “patchwork” of public and private plans with varying policies across jurisdictions regarding eligibility criteria and payment schemes (e.g., deductibles, coinsurance, copays) (Brandt et al., 2018). Provincial and territorial plans typically cover select populations such as seniors, children, those with low incomes or people with serious medical conditions (Government of Canada, 2019). In addition, all provinces provide catastrophic coverage for financial catastrophes that can arise from inordinately high drugs costs.
Studies have shown that close to two-thirds of Canadians report having employer-provided drug coverage (Barnes & Anderson, 2015; Bolatova & Law, 2019), with increasing prevalence as incomes rise (Bolatova & Law, 2019). Approximately one in five Canadians reported lacking insurance to cover prescription drug costs in 2016 (Law et al., 2018). During the pandemic, about four in five Canadians living in the provinces reported having prescription insurance to cover at least some of the cost of prescription medications for all or part of the previous year (Cortes & Smith, 2022), similar to figures reported before the pandemic (Yang & Gupta, 2024). The federal government provides prescription insurance for select populations, including certain Indigenous populations. First Nations people who are registered under the Indian Act (i.e., Registered or Treaty Indians) and Inuit who are recognized by an Inuit land claim organization are covered under the federally-run Non-Insured Health Benefits (NIHB) program. According to policy, NIHB is considered the payer of last resort and only covers drug costs in instances where an eligible claimant does not have existing coverage under a social program, provincial or territorial plan, or through a private employer-sponsored plan (Indigenous Services Canada, 2023). Other Indigenous groups such as non-Status First Nations people and Métis rely on a combination of public and private plans similar to non-Indigenous people.
While there is some information on prescription insurance coverage among Indigenous people, data gaps remain, particularly during the COVID-19 pandemic. According to a government annual report for the 2020-2021 fiscal year, there were 898,839 total eligible individuals for NIHB – 848,247 (94.4%) were First Nations people, while 50,592 (5.6%) were Inuit (Indigenous Services Canada, 2022).
Some issues have been raised in the literature regarding NIHB eligibility. For instance, Allan and Smylie (2015) highlighted that Métis and non-Status First Nations people lack access to NIHB services and resources yet face similar social determinants of health as Status First Nations people and Inuit. Wale and Lavoie (2015) identified other limitations of NIHB including discrepancies between policy and practice.
Gaps in prescription insurance coverage can result in individuals not taking medications as prescribed, which can have serious repercussions. There is a substantive literature in Canada and the United States on the behavioural impacts and health risks associated with unaffordable prescribed medications (Briesacher et al., 2007; Cortes and Smith, 2022; Government of Canada, 2019; Hennessey et al., 2016; Holbrook et al., 2021; Kennedy & Morgan, 2009; Law et al., 2012; Law et al., 2018; Lopert et al., 2018). A recent systematic review on cost-related medication non-adherence (hereafter referred to as medication non-adherenceNote ) in Canada revealed that prevalence of medication non-adherence ranged from 5.1% to 10.2% (Holbrook et al., 2021). Recent estimates produced by Statistics Canada also showed that medication non-adherence was considerably higher for those without prescription insurance (Cortes & Smith, 2022; Yang & Gupta, 2024).
A range of factors have been identified as being associated with higher prevalence of non-adherence, including high out-of-pocket drug expenses, lower household income or financial flexibility, lack of prescription insurance, younger age, poor self-reported health, and province of residence (Holbrook et al., 2021). For instance, a study comparing drug insurance models in Canada and the United States found that compulsory publicly funded models (i.e., the Quebec model) had the lowest prevalence of non-adherence after controlling for specific factors (Kennedy & Morgan, 2009).
Within the Indigenous population in Canada, higher prevalence of non-adherence has been noted (Kemp et al., 2010; Law et al., 2018). Law et al. (2018) found that nearly 11% of Indigenous people engaged in non-adherence, with odds nearly two-times higher than that reported by non-racialized, non-Indigenous people. Given that Indigenous people experience higher rates of poverty (Arriagada et al., 2020) and chronic health conditions (Hahmann & Kumar, 2022), high out-of-pocket expenditures for medications are expected to pose a significant health risk.
The current study examines prevalence of prescription insurance coverage, the impact of the pandemic on insurance coverage, medication use, the impact of appointment disruptions on getting new prescriptions, out-of-pocket spending on medications, and cost-related medication non-adherence among Indigenous people during the pandemic.
These findings could inform policies and programs pertaining to pharmaceutical access for Indigenous people.
Results
Study population
The Indigenous population covered by the survey includes adults (aged 18 years and older) who live in the provinces and outside of First Nations reserves. Approximately 40% of Status First Nations people lived on reserve in 2021 (Statistics Canada, 2021) and most Inuit in Canada live in Inuit Nunangat, which is comprised of the Inuvialuit region (northern Yukon and northwestern part of the Northwest Territories), the territory of Nunavut, Nunavik (northern Quebec) and Nunatsiavut (northern Labrador). The exclusion of the territories and the population living on reserve is important to consider when interpreting the results, given the exclusion of a substantive proportion of the Inuit population and the First Nations population.
The median age was lowest among Inuit (37 years), followed by First Nations people (40 years) and Métis (43 years). Among non-Indigenous people, the median age was 47 years. Men (49%) and women (51%) were equally represented among First Nations and non-Indigenous people. Among Métis, 58% were men, and among Inuit, 41% were men. Approximately three-quarters of First Nations people (75%) and Métis (74%) lived in urban areas within the provinces. Among First Nations people, those without Status were more likely to live in urban areas (80%) compared to those with Status (73%). Compared to First Nations people and Métis, non-Indigenous people were more likely to live in urban areas (88%), while Inuit were far less likely (34%E) to do so.
Over one in five Métis, Inuit, and non-Status First Nations people living off reserve had no prescription insurance coverage
The SAHCPDP asked respondents about the duration of their prescription insurance coverage in the past 12 months. Respondents could indicate that they had coverage for all of the previous 12 months (full-year coverage), part of the previous 12 months (part-year coverage), or that they did not have coverage (no coverage).
Close to three-quarters of First Nations people living off reserve (74%) reported having full-year coverage, about 10 percentage points higher than Métis (63%), Inuit (65%) and non-Indigenous people (64%). Part-year coverage ranged from 10%E for Inuit to nearly 16% for Métis (Chart 1).
About one in seven First Nations people living off reserve (14%) reported having no coverage, which was significantly lower than the prevalence among non-Indigenous people (21%). One in five Métis (21%) and one-quarter of Inuit (24%E) indicated having no coverage, similar to the prevalence for non-Indigenous people.
Within the First Nations population, non-Status First Nations people (23%) were nearly twice as likely to report having no coverage compared to those with Status (12%). Those without Status also reported higher prevalence of part-year coverage and lower prevalence of full-year coverage compared to those with Status (Chart 2).
Regarding gender comparison, prevalence of prescription insurance coverage was not significantly different between men and women within each Indigenous group, with one exception. Métis men (23%) were significantly more likely to report having no coverage compared to Métis women (17%).

Data table for Chart 1
| First Nations people living off reserve | Métis | Inuit | Non-Indigenous people Data table for chart 1 Note † | |||||||||
|---|---|---|---|---|---|---|---|---|---|---|---|---|
| Percent | 95% confidence interval | Percent | 95% confidence interval | Percent | 95% confidence interval | Percent | 95% confidence interval | |||||
| lower | upper | lower | upper | lower | upper | lower | upper | |||||
Source: Statistics Canada, Survey on Access to Health Care and Pharmaceuticals During the Pandemic, 2021. |
||||||||||||
| Full-year coverage | 74.2 Data table for chart 1 Note * | 71.3 | 76.8 | 63.5 | 60.6 | 66.2 | 65.3 | 54.6 | 74.7 | 64.4 | 63.2 | 65.6 |
| Part-year coverage | 11.7 Data table for chart 1 Note * | 10.0 | 13.6 | 15.6 | 13.6 | 18.0 | 10.3 E use with caution | 5.3 | 19.2 | 14.9 | 14.1 | 15.8 |
| No coverage | 14.1 Data table for chart 1 Note * | 12.0 | 16.6 | 20.9 | 18.6 | 23.4 | 24.3 E use with caution | 16.2 | 34.8 | 20.6 | 19.6 | 21.7 |

Data table for Chart 2
| Status First Nations people Data table for chart 2 Note † | Non-Status First Nations people | |||||
|---|---|---|---|---|---|---|
| Percent | 95% confidence interval | Percent | 95% confidence interval | |||
| lower | upper | lower | upper | |||
Source: Statistics Canada, Survey on Access to Health Care and Pharmaceuticals During the Pandemic, 2021. |
||||||
| Full-year coverage | 79.1 | 76.2 | 81.7 | 58.1 Data table for chart 2 Note * | 51.3 | 64.6 |
| Part-year coverage | 9.4 | 7.7 | 11.3 | 19.3 Data table for chart 2 Note * | 14.7 | 24.8 |
| No coverage | 11.5 | 9.4 | 14.0 | 22.7 Data table for chart 2 Note * | 17.2 | 29.2 |
The COVID-19 pandemic had similar impacts on prescription insurance coverage among Indigenous and non-Indigenous groups
The COVID-19 pandemic impacted employment due to business closures and shutdowns. For those who had prescription insurance coverage under an employer-sponsored benefits plan, there may have been risk of coverage loss in the event of a layoff or furlough.
In the SAHCPDP, respondents who had part-year coverage in the past 12 months and those who did not have coverage in the past 12 months but had coverage prior were asked if the pandemic affected their coverage (e.g., loss of jobs or benefits).
Among those who had part-year or previous coverage, the coverage of one in six First Nations people living off reserve (16%E) and about one in five Métis (22%) and non-Indigenous people (19%) was affected by the pandemic (e.g., loss of job or benefits). There were no significant differences between Indigenous and non-Indigenous people concerning the impact of the pandemic on coverage, nor were there any significant differences between genders within each identity group. Within the First Nations population, there was no significant difference between non-Status First Nations people (18%E) and those with Status (15%E) with respect to the impact of the pandemic on coverage, though it did trend toward significance (p=0.07). Estimates could not be published for Inuit because of a small sample size.
Métis were more likely and Inuit less likely to have medication needs compared to non-Indigenous people in the past 12 months
The percentage of individuals who reported a need for prescription medications, which includes those who took or were prescribed any prescription medication in the past 12 months, varied among Indigenous groups, ranging from over half of Inuit (56%) to 70% for Métis (Chart 3). Medication needs for both groups were significantly different than the non-Indigenous population (67%), with Métis reporting a higher need and Inuit reporting a lower need. There was, however, considerable variance associated with the estimate for the Inuit population, perhaps reflecting the smaller sample size for this group. Results for Inuit should therefore be used with caution. Despite this, the findings for Inuit align with previous research covering the same time period, which found lower prevalence of chronic conditions, which may reflect the smaller sample size, their younger age distribution or potential barriers to health care services including diagnostic services (Hahmann & Kumar, 2022). Two-thirds of First Nations people (67%) reported medication needs, which was about the same percentage as non-Indigenous people. Within the First Nations population, there was no significant difference between those with and without Status (68% versus 65%) regarding medication needs.

Data table for Chart 3
| Percent | 95% confidence interval | ||
|---|---|---|---|
| lower | upper | ||
Source: Statistics Canada, Survey on Access to Health Care and Pharmaceuticals During the Pandemic, 2021. |
|||
| First Nations people living off reserve | 67.3 | 64.0 | 70.4 |
| Métis | 70.1 Data table for chart 3 Note * | 67.3 | 72.7 |
| Inuit | 55.6 Data table for chart 3 Note * | 44.9 | 65.7 |
| Non-Indigenous people Data table for chart 3 Note † | 66.7 | 65.6 | 67.8 |
Within each identity group, except for Inuit, women were significantly more likely than men to report having medication needs. There was about a 12 percentage point difference in prevalence between men and women within the First Nations and non-Indigenous populations. The gender difference was greater among Métis (17 percentage points) (Table 1). There was also a consistent trend showing increasing medication needs with increasing age within each identity group (Table 1).
| First Nations people living off reserve | Métis | Inuit | Non-Indigenous people | ||||||
|---|---|---|---|---|---|---|---|---|---|
| percent | 95% CI | percent | 95% CI | percent | 95% CI | percent | 95% CI | ||
|
|||||||||
| Gender | |||||||||
| Men Table 1 Note † | 60.6 | (55.7 - 65.3) | 62.9 | (58.8 - 66.9) | 50.4 E use with caution | (35.9 - 64.9) | 60.1 | (58.4 - 61.8) | |
| Women | 73.0 Table 1 Note * | (68.7 - 76.8) | 79.6 Table 1 Note * | (76.2 - 82.6) | 58.9 | (44.3 - 72.1) | 73.2 Table 1 Note * | (71.8 - 74.6) | |
| Age group | |||||||||
| 18 to 24 years | 55.1 Table 1 Note * | (44.6 - 65.1) | 54.9 Table 1 Note * | (44.0 - 65.3) | 39.4 E use with caution Table 1 Note * | (17.3 - 66.8) | 46.2 Table 1 Note * | (40.9 - 51.6) | |
| 25 to 34 years | 56.6 Table 1 Note * | (49.2 - 63.7) | 63.3 Table 1 Note * | (55.8 - 70.1) | 45.8 E use with caution Table 1 Note * | (25.3 - 67.9) | 55.1 Table 1 Note * | (51.8 - 58.3) | |
| 35 to 54 years | 66.6 Table 1 Note * | (61.3 - 71.5) | 68.0 Table 1 Note * | (63.5 - 72.2) | 58.6 | (42.6 - 73.0) | 62.1 Table 1 Note * | (60.1 - 64.0) | |
| 55 to 64 years | 80.2 | (73.9 - 85.2) | 79.3 Table 1 Note * | (74.6 - 83.3) | 77.7 E use with caution | (47.7 - 93.0) | 73.8 Table 1 Note * | (71.6 - 75.9) | |
| 65 years and older Table 1 Note † | 87.1 | (82.1 - 90.8) | 86.2 | (81.7 - 89.7) | 79.2 | (52.1 - 93.0) | 85.9 | (84.5 - 87.2) | |
There was no significant difference in medication needs between First Nations, Métis and non-Indigenous men. By contrast, Métis women (80%) had significantly higher and Inuit women (59%) significantly lower medication needs compared to non-Indigenous women (73%).
Comparing Indigenous groups to the non-Indigenous population across age groups revealed no differences in medication needs among the youngest (18 to 24) and oldest (65 and older) age groups. However, significant differences were evident for other ages groups. In particular, Métis had significantly higher prevalence of medication needs for the three age categories from 25 to 64 compared to non-Indigenous people. Prevalence of medication needs among First Nations people was only significantly higher than non-Indigenous people for the group aged 55 to 64 (see Table 1).
Higher prevalence of medication needs observed among First Nations people living off reserve and Métis to treat several conditions including mental health conditions and chronic pain
Across medication types, a higher percentage of individuals reported taking or requiring medication for cardiovascular issues (heart disease, high cholesterol, and high blood pressure) and mental health conditions than other conditions. This aligns with previous findings that observed higher prevalence of these conditions compared to other conditions during the same time period (Hahmann & Kumar, 2022). The proportion of individuals needing these medications exceeded one in four in each of the respective Indigenous groups. However, the proportion needing medications to treat cardiovascular conditions was significantly lower among Indigenous groups (ranging from 24%E to 30%) compared to non-Indigenous people (33%), which could be related to differences in age distributions. For most other conditions, the reverse was apparent. The need for medications to treat several conditions including mental health conditions and chronic pain was higher among First Nations people and Métis compared to non-Indigenous people. These observations also align with previous findings of higher prevalence of these conditions among First Nations people and Métis. Estimates for Inuit could not be produced for several medications because of small sample sizes. The largest difference between Indigenous and non-Indigenous people was for medications used to treat mental health conditions, where the proportion of individuals needing these medications was almost 10 percentage points higher among Indigenous people (First Nations people: 27%, Métis: 27%, Inuit: 26%E, and non-Indigenous people: 18%). See Table 2 for estimates on each medication type.
| Medications to treat: | First Nations people living off reserve | Métis | Inuit | Non-Indigenous people Table 2 Note † | ||||
|---|---|---|---|---|---|---|---|---|
| percent | 95% CI | percent | 95% CI | percent | 95% CI | percent | 95% CI | |
|
||||||||
| Heart disease, high cholesterol, or high blood pressure | 26.8 Table 2 Note * | (24.2 - 29.6) | 30.3 Table 2 Note * | (27.7 - 33.0) | 24.5 E use with caution | (15.4 - 36.5) | 33.2 | (32.0 - 34.4) |
| Mental health condition | 26.7 Table 2 Note * | (23.4 - 30.2) | 27.4 Table 2 Note * | (24.6 - 30.4) | 25.7 E use with caution | (14.4 - 41.6) | 17.7 | (16.6 - 18.8) |
| Diabetes | 16.1 Table 2 Note * | (13.8 - 18.8) | 13.1 | (11.2 - 15.2) | F too unreliable to be published | F too unreliable to be published | 11.2 | (10.4 - 12.1) |
| Infection | 14.8 | (12.4 - 17.6) | 13.5 | (11.4 - 16.0) | 14.8 E use with caution | (7.4 - 27.4) | 12.5 | (11.6 - 13.4) |
| Chronic pain | 14.8 Table 2 Note * | (12.5 - 17.4) | 15.2 Table 2 Note * | (13.1 - 17.5) | F too unreliable to be published | F too unreliable to be published | 8.9 | (8.2 - 9.6) |
| Gut problems | 13.5 | (11.0 - 16.6) | 13.3 | (11.4 - 15.4) | F too unreliable to be published | F too unreliable to be published | 11.8 | (10.9 - 12.7) |
| Asthma | 12.1 Table 2 Note * | (9.8 - 14.8) | 9.8 | (7.9 - 12.0) | F too unreliable to be published | F too unreliable to be published | 7.7 | (7.0 - 8.5) |
| Contraception or birth control | 8.5 | (6.7 - 10.7) | 6.8 | (5.4 - 8.5) | F too unreliable to be published | F too unreliable to be published | 7.3 | (6.6 - 8.0) |
| Arthritis | 8.2 | (6.6 - 10.2) | 9.2 Table 2 Note * | (7.7 - 11.0) | 3.9 E use with caution Table 2 Note * | (2.0 - 7.5) | 6.7 | (6.1 - 7.3) |
| Oral health problem | 6.0 Table 2 Note * | (4.7 - 7.8) | 5.3 | (4.1 - 6.9) | F too unreliable to be published | F too unreliable to be published | 4.2 | (3.7 - 4.8) |
| COPD | 3.0 E use with caution | (2.1 - 4.3) | 3.0 E use with caution | (2.1 - 4.2) | F too unreliable to be published | F too unreliable to be published | 2.4 | (2.1 - 2.7) |
| Cancer | 1.8 E use with caution | (1.1 - 2.9) | 1.5 E use with caution | (1.0 - 2.3) | F too unreliable to be published | F too unreliable to be published | 1.7 | (1.4 - 2.1) |
| Other condition | 35.3 | (31.9 - 39.0) | 34.6 Table 2 Note * | (31.6 - 37.7) | 27.6 E use with caution | (18.0 - 39.9) | 38.6 | (37.2 - 39.9) |
Among those with medication needs, First Nations people were more likely to have full-year prescription insurance coverage compared to non-Indigenous people, though large disparities exist between Status First Nations people and non-Status First Nations people
Given that those with medication needs face a higher risk of negative health impacts if they are unable to obtain needed prescription medication, it is important to understand prevalence of insurance coverage in this subgroup.
Of those who had medication needs, the proportion lacking full-year coverage was similar between Métis (34%) and non-Indigenous people (33%). First Nations people were least likely to lack full-year coverage, with about one-quarter lacking full-year coverage (24%), significantly less than that reported by non-Indigenous people (33%) (Chart 4). Within the First Nations population, those without Status (44%) were nearly 2.5-times more likely to lack full-year coverage compared to those with Status (18%).

Data table for Chart 4
| Percent | 95% confidence interval | ||
|---|---|---|---|
| lower | upper | ||
Source: Statistics Canada, Survey on Access to Health Care and Pharmaceuticals During the Pandemic, 2021. |
|||
| First Nations people living off reserve | 24.1 Data table for chart 4 Note * | 21.1 | 27.4 |
| Métis | 34.0 | 30.9 | 37.2 |
| Inuit | F too unreliable to be published | F too unreliable to be published | F too unreliable to be published |
| Non-Indigenous people Data table for chart 4 Note † | 32.9 | 31.5 | 34.3 |
A significantly higher proportion of First Nations women with medication needs lacked full-year coverage (27%) compared to First Nations men (21%). There were no significant gender differences in prevalence within Métis and non-Indigenous groups. Age comparisons showed that those aged 65 and older (41%) were significantly more likely to lack full-year coverage compared to those aged 35 to 54 (31%) among Métis. Among First Nations people, there were no significant age differences. Among non-Indigenous people, both younger and older age groups were significantly more likely to lack full-year coverage when compared to those aged 35 to 54 (Table 3).
| First Nations people living off reserve | Métis | Non-Indigenous people | ||||
|---|---|---|---|---|---|---|
| percent | 95% CI | percent | 95% CI | percent | 95% CI | |
|
||||||
| Gender | ||||||
| Men Table 3 Note † | 20.7 | (16.8 - 25.2) | 35.0 | (30.3 - 40.0) | 33.3 | (31.2 - 35.5) |
| Women | 27.1 Table 3 Note * | (22.9 - 31.8) | 32.9 | (29.2 - 36.8) | 32.4 | (30.8 - 34.1) |
| Age group | ||||||
| 18 to 24 years | 32.3 E use with caution | (20.8 - 46.4) | 35.7 E use with caution | (24.2 - 49.1) | 36.2 Table 3 Note * | (29.3 - 43.8) |
| 25 to 34 years | 27.6 E use with caution | (20.1 - 36.6) | 36.9 | (28.2 - 46.5) | 36.3 Table 3 Note * | (32.0 - 40.8) |
| 35 to 54 years Table 3 Note † | 18.6 | (14.5 - 23.7) | 31.2 | (26.6 - 36.3) | 25.8 | (23.5 - 28.2) |
| 55 to 64 years | 23.8 | (17.8 - 31.1) | 28.2 | (23.1 - 33.9) | 32.2 Table 3 Note * | (29.5 - 35.0) |
| 65 years and older | 24.8 | (19.1 - 31.5) | 40.6 Table 3 Note * | (34.8 - 46.6) | 38.1 Table 3 Note * | (36.1 - 40.2) |
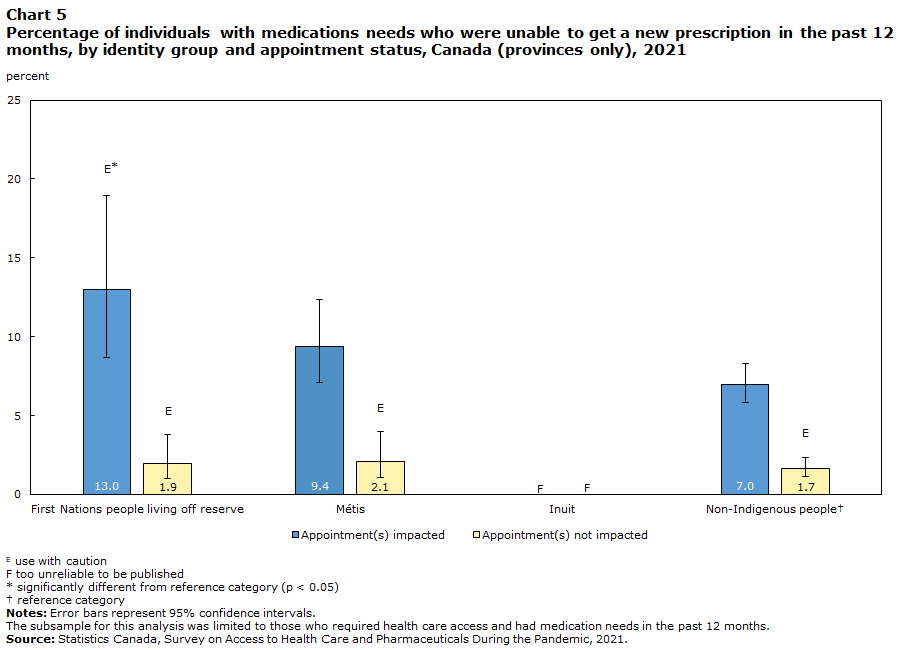
First Nations people had a higher likelihood of experiencing problems obtaining new prescriptions from health care providers during the pandemic compared to non-Indigenous people
The pandemic caused cancellations and postponement of health care appointments, thus potentially impacting health care access for many individuals (Hahmann & Kumar, 2022). This is expected to have created challenges for individuals needing new prescriptions. To assess this, the relationship between appointment scheduling issues and inability to obtain new prescriptions from a health care provider was examined.
Across identity groups, those who experienced appointment scheduling issues for health care services in the past year were approximately four to seven times more likely to be unable to get a new prescription compared to their counterparts who did not experience such issues. Inability to obtain a new prescription among those with appointment issues was twice as high among First Nations people (13%E) compared to non-Indigenous people (7%). The difference in prevalence between Métis (9%) and non-Indigenous people was not significant. Prevalence of this outcome could not be reported for Inuit because of small sample sizes.
Data table for Chart 5
| Appointment(s) impacted | Appointment(s) not impacted | |||||
|---|---|---|---|---|---|---|
| Percent | 95% confidence interval | Percent | 95% confidence interval | |||
| lower | upper | lower | upper | |||
The subsample for this analysis was limited to those who required health care access and had medication needs in the past 12 months. Source: Statistics Canada, Survey on Access to Health Care and Pharmaceuticals During the Pandemic, 2021. |
||||||
| First Nations people living off reserve | 13.0 E use with caution Data table for chart 5 Note * | 8.7 | 18.9 | 1.9 E use with caution | 1.0 | 3.8 |
| Métis | 9.4 | 7.1 | 12.4 | 2.1 E use with caution | 1.1 | 4.0 |
| Inuit | F too unreliable to be published | F too unreliable to be published | F too unreliable to be published | F too unreliable to be published | F too unreliable to be published | F too unreliable to be published |
| Non-Indigenous people Data table for chart 5 Note † | 7.0 | 5.8 | 8.3 | 1.7 E use with caution | 1.1 | 2.4 |
Out-of-pocket spending on prescription medication among those with medication needs is lowest among Status First Nations people and Inuit
In addition to difficulties accessing health care and getting new prescriptions, patient-borne drug expenses are an important barrier to accessing prescription medications (Tang et al., 2014). Out-of-pocket drug expenditures have also been shown to be associated with decision-making about prescription medication use. In fact, Law et al. (2018) found that those with higher out-of-pocket drug spending were less likely to adhere to their medications because of cost.
First Nations people and Inuit were significantly less likely to face out-of-pocket prescription medication expenses compared to non-Indigenous people. Almost two-thirds of First Nations people (62%) and just over three quarters of Inuit (76%) reported having no out-of-pocket expenses compared to just under one third of non-Indigenous people (30%). By contrast, out-of-pocket medication expenses amongst Métis was not significantly different from non-Indigenous people across all spending categories (see Chart 6 for further details).
Within the First Nations population, those without Status were significantly more likely to face out-of-pocket medication expenses compared to those with Status. For instance, non-Status First Nations people were nearly twice as likely to spend under $250 on prescriptions (39%) compared to those with Status (21%) and had nearly four times the prevalence of spending over $250 (29% versus 8%) (Chart 7).
Comparing genders within each identity group revealed two instances where there were significant differences. Among Métis, men were significantly more likely to report having no out-of-pocket medication expenses (36%) compared to women (29%). Among the non-Indigenous population, men were significantly more likely to report expenses of $250 or more (26%) compared to women (23%).

Data table for Chart 6
| None | Under 250 dollars | 250 dollars or more | |||||||
|---|---|---|---|---|---|---|---|---|---|
| Percent | 95% confidence interval | Percent | 95% confidence interval | Percent | 95% confidence interval | ||||
| lower | upper | lower | upper | lower | upper | ||||
Source: Statistics Canada, Survey on Access to Health Care and Pharmaceuticals During the Pandemic, 2021. |
|||||||||
| First Nations people living off reserve | 62.0 Data table for chart 6 Note * | 58.3 | 65.6 | 25.3 Data table for chart 6 Note * | 22.2 | 28.8 | 12.6 Data table for chart 6 Note * | 10.4 | 15.2 |
| Métis | 32.5 | 29.5 | 35.6 | 41.8 | 38.5 | 45.1 | 25.8 | 23.3 | 28.4 |
| Inuit | 75.9 Data table for chart 6 Note * | 63.1 | 85.2 | x suppressed to meet the confidentiality requirements of the Statistics Act | x suppressed to meet the confidentiality requirements of the Statistics Act | x suppressed to meet the confidentiality requirements of the Statistics Act | F too unreliable to be published | F too unreliable to be published | F too unreliable to be published |
| Non-Indigenous people Data table for chart 6 Note † | 30.0 | 28.7 | 31.4 | 45.5 | 44.0 | 46.9 | 24.5 | 23.4 | 25.6 |

Data table for Chart 7
| None | Under 250 dollars | 250 dollars or more | |||||||
|---|---|---|---|---|---|---|---|---|---|
| Percent | 95% confidence interval | Percent | 95% confidence interval | Percent | 95% confidence interval | ||||
| lower | upper | lower | upper | lower | upper | ||||
Source: Statistics Canada, Survey on Access to Health Care and Pharmaceuticals During the Pandemic, 2021. |
|||||||||
| Status First Nations people Data table for chart 7 Note † | 71.1 | 67.3 | 74.6 | 21.3 | 18.1 | 24.8 | 7.6 | 5.9 | 9.8 |
| Non-Status First Nations people | 31.4 Data table for chart 7 Note * | 24.6 | 39.1 | 39.1 Data table for chart 7 Note * | 32.0 | 46.8 | 29.5 Data table for chart 7 Note * | 23.0 | 36.9 |
One in five Métis and First Nations people who lack prescription insurance coverage do not adhere to their prescriptions because of cost
Cost-related medication non-adherence (hereafter referred to as non-adherence), such as rationing or delaying filling prescriptions due to cost, is considered a clinical problem that poses negative health consequences for patients and economic challenges for health care systems (Kennedy & Morgan, 2009).
Overall prevalence of non-adherence among those with medication needs, regardless of coverage level, was 11% for First Nations people, 12% for Métis, 23%E for Inuit, and 9% for non-Indigenous people. In all populations where comparisons were possible, those with less than full-year coverage were two to three times more likely to not adhere to medications than their counterparts who had full-year coverage. Even among those with full-year coverage, some disparities between Indigenous and non-Indigenous people emerged. In particular, Métis (8%) were more likely to not adhere to medications compared to non-Indigenous people (5%). Significant differences were not evident between Indigenous and non-Indigenous groups among those with less than full-year coverage, though differences did trend toward significance (Chart 8).

Data table for Chart 8
| Full-year coverage | Less than full-year coverage | |||||
|---|---|---|---|---|---|---|
| Percent | 95% confidence interval | Percent | 95% confidence interval | |||
| lower | upper | lower | upper | |||
Source: Statistics Canada, Survey on Access to Health Care and Pharmaceuticals During the Pandemic, 2021. |
||||||
| First Nations people living off reserve | 7.6 E use with caution | 5.6 | 10.3 | 22.2 | 16.5 | 29.1 |
| Métis | 8.4 Data table for chart 8 Note * | 6.4 | 10.8 | 20.4 | 16.3 | 25.1 |
| Inuit | F too unreliable to be published | F too unreliable to be published | F too unreliable to be published | F too unreliable to be published | F too unreliable to be published | F too unreliable to be published |
| Non-Indigenous people Data table for chart 8 Note † | 5.3 | 4.5 | 6.1 | 16.2 | 14.3 | 18.3 |
First Nations people living off reserve who lacked full-year prescription insurance coverage had three times higher odds of not adhering to their prescriptions because of cost compared to those with full-year coverage after adjusting for other factors
Medication non-adherence has previously been shown to be associated with several factors, such as income, drug coverage, number of chronic conditions, out-of-pocket drug expenses, etc., in the general population (Law et al., 2018). However, these associations have not been investigated among Indigenous people. To address this, medication non-adherence was examined before and after accounting for some of the aforementioned factors using bivariate and multivariate analysis for First Nations people and Métis separately.
Of the characteristics included in the bivariate analysis for the First Nations population living off reserve, prescription insurance coverage, household income, Registered Indian status, number of chronic conditions, number of prescriptions needed, and out-of-pocket medication spending were all significantly associated with non-adherence, while gender, age, province or region, and education were not (see Appendix A.1).
While the bivariate analyses enabled the examination of correlations between the outcome (non-adherence) and each independent variable, it is important to examine associations when controlling for all the other variables. To this end, multivariate analysis was undertaken, the results of which are presented in Table 4. However, the primary focus was on the association between non-adherence and prescription insurance coverage after adjusting for other potential confounders.
First, univariate regression analysis was conducted (Model 1 in Table 4) to determine the relationship between prescription insurance coverage and the outcome (medication non-adherence) without controlling for other factors. Results from the univariate logistic regression showed that those who had less than full-year coverage had almost three and a half times the odds (OR=3.47) of non-adherence compared to those who had full-year coverage.
After controlling for the selected characteristics in the multivariate model (Model 2), the odds of non-adherence among those with less than full-year coverage decreased to just under three (OR=2.98). Nonetheless, a significant association between prescription insurance coverage and non-adherence remained.
Of the selected characteristics that were used as control variables, several of them were significantly associated with non-adherence while adjusting for the remainder of the variables. These included age, household income, number of prescriptions required, and out-of-pocket medication spending. For instance, compared to those aged 35 to 54, those aged 65 and over (OR=0.21) had 80% lower odds of non-adherence. All other age groups were not significantly different than the 35-to-54-year age group.
Concerning income, individuals in households in the lowest 20th percentile had more than two times the odds (OR=2.30) of non-adherence compared to those above the 20th percentile. The odds of non-adherence were also significantly higher for those taking two prescriptions (OR=2.67) compared to those who were required to take only one prescription. However, this trend did not hold for the group requiring three or more prescriptions. This group was not significantly different than those taking one prescription. There was also a clear trend between medication non-adherence and out-of-pocket expenses, with odds of non-adherence increasing as expenses increased. More specifically, those spending under $250 in out-of-pocket expenses had nearly four times the odds (OR=3.88) and those spending $250 or more had over four times of the odds (OR=4.34) of non-adherence compared to those who had no out-of-pocket medication expenses. Females also had nearly half the odds of non-adherence (OR=0.58) compared to males (p=0.09).
It is also noteworthy that, despite observing a notable difference in non-adherence between Status and non-Status First Nations people in the bivariate analysis (9% versus 19%E; see Appendix A.1), no association between Status and non-adherence was observed when all other variables were controlled for.
Access to a health care provider was also included as a predictor in preliminary models that were not used in the final analysis. This covariate was not significantly associated with medication non-adherence after adjusting for other factors (OR=1.81; p=0.13).
| Characteristics | Model 1 (univariate) | Model 2 (multivariate) | ||||
|---|---|---|---|---|---|---|
| odds ratio | lower 95% CI |
upper 95% CI |
odds ratio | lower 95% CI |
upper 95% CI |
|
|
||||||
| Intercept | 0.08 Table 4 Note * | 0.06 | 0.12 | 0.02 | 0.01 | 0.09 |
| Prescription insurance coverage duration | ||||||
| Full-year coverage Table 4 Note † | 1.00 | 1.00 | 1.00 | 1.00 | 1.00 | 1.00 |
| Less than full-year coverage | 3.47 Table 4 Note * | 2.11 | 5.71 | 2.98 Table 4 Note * | 1.47 | 6.04 |
| Registered Indian Status | ||||||
| Status Table 4 Note † | ... not applicable | ... not applicable | ... not applicable | 1.00 | 1.00 | 1.00 |
| Non-Status | ... not applicable | ... not applicable | ... not applicable | 0.75 | 0.39 | 1.45 |
| Gender | ||||||
| Male Table 4 Note † | ... not applicable | ... not applicable | ... not applicable | 1.00 | 1.00 | 1.00 |
| Female | ... not applicable | ... not applicable | ... not applicable | 0.58 | 0.31 | 1.10 |
| Age group, years | ||||||
| 18 to 24 years | ... not applicable | ... not applicable | ... not applicable | 1.02 | 0.32 | 3.27 |
| 25 to 34 years | ... not applicable | ... not applicable | ... not applicable | 1.62 | 0.75 | 3.52 |
| 35 to 54 years Table 4 Note † | ... not applicable | ... not applicable | ... not applicable | 1.00 | 1.00 | 1.00 |
| 55 to 64 years | ... not applicable | ... not applicable | ... not applicable | 0.50 | 0.21 | 1.21 |
| 65 years and older | ... not applicable | ... not applicable | ... not applicable | 0.21 Table 4 Note * | 0.07 | 0.57 |
| Province/Region | ||||||
| Atlantic provinces | ... not applicable | ... not applicable | ... not applicable | 1.05 | 0.39 | 2.82 |
| Quebec Table 4 Note † | ... not applicable | ... not applicable | ... not applicable | 1.00 | 1.00 | 1.00 |
| Ontario | ... not applicable | ... not applicable | ... not applicable | 0.97 | 0.34 | 2.77 |
| Prairies | ... not applicable | ... not applicable | ... not applicable | 1.03 | 0.36 | 2.91 |
| British Columbia | ... not applicable | ... not applicable | ... not applicable | 1.35 | 0.46 | 3.93 |
| Total Household Income | ||||||
| Income below 20th percentile | ... not applicable | ... not applicable | ... not applicable | 2.30 Table 4 Note * | 1.28 | 4.16 |
| Income below 20th percentileTable 4 Note † | ... not applicable | ... not applicable | ... not applicable | 1.00 | 1.00 | 1.00 |
| Education | ||||||
| Less than High School Table 4 Note † | ... not applicable | ... not applicable | ... not applicable | 1.00 | 1.00 | 1.00 |
| High school or equivalent | ... not applicable | ... not applicable | ... not applicable | 0.98 | 0.41 | 2.31 |
| College, Trades, CEGEP, Certificates and Diplomas below the Bachelors level | ... not applicable | ... not applicable | ... not applicable | 1.02 | 0.45 | 2.33 |
| Bachelor's degree or higher | ... not applicable | ... not applicable | ... not applicable | 0.75 | 0.25 | 2.21 |
| Chronic Conditions, number | ||||||
| 0 Table 4 Note † | ... not applicable | ... not applicable | ... not applicable | 1.00 | 1.00 | 1.00 |
| 1 | ... not applicable | ... not applicable | ... not applicable | 1.25 | 0.54 | 2.93 |
| 2 or more | ... not applicable | ... not applicable | ... not applicable | 1.58 | 0.55 | 4.55 |
| Prescription Medications, number | ||||||
| 1 Table 4 Note † | ... not applicable | ... not applicable | ... not applicable | 1.00 | 1.00 | 1.00 |
| 2 | ... not applicable | ... not applicable | ... not applicable | 2.67 Table 4 Note * | 1.07 | 6.69 |
| 3 or more | ... not applicable | ... not applicable | ... not applicable | 2.04 | 0.77 | 5.36 |
| Out of Pocket Prescription Medication Spending, $ | ||||||
| 0 Table 4 Note † | ... not applicable | ... not applicable | ... not applicable | 1.00 | 1.00 | 1.00 |
| Less than $250 | ... not applicable | ... not applicable | ... not applicable | 3.88 Table 4 Note * | 1.81 | 8.32 |
| $250 or more | ... not applicable | ... not applicable | ... not applicable | 4.34 Table 4 Note * | 1.73 | 10.87 |
Métis who lacked full-year prescription insurance coverage had more than twice the odds of not adhering to their prescriptions because of cost compared to those with full-year coverage (after adjusting for other factors)
Of the selected characteristics included in the bivariate analysis for the Métis population, prescription insurance coverage, gender, age, household income, education, number of chronic conditions, number of prescriptions needed, and out-of-pocket medication spending were all significantly associated with medication non-adherence, while province or region was not significantly associated though the Prairies and British Columbia did trend toward significance when compared to Quebec (reference category).
The univariate regression analysis for Métis (Model 1 in Table 5), which assessed the relationship between prescription insurance coverage and non-adherence without controlling for other variables, showed that those with less than full-year coverage had almost three times higher odds (OR=2.80) of medication non-adherence because of cost compared to those with full-year coverage.
After controlling for the selected characteristics in the multivariate model (Model 2), the odds of non-adherence decreased to just over two (OR=2.14). Still, a significant association between prescription insurance coverage and non-adherence remained. The change in odds for the prescription insurance coverage groups when comparing the univariate and multivariate results reveal the potentially confounding effect of other characteristics on the association between prescription insurance coverage and medication non-adherence.
Of the selected characteristics that were used as control variables, age, income, education, number of prescriptions taken, and out-of-pocket medication spending were significantly associated with non-adherence while adjusting for the remainder of the variables. These were the same characteristics that were significant in the model for First Nations people, except that education was also significant among Métis.
Métis aged 65 and older (OR=0.28) had nearly 70% lower odds of non-adherence compared to their counterparts aged 35 to 54. All other age groups were not significantly different than the 35-to-54 age group.
Métis from households with incomes in the lowest 20th percentile had over twice the odds (OR=2.40) of non-adherence compared to those above the 20th percentile. Regarding education level, Métis in the highest educated group, with a Bachelor’s degree or higher (OR=2.70), had over two and a half times the odds of non-adherence compared to those with less than a high school education. This estimate was associated with a high variance and should be interpreted with caution. The reasons for the association between education and non-adherence among Métis are unclear and warrant further investigation.
Regarding the number of prescriptions taken, those taking two prescriptions (OR=2.01) had twice the odds of non-adherence compared to those taking one prescription. However, this difference did not hold for those taking three or more prescriptions (OR=1.64). This group was not significantly different from those who required one prescription, while adjusting for the remaining control variables.
As was found for the First Nations population, there was a clear trend between non-adherence and out-of-pocket medication spending, with odds of non-adherence increasing as expenses increased. Those spending $250 or more had six times the odds (OR=5.99) of non-adherence compared to those who had no out-of-pocket medication expenses (see Table 5). Those with expenses under $250 (OR=2.24) had over two times the odds of medication non-adherence compared to those without out-of-pocket expenses, which was not technically significant but trended toward significance (p = 0.05).
Access to a health care provider was also included as a predictor in preliminary models that were not used in the final analysis. This covariate was not significantly associated with medication non-adherence after adjusting for other factors (OR=1.26; p=0.57).
| Characteristics | Model 1 (univariate) | Model 2 (multivariate) | ||||
|---|---|---|---|---|---|---|
| odds Ratio | lower 95% CI | upper 95% CI | odds Ratio | lower 95% CI | upper 95% CI | |
|
||||||
| Intercept | 0.09 Table 5 Note * | 0.07 | 0.12 | 0.01 | 0.00 | 0.03 |
| Prescription insurance coverage duration | ||||||
| Full-year coverage Table 5 Note † | 1.00 | 1.00 | 1.00 | 1.00 | 1.00 | 1.00 |
| Less than full-year coverage | 2.80 Table 5 Note * | 1.89 | 4.15 | 2.14 Table 5 Note * | 1.27 | 3.61 |
| Gender | ||||||
| Male Table 5 Note † | ... not applicable | ... not applicable | ... not applicable | 1.00 | 1.00 | 1.00 |
| Female | ... not applicable | ... not applicable | ... not applicable | 1.15 | 0.65 | 2.06 |
| Age group, years | ||||||
| 18 to 24 years | ... not applicable | ... not applicable | ... not applicable | 1.55 | 0.43 | 5.66 |
| 25 to 34 years | ... not applicable | ... not applicable | ... not applicable | 1.42 | 0.69 | 2.94 |
| 35 to 54 years Table 5 Note † | ... not applicable | ... not applicable | ... not applicable | 1.00 | 1.00 | 1.00 |
| 55 to 64 years | ... not applicable | ... not applicable | ... not applicable | 0.88 | 0.48 | 1.61 |
| 65 years and older | ... not applicable | ... not applicable | ... not applicable | 0.28 Table 5 Note * | 0.14 | 0.58 |
| Province/Region | ||||||
| Atlantic provinces | ... not applicable | ... not applicable | ... not applicable | 1.28 | 0.59 | 2.75 |
| Quebec Table 5 Note † | ... not applicable | ... not applicable | ... not applicable | 1.00 | 1.00 | 1.00 |
| Ontario | ... not applicable | ... not applicable | ... not applicable | 1.69 | 0.58 | 4.92 |
| Prairies | ... not applicable | ... not applicable | ... not applicable | 1.30 | 0.63 | 2.67 |
| British Columbia | ... not applicable | ... not applicable | ... not applicable | 2.03 | 0.80 | 5.12 |
| Total Household Income | ||||||
| Below 20th percentile | ... not applicable | ... not applicable | ... not applicable | 2.40 Table 5 Note * | 1.38 | 4.17 |
| Above 20th percentileTable 5 Note † | ... not applicable | ... not applicable | ... not applicable | 1.00 | 1.00 | 1.00 |
| Education | ||||||
| Less than High School Table 5 Note † | ... not applicable | ... not applicable | ... not applicable | 1.00 | 1.00 | 1.00 |
| High school or equivalent | ... not applicable | ... not applicable | ... not applicable | 1.22 | 0.50 | 2.97 |
| College, Trades, CEGEP, Certificates and Diplomas below the Bachelor level | ... not applicable | ... not applicable | ... not applicable | 2.14 | 0.97 | 4.71 |
| Bachelor's degree or higher | ... not applicable | ... not applicable | ... not applicable | 2.70 Table 5 Note * | 1.02 | 7.14 |
| Chronic Conditions, number | ||||||
| 0 Table 5 Note † | ... not applicable | ... not applicable | ... not applicable | 1.00 | 1.00 | 1.00 |
| 1 | ... not applicable | ... not applicable | ... not applicable | 1.15 | 0.53 | 2.48 |
| 2 or more | ... not applicable | ... not applicable | ... not applicable | 1.23 | 0.55 | 2.72 |
| Prescription Medications, number | ||||||
| 1 Table 5 Note † | ... not applicable | ... not applicable | ... not applicable | 1.00 | 1.00 | 1.00 |
| 2 | ... not applicable | ... not applicable | ... not applicable | 2.01 Table 5 Note * | 1.11 | 3.61 |
| 3 or more | ... not applicable | ... not applicable | ... not applicable | 1.64 | 0.75 | 3.61 |
| Out of Pocket Prescription Medication Spending, $ | ||||||
| 0 Table 5 Note † | ... not applicable | ... not applicable | ... not applicable | 1.00 | 1.00 | 1.00 |
| Less than $250 | ... not applicable | ... not applicable | ... not applicable | 2.24 | 1.00 | 5.02 |
| $250 or more | ... not applicable | ... not applicable | ... not applicable | 5.99 Table 5 Note * | 2.57 | 13.94 |
Discussion
The COVID-19 pandemic had severe negative health, social and economic impacts across Canadian society some of which were disproportionately higher among marginalized populations, including Indigenous people, because of pre-pandemic health and socio-economic disparities (Kopp et al., 2024; Mashford-Pringle et al., 2021; Public Health Agency of Canada, 2020). The pandemic added to these challenges through the reduction and postponement of health services, diminished access to health care professionals (Zeitouny et al., 2023) and impacts on employer-sponsored health insurance related to job loss (Nguyen et al., 2022), among others.
A previous study examined prescription insurance access during the pandemic in the general Canadian population, and among racialized persons and immigrants, but not among Indigenous people (Cortes & Smith, 2022). The current study fills this knowledge gap by examining the prevalence of prescription insurance and medication use during the pandemic among Indigenous people. Findings from the analysis showed that there were significant differences between some Indigenous populations and the non-Indigenous population with respect to prescription insurance coverage, types of medications used, out-of-pocket spending on medications, and non-adherence to prescription medication due to cost. The study could not examine outcomes for Two-Spirit and gender diverse First Nations people, Métis and Inuit due to small sample sizes. These individuals faced challenges concerning access to health care during the pandemic, including challenges related to availability and accessibility of culturally safe healthcare, wait times, booking processes and public transit, discrimination and racism (Jones et al., 2024).
The percentage of individuals who reported not having prescription insurance in the past year ranged from 14% among First Nations people living off reserve to 24%E among Inuit. One in five Métis and non-Indigenous people also reported not having coverage. These findings largely align with those of previous studies that preceded the pandemic (Law et al., 2018), as well as those completed during the pandemic (Cortes & Smith, 2022), where prevalence of not having coverage for the general population was 19% and 21%, respectively. Prevalence of insurance coverage in the current study differs somewhat from that reported by Yang and Gupta (2024), though these differences likely stem from differences in how coverage was measured (the current study measured duration of coverage in the past 12 months) and differences in the study population (e.g., 18 years and older in the current study versus 12 years and older in their study). Gender differences in prescription insurance coverage were only seen among Métis where men were more likely to report not having prescription insurance.
Status First Nations people were nearly half as likely to report having no prescription insurance coverage (12%) as non-Status First Nations people (23%). The finding of higher prevalence of full-year coverage among Status First Nations people could potentially be the result of their eligibility for coverage under the Non-Insured Health Benefits (NIHB) program, which provides prescription insurance to First Nations people who are registered under the Indian Act (i.e., Registered or Treaty Indians) and Inuit who are recognized by an Inuit Land Claim organization (Indigenous Services Canada, 2023). The proportion of Status First Nations people reporting having no coverage was somewhat unexpected given that Status First Nations people are eligible for coverage under NIHB; however, the SAHCPDP did not allow for a direct assessment of this because respondents were not asked about the insurance programs they were enrolled in. Also, over one-quarter (28%) of Inuit in the study population reported not being affiliated with a land claim, and additionally Inuit in the territories were not included in the survey. These may partly explain the somewhat higher prevalence of not having coverage among Inuit. Also, the sample size of Inuit in the survey was small, so results must be interpreted with caution.
The impact of the pandemic on prescription insurance could not be fully assessed because it was only asked of individuals in the sample who had coverage for part of the previous 12 months and those who did not have coverage in the past 12 months but had coverage more than 12 months ago (see Methods for further details). Of those asked, about one in six First Nations people and one in five Métis reported that the pandemic impacted their coverage, which was not significantly different than that reported by non-Indigenous people. Indigenous groups experienced increased unemployment during the early phase of the pandemic and were overrepresented in occupations that saw larger employmentconce declines, such as the trades, transportation and equipment operators as well as in the sales and service sector (Bleakney et al., 2020), which may suggest higher prevalence of their coverage being impacted by the pandemic. However, there are several potential reasons that may explain why prevalence was similar among groups. For instance, Status First Nations people and Inuit affiliated with a recognized land claim would have continued to receive coverage under NIHB. Furthermore, many workers were able to pivot to online work (Statistics Canada, 2020) and thus would not have experienced interruption in employment or coverage. Those employed in essential services also continued working and thus would have maintained their coverage.
Differences emerged when comparing the types of medications needed between Indigenous and non-Indigenous people. A smaller proportion of Indigenous people needed medications to treat cardiovascular diseases compared to non-Indigenous people, which may relate to the younger age distribution of Indigenous groups. However, a greater proportion of Indigenous people needed medications to treat several conditions including mental health conditions and chronic pain. The higher prevalence for these medication types aligns with past research which indicated higher rates of these chronic conditions among Indigenous people (Hahmann & Kumar, 2022). The largest difference between Indigenous and non-Indigenous people was for medications used to treat mental health conditions. There is a substantive literature which highlights the impact of colonial policies, including residential school attendance and resulting intergenerational trauma; loss of land, culture, community structures and traditions; and continuing gaps in health care services, education and labour force opportunities as key factors underpinning poorer mental health and socio-economic conditions among Indigenous groups (e.g., Loppie & Wien, 2022; Kim, 2019). This study did not investigate whether differences in prevalence of medication use between the Indigenous and non-Indigenous groups during the pandemic was consistent with or different than pre-pandemic levels.
The pandemic had a significant impact on health care access because physician services and in-person physician availability were greatly reduced (Glazier et al., 2021; Zeitouny et al., 2023). To address health needs, a rapid transition to virtual care was implemented (Glazier et al., 2021; Mashford-Pringle et al., 2021). Nonetheless, the pandemic may have impacted patients’ access to prescriptions. Findings from the current study showed that appointment scheduling issues were associated with problems obtaining a new prescription and this was particularly prominent among First Nations people who were twice as likely to experience this issue compared to non-Indigenous people. This finding warrants further investigation, though the disparity may relate to barriers to access, such as higher representation of Indigenous people in rural areas in the survey target population, provider bias (Moscou et al., 2023), and the digital divide (Health Canada, 2021), among others.
Concerning medication non-adherence related to cost, past research found that prevalence among Canadians ranged from 5% to 10% of the population (Holbrook et al., 2021). In the current study, prevalence among all Indigenous groups was somewhat higher, exceeding 10%. Non-adherence was highly correlated with prescription insurance across groups, with higher prevalence among those lacking full-year coverage, which remained after adjusting for other factors. First Nations people and Métis with less than full-year coverage had approximately three- and two-fold higher odds, respectively, of non-adherence than those who had full-year coverage after adjusting for out-of-pocket spending, number of prescription medications used, income, education, age, gender, etc. Similar observations were evident in other studies. For example, Law et al., (2018) observed that Canadians without prescription insurance had three times higher odds of non-adherence than those who had coverage through an employer plan after adjusting for household income, number of chronic conditions, health status, province, and education, among other factors.
A notable finding in the current study was that non-Status First Nations people had a significantly higher prevalence of non-adherence compared to Status First Nations people (see Appendix A.1), but this difference was no longer evident after controlling for other factors such as income, education, number of chronic conditions, among others. This finding demonstrates that the disparity between Status First Nations people and non-Status First Nations people can be explained by other factors. Those with Status also had higher prevalence of full-year coverage. This could be related to their eligibility for coverage under NIHB. Therefore, the disparity in prescription insurance coverage between the two groups may explain, at least in part, differences in prevalence of medication non-adherence.
Among First Nations people and Métis, there were higher odds of non-adherence among those with the following characteristics: income below the 20th percentile, taking two medications, and having out-of-pocket medication expenses. Education was not found to be a predictor of medication non-adherence among First Nations people in the current study; however, among Métis, non-adherence increased with increasing levels of education, with those holding a bachelor’s degree having nearly three-times higher adjusted odds of non-adherence than those with less than a high school education. This estimate was associated with a high variance and should be interpreted with caution. The underlying factors behind the association between education and medication non-adherence among Métis are unclear and warrant further investigation. Also, the finding that the odds of medication non-adherence was not significantly different between those taking one medication and those taking three or more medications was unexpected, particularly given that those taking two medications were significantly more likely to non-adhere than those taking one medication. This finding warrants further investigation. However, it is noteworthy that Law et al. (2018) found no significant difference in medication non-adherence between those taking one or two medications compared to those taking three or more after adjusting for other factors. While the grouping categories compared differed between the studies, the results somewhat aligned in that there was no clear trend to suggest that medication non-adherence increases as the number of needed prescriptions increases.
Overall, the findings from the current study align in part with past research concerning factors associated with medication non-adherence, such as prescription insurance, age, income, and out-of-pocket expenses (Kemp et al., 2010; Law et al., 2018). Prior research comparing various prescription insurance regimes in the United States and across Canadian provinces found that non-adherence was lowest in Quebec, where prescription insurance is compulsory, after controlling for other factors (Kennedy & Morgan, 2009). Results from the current study provide further evidence that prescription insurance may be a protective factor in mitigating non-adherence behaviour.
Finally, previous research has highlighted the role of the physician as a mediator in patient decision-making regarding cost-related medication non-adherence (Briesacher et al., 2007; Piette et al., 2006). For instance, Kemp et al. (2010) found that a lack of patient involvement in treatment decisions was associated with increased non-adherence in Canada and abroad. Further research could therefore explore the quality of physician-patient relationships. This is particularly relevant in the context of Indigenous health, given the negative experiences of Indigenous people in the health care system, which has led to mistrust of health authorities and institutions (Mashford-Pringle, 2021). There have been calls for improved health care for Indigenous people, underscoring the need for culturally safe practice by culturally competent providers (Mashford-Pringle et al., 2021). Other cultural factors may also be relevant to explore, such as views and preferences with respect to traditional medicines and healing practices versus those practiced in accordance with the bio-medical model (Kyoon Achan et al., 2021). Exploring these areas could provide further insight into additional factors potentially related to medication non-adherence among Indigenous groups.
Data and methodology
Data source
The Survey on Access to Health Care and Pharmaceuticals During the Pandemic (SAHCPDP) was designed to better understand how health care service disruptions affected Canadians during the COVID-19 pandemic. The target population was people aged 18 years or older living in private dwellings in the 10 provinces outside of reserves and other Indigenous settlements. Data were collected March 8 to May 15, 2021, either through an electronic questionnaire or through computer-assisted telephone interviewing (CATI). The reference period for the survey was the past 12 months. The main sample consisted of individuals selected from 40,000 households selected from a list frame of dwellings. An oversample of 15,000 Indigenous people was allocated with the goal of producing equal quality estimates across the provinces for the Indigenous subpopulation. The sampling frame for the latter was individuals who identified as Indigenous in the 2016 Census of Population. The overall response rate was 46.2%. The final sample included 25,268 participants aged 18 years and older, of which 4,907 were Indigenous: First Nations people (2,159), Métis (2,504) and Inuit (198).
The SAHCPDP was administered to those in private dwellings, thus, it excluded those who were in collective dwellings such as hospitals, jails, shelters and group homes. Because the frame used for oversampling Indigenous people was people who identified as Indigenous in the 2016 Census, those who were not enumerated in that cycle were not included in the in-scope population.
Concepts and measurement
Status First Nations people and non-Status First Nations people: Status First Nations people refers to First Nations people who responded “Yes, Status Indian (Registered or Treaty)” in response to the following question: “Are you a Status Indian (Registered or Treaty Indian as defined by the Indian Act of Canada)?”. Non-Status First Nations people refers to First Nations people who responded “No” to this question.
Prevalence of prescription insurance: The SAHCPDP asked respondents the following question to determine the extent to which the population had insurance to cover prescription costs:
- In the past 12 months, did you have insurance to cover at least some of the cost of prescription medications?
- Yes, had insurance for all of the last 12 months
- Yes, had insurance for part of the last 12 months
- No
Throughout the paper, the three prescription insurance coverage durations are referred to in short, corresponding to the response options above, as follows: 1) full-year coverage, 2) part-year coverage, and 3) no coverage. In latter sections of the paper, categories 2 and 3 are combined and are referred to as those who lack full-year coverage.
Measuring the impact of the pandemic on coverage: the SAHCPDP asked respondents whether they had prescription insurance coverage in the past year, and for those who said no, they were asked if they had coverage prior to 12 months ago. Based on the survey design and skip patterns, four groups can be identified with respect to prescription insurance coverage:
- Those who had prescription insurance coverage for all of the past 12 months
- Those who had prescription insurance coverage for part of the past 12 months
- Those who did not have coverage in the past 12 months but had coverage more than 12 months ago
- Those who did not have coverage in both periods, 12 months ago and prior.
The survey did not ask all respondents if their coverage had been impacted by the pandemic. This question was only asked to groups 2 and 3 listed above. Therefore, caution must be exercised when interpreting estimates on the impact of the pandemic on coverage, particularly given the possibility that some individuals who were never asked the question may have been impacted. For instance, those with full-year coverage (group 1) may have been impacted but may have quickly obtained other coverage (e.g., through another employer or via a self-funded plan) and therefore was able to maintain full-year coverage.
Medication needs: this term is used throughout the paper as a shorthand to refer to those who reported taking or being prescribed any prescription medication in the past 12 months.
Those who reported that they had taken or were prescribed any prescription medications in the previous 12 months were subsequently asked “what health conditions were these prescriptions meant to treat?” Respondents could choose one or more of the following, which were used to determine the percentage of individuals requiring specific medication types: (1) Heart disease, high cholesterol, or high blood pressure, (2) asthma, (3) COPD (chronic obstructive pulmonary disease), (4) mental health condition (e.g., depression, anxiety), (5) diabetes, (6) gut problems (e.g., peptic ulcer, heartburn, bowel disease), (7) arthritis, (8) chronic pain, (9) an infection (e.g., bacterial, fungal, or viral), (10) a type of cancer, (11) oral health problem (e.g., medication for pain or infection), (12) contraception or birth control, and (13) other condition.
Proportion unable to obtain a new prescription from a health care provider by appointment status:
The SAHCPDP included a question on whether respondents experienced problems obtaining prescriptions during the pandemic. A separate part of the questionnaire asked respondents if they experienced appointment scheduling issues during the pandemic for a range of health care services (e.g., to see a family doctor, specialist, diagnostic testing, etc.). This analysis investigated whether there was a correlation between those who experienced problems obtaining a prescription from a health care provider and those who experienced an appointment scheduling issue for any health care service. Hence, it is important to note that the survey did not specifically ask respondents if they experienced a problem obtaining a new prescription from a health care provider because of appointment scheduling issues. The analysis, therefore, assesses whether there was a relationship between these two variables. For further clarity, the two questions that were used in the crosstabulation to determine if there was a relationship are provided below:
- Did you experience any of the following problems with the scheduling of your appointments?
- Examples of problems included appointments being canceled, delayed, rescheduled or not yet scheduled because of COVID-19 or other reasons.
- In the past 12 months, were you unable to fill a prescription when you needed it because of any of the following problems?
- The outcome of interest was limited to the response option regarding being unable to get a new prescription from a health care provider.
Cost-related medication non-adherence: The SAHCPDP asked respondents the following question to determine the extent to which they engaged in medication non-adherence because of cost:
- In the past 12 months, did you do any of the following because of the cost of your prescriptions?
- Not fill or collect a prescription
- Skip doses of your medication
- Reduce the dosage of your medication
- Delay filling a prescription
- None of the above
Did you:
For analytical purposes, individuals who took or required prescription medications in the past year and engaged in one or more of the first four behaviours were regarded as engaging in cost-related medication non-adherence. Throughout the paper this concept is referred to in short as “non-adherence”.
Regression analysis: The aim of the regression analysis was to determine if there was an association between prescription insurance and medication non-adherence due to cost after adjusting or controlling for other factors for the First Nations and Métis populations separately. A conceptual model on cost-related medication non-adherence (Briesacher et al., 2007; Piette et al., 2006), a review of variables used in similar research (Law et al., 2018), and bivariate analyses informed the selection of characteristics used in the regression models. The characteristics that were not associated with non-adherence in the bivariate analyses, including age, gender, education and province or region, were retained in the regression models because of their conceptual importance. For instance, public prescription insurance regimes differ by province, which could exert influence on non-adherence behaviour once other factors are controlled for. Therefore, province/region was retained as a predictor. Quebec was used as the reference category because it has a compulsory model, which grants fuller coverage to residents in comparison to other provinces and given its use as the reference group in past research (e.g., Law et al., 2018). Health literacy was also an important factor identified in the past literature (Briesacher et al., 2007). This factor was not directly measured in the SAHCPDP, so education was retained as a predictor to be used as a proxy for health literacy. Inclusion of a variable on Status/non-Status was also an important variable included in the model for First Nations people to enable comparisons between Status First Nations people and non-Status First Nations people. This is particularly relevant because those without Status are not covered under NIHB.
Statistical methods
The methodological approach for this project included both descriptive statistics and multivariate logistic regression models. The descriptive analysis entailed conducting cross tabulations to produce estimates of key outcomes by select characteristics. The outcomes included:
- prevalence of prescription insurance coverage;
- percentage who had their insurance coverage impacted by the pandemic
- percentage who took or required prescriptions in the past year, and of these, the percentage who lacked coverage;
- percentage unable to get a new prescription from a health care provider by appointment status;
- percentage with out-of-pocket prescription medication expenses; and,
- prevalence of not adhering to prescription medication due to cost.
Hypothesis tests (t-tests) were conducted to determine if there was a difference between Indigenous groups compared to the non-Indigenous population. Hypothesis tests were also conducted to compare Status and non-Status First Nations populations to determine if differences existed, particularly given that the latter group is not covered under NIHB. Where feasible, additional subgroup analyses were conducted by gender and age.
Proportions presented in the article excluded missing values from the denominator for all variables. Estimates with a coefficient of variation (CV) between 15% and 35% are indicated with an E and should be used with caution. Estimates with CVs over 35% are not reported. Variance and 95% confidence intervals were calculated using 1,000 bootstrap weights. Significance testing at p<0.05 was used to identify estimate differences that are statistically significant.
Multivariate logistic regression models were used to determine if there is a relationship between prescription insurance coverage and cost-related medication non-adherence (outcome), while accounting for select socioeconomic and demographic characteristics (e.g., age, income, number of prescription medications required, Registered Indian status, etc.).
(Y=β0 + β1 X1 ….+ βΡ XP + residual)
The adjusted models also allow for all independent variables to be run simultaneously to see if each primary independent variable is associated with non-adherence when controlling for all the remaining variables. The article presents odds ratios (OR) of non-adherence for each independent variable.
The selection of independent variables was informed by previous literature and the conceptual model developed by Piette et al. (2006) and adapted by Briesacher et al. (2007). The regression analyses included separate models for the First Nations population living off reserve and Métis. A separate model was not feasible for the Inuit population using data from the SAHCPDP because of a small sample size.
Limitations
This research study had a few notable limitations. The coverage of the survey excluded the First Nations population living on reserve, as well as the territories, parts of which make up Inuit Nunangat. Therefore, estimates presented here may not be representative of First Nations people living on reserve and Inuit living in the territories. The Inuit sample size from the provinces was small. Consequently, some estimates were deemed too unreliable to be reported on and other estimates have large variances. These results should therefore be interpreted with caution. Despite these limitations, our findings largely align with past research.
The survey was administered via telephone and online. Therefore, those without access to telephone or Internet were also excluded from the survey. It is therefore unknown the degree to which our results are biased due to the exclusion of this group. It is conceivable that those without access to phone or internet face additional structural barriers and thus the prevalence of prescription insurance coverage and non-adherence among this group may differ significantly from the sampled population. All survey responses were also based on self-reports which may be subject to bias (e.g., recall bias).
Another limitation of the study was that the SAHCPDP did not ask about the type of prescription coverage i.e., employer-sponsored, government sponsored (e.g., NIHB), or private, self-funded insurance, which would have enabled investigation of whether coverage type was associated with out-of-pocket medication expenses and cost-related medication non-adherence. Inclusion of coverage type would have also added greater precision to measuring prescription insurance coverage.
Authors
Andrew Canning and Mohan B. Kumar are with the Centre for Indigenous Statistics and Partnerships, Social Data Insights, Integration and Innovation Branch, at Statistics Canada. Lydia Clarke-Rehman, Iman Dar, and Nazih Nasrallah are with the Congress of Aboriginal Peoples.
Appendix
Appendix A.1: Cost-related medication non-adherence – bivariate analysis (First Nations population)
| Characteristics | Percent | Lower 95% CI | Upper 95% CI |
|---|---|---|---|
|
|||
| Prescription insurance coverage duration | |||
| Full-year coverage Table A.1 Note † | 7.6 E use with caution | 5.6 | 10.3 |
| Part-year coverage | 23.8 E use with caution Table A.1 Note * | 16.6 | 32.9 |
| No coverage in past year | 20.2 E use with caution Table A.1 Note * | 11.7 | 32.5 |
| Registered Indian Status | |||
| Status Table A.1 Note † | 8.9 | 6.8 | 11.6 |
| Non-Status | 18.6 E use with caution Table A.1 Note * | 13.1 | 25.7 |
| Gender | |||
| Male Table A.1 Note † | 12.2 E use with caution | 9.0 | 16.4 |
| Female | 9.2 E use with caution | 6.7 | 12.5 |
| Age group | |||
| 18 to 24 years | 14.0 E use with caution | 7.4 | 24.9 |
| 25 to 34 years | 18.1 E use with caution | 11.8 | 26.9 |
| 35 to 54 years Table A.1 Note † | 10.1 E use with caution | 7.1 | 14.1 |
| 55 to 64 years | 7.9 E use with caution | 4.7 | 12.9 |
| 65 years and older | 6.2 E use with caution | 3.7 | 10.1 |
| Province/Region | |||
| Atlantic provinces | 10.0 E use with caution | 7.2 | 13.7 |
| Quebec Table A.1 Note † | 14.4 E use with caution | 8.6 | 23.2 |
| Ontario | 9.6 E use with caution | 5.9 | 15.3 |
| Prairies | 9.8 E use with caution | 6.7 | 14.0 |
| British Columbia | 14.5 E use with caution | 9.2 | 22.0 |
| Total Household Income | |||
| Below 20th percentile | 18.7 E use with caution Table A.1 Note * | 13.6 | 25.0 |
| Above 20th percentile Table A.1 Note † | 8.8 E use with caution Table A.1 Note * | 6.3 | 12.1 |
| Education | |||
| Less than high school Table A.1 Note † | 9.6 E use with caution | 6.0 | 15.0 |
| High school or equivalent | 14.6 E use with caution | 9.8 | 21.2 |
| College, Trades, CEGEP, Certificates and Diplomas below the Bachelors level | 10.7 E use with caution | 7.6 | 14.8 |
| Bachelor's degree or higher | 8.3 E use with caution | 4.8 | 14.0 |
| Chronic Conditions, number | |||
| 0 Table A.1 Note † | 6.7 E use with caution | 4.1 | 10.8 |
| 1 | 11.9 E use with caution | 8.0 | 17.2 |
| 2 or more | 13.5 E use with caution Table A.1 Note * | 9.8 | 18.1 |
| Prescription Medications, number | |||
| 1 Table A.1 Note † | 7.4 E use with caution | 5.1 | 10.6 |
| 2 | 15.3 E use with caution Table A.1 Note * | 10.3 | 22.1 |
| 3 or more | 14.6 E use with caution Table A.1 Note * | 10.5 | 20.0 |
| Out of Pocket Prescription Medication Spending, $ | |||
| 0 Table A.1 Note † | 5.3 E use with caution | 3.5 | 7.9 |
| Less than $250 | 18.2 E use with caution Table A.1 Note * | 12.8 | 25.2 |
| $250 or more | 25.5 E use with caution Table A.1 Note * | 18.3 | 34.3 |
Appendix A.2: Cost-related medication non-adherence – bivariate analysis (Métis population)
| Characteristics | Percent | Lower 95% CI |
Upper 95% CI |
|---|---|---|---|
|
|||
| Prescription insurance coverage duration | |||
| Full-year coverage Table A.2 Note † | 8.4 | 6.4 | 10.8 |
| Part-year coverage | 17.9 E use with caution Table A.2 Note * | 12.5 | 25.0 |
| No coverage in past year | 22.7 Table A.2 Note * | 17.1 | 29.6 |
| Gender | |||
| Male Table A.2 Note † | 9.9 E use with caution | 7.3 | 13.4 |
| Female | 14.8 Table A.2 Note * | 12.0 | 18.0 |
| Age group | |||
| 18 to 24 years | 14.3 E use with caution | 8.0 | 24.4 |
| 25 to 34 years | 15.0 E use with caution | 9.8 | 22.4 |
| 35 to 54 years Table A.2 Note † | 13.8 | 10.4 | 18.1 |
| 55 to 64 years | 12.8 E use with caution | 9.1 | 17.8 |
| 65 years and older | 6.1 E use with caution Table A.2 Note * | 4.1 | 9.2 |
| Province/Region | |||
| Atlantic provinces | 12.0 | 9.1 | 15.6 |
| Quebec Table A.2 Note † | 8.4 E use with caution | 5.1 | 13.5 |
| Ontario | 11.1 E use with caution | 6.1 | 19.3 |
| Prairies | 13.3 | 10.5 | 16.5 |
| British Columbia | 14.8 E use with caution | 9.7 | 21.9 |
| Total Household Income | |||
| Below 20th percentile | 19.9 Table A.2 Note * | 15.4 | 25.3 |
| Above 20th percentile Table A.2 Note † | 10.7 | 8.3 | 13.6 |
| Education | |||
| Less than high school Table A.2 Note † | 7.7 E use with caution | 5.0 | 11.8 |
| High school or equivalent | 11.3 E use with caution | 8.0 | 15.8 |
| College, Trades, CEGEP, Certificates and Diplomas below the Bachelors level | 14.1 Table A.2 Note * | 10.9 | 18.1 |
| Bachelor's degree or higher | 14.4 E use with caution | 9.0 | 22.2 |
| Chronic Conditions, number | |||
| 0 Table A.2 Note † | 9.3 E use with caution | 5.7 | 14.8 |
| 1 | 11.5 E use with caution | 8.4 | 15.5 |
| 2 or more | 15.8 Table A.2 Note * | 12.5 | 19.6 |
| Prescription Medications, number | |||
| 1 Table A.2 Note † | 7.9 E use with caution | 5.6 | 11.0 |
| 2 | 16.8 Table A.2 Note * | 12.7 | 21.8 |
| 3 or more | 18.8 Table A.2 Note * | 14.2 | 24.4 |
| Out of Pocket Prescription Medication Spending, $ | |||
| 0 Table A.2 Note † | 4.5 E use with caution | 2.7 | 7.5 |
| Less than $250 | 9.9 E use with caution Table A.2 Note * | 7.0 | 13.7 |
| $250 or more | 26.7 Table A.2 Note * | 21.8 | 32.3 |
References
Allan, B., & Smylie, J. (2015). First peoples, second class treatment: The role of racism in the health and well-being of Indigenous peoples in Canada. Toronto, ON
Arriagada, P., Hahmann, T., & O’Donnell, V. (2020). Indigenous people in urban areas: Vulnerabilities to the socioeconomic impacts of COVID-19.
Barnes, S., & Anderson, L. (2015). Low earnings, unfilled prescriptions: Employer-provided health benefit coverage in Canada. Toronto, Canada
Bleakney, A., Masoud, H., & Robertson, H. (2020). Labour market impacts of COVID-19 on Indigenous people: March to August 2020.
Bolatova, T., & Law, M.R. (2019). Income-related disparities in private prescription drug coverage in Canada. CMAJ Open, 7(4), E618-E623. doi:10.9778/cmajo.20190085
Brandt, J., Shearer, B., & Morgan, S.G. (2018). Prescription drug coverage in Canada: A review of the economic, policy and political considerations for universal pharmacare. Journal of Pharmaceutical Policy and Practice, 11(1), 28. doi:10.1186/s40545-018-0154-x
Briesacher, B.A., Gurwitz, J.H., & Soumerai, S.B. (2007). Patients at-risk for cost-related medication nonadherence: A review of the literature. Journal of General Internal Medicine: JGIM, 22(6), 864-871. doi:10.1007/s11606-007-0180-x
Cortes, K., & Smith, L. (2022). Pharmaceutical access and use during the pandemic.
Glazier, R.H., Green, M.E., Wu, F.C., et al. (2021). Shifts in office and virtual primary care during the early COVID-19 pandemic in Ontario, Canada. Canadian Medical Association Journal (CMAJ), 193(6), E200-E210. doi:10.1503/cmaj.202303
Government of Canada. (2019). A prescription for Canada: Achieving pharmacare for all. Final report of the advisory council on the implementation of national pharmacare.
Hahmann, T., & Kumar, M.B. (2022). Unmet health care needs during the pandemic and resulting impacts among First Nations people living off reserve, Métis and Inuit.
Health Canada. (2021). Enhancing equitable access to virtual care in Canada: principle-based recommendations for equity.
Hennessey, D., Sanmartin, C., Ronksley, P., et al. (2016). Out-of-pocket spending on drugs and pharmaceutical products and cost-related prescription non-adherence among Canadians with chronic disease.
Holbrook, A.M., Wang, M., Lee, M., et al. (2021). Cost-related medication nonadherence in Canada: A systematic review of prevalence, predictors, and clinical impact. Systematic Reviews, 10(1), 11-13. doi:10.1186/s13643-020-01558-5
Indigenous Services Canada. (2022). Non-insured health benefits program: Annual report 2020/2021. Indigenous Services Canada.
Indigenous Services Canada. (2023). About the non-insured health benefits program.
Kemp, A., Roughead, E., Preen, D., et al. (2010). Determinants of self-reported medicine underuse due to cost: A comparison of seven countries. Journal of Health Services Research & Policy, 15(2), 106. doi:10.1258/jhsrp.2009.009059
Kennedy, J., & Morgan, S. (2009). Cost-related prescription nonadherence in the United States and Canada: A system-level comparison using the 2007 International Health Policy Survey in seven countries. Clinical Therapeutics, 31(1), 213. doi:10.1016/j.clinthera.2009.01.006
Kim, P. (2019). Social Determinants of Health Inequities in Indigenous Canadians Through a Life Course Approach to Colonialism and the Residential School System. Health Equity, 3(1), 378–381. doi: 10.1089/heq.2019.0041
Kopp, A., Kumar, M.B, & Aitken, N. (2024). COVID-19 mortality among First Nations people and Métis in private dwellings in Canada: An analysis of social determinants of health and health inequalities.
Kyoon Achan, G., Eni, R., Kinew, K.A., et al. (2021). The two great healing traditions: Issues, opportunities, and recommendations for an integrated First Nations healthcare system in Canada. Health Systems & Reform, 7(1), 1-10. doi:10.1080/23288604.2021.1943814
Law, M.R., Cheng, L., Dhalla, I.A., et al. (2012). The effect of cost on adherence to prescription medications in Canada. Canadian Medical Association Journal (CMAJ), 184(3), 297-302. doi:10.1503/cmaj.111270
Law, M.R., Cheng, L., Kolhatkar, A., et al. (2018). The consequences of patient charges for prescription drugs in Canada: A cross-sectional survey. CMAJ Open, 6(1), E63-E70. doi:10.9778/cmajo.20180008
Lopert, R., Docteur, E., & Morgan, S. (2018). Body count: The human cost of financial barriers to prescription medications. Ottawa, ON: Canadian Federation of Nurses Union.
Loppie, C., & Wien, F. (2022). Understanding Indigenous health inequalities through a social determinants model. National Collaborating Centre for Indigenous Health.
Mashford-Pringle, A., Skura, C., Stutz, S., et al. (2021). What we heard: Indigenous Peoples and COVID-19. Supplementary Report for the Chief Public Health Officer of Canada’s Report on the State of Public Health in Canada. Government of Canada. Ottawa, Ontario.
Moscou, K., Bhagaloo, A., Onilude, Y., et al. (2024). Broken promises: Racism and access to medicines in Canada. Journal of Racial and Ethnic Health Disparities, 11(3), 1182. doi:10.1007/s40615-023-01598-2
Nguyen, A., Guttentag, A., Li, D., et al. (2022). The impact of job and insurance loss on prescription drug use: a panel data approach to quantifying the health consequences of unemployment during the COVID-19 pandemic. Int J Health Serv., 54(3), 312–322. doi: 10.1177/00207314221078749
Piette, J.D., Heisler, M., Horne, R., et al. (2006). A conceptually based approach to understanding chronically ill patients' responses to medication cost pressures. Soc Sci Med, 62, 846–57.
Public Health Agency of Canada. (2020). From risk to resilience: an equity approach to COVID-19.
Statistics Canada. (2020). Labour Force Survey, December 2020.
Statistics Canada. (2021). Census of Population, 2021.
Tang, K., Ghali, W., & Manns, B. (2014). Addressing cost-related barriers to prescription use in Canada. CMAJ, 186(4), 276-280.
Wale, E., & Lavoie, J. (2015). Defined by 0.11%: Policies Delimiting Access to Prescription Drugs for First Nations People in British Columbia. International Journal of Indigenous Health, 10(2), 151-165.
Yang, F., & Gupta, S. (2024). Exploring gaps in prescription drug insurance coverage among men and women in Canada using an intersectional lens. Insights on Canadian Society. Statistics Canada Catalogue no. 75-006-X.
Zeitouny, S., Cheung, D.C., Bremner, K.E., et al. (2023). The impact of the early COVID-19 pandemic on healthcare system resource use and costs in two provinces in Canada: An interrupted time series analysis. PloS One, 18(9), e0290646. doi:10.1371/journal.pone.0290646
- Date modified: