
Insights on Canadian Society
Pharmaceutical access and use during the pandemic
by Kassandra Cortes and Leah Smith

Text begins
Correction notice
Corrections have been made to this product. Please take note of the following changes:
On August 16, 2024, the estimates for “amount spent out of pocket” were corrected. Additionally, all estimates related to insurance being affected by the pandemic were removed due to interpretability concerns.
Start of text box
This study examines Canadians’ access to and use of pharmaceuticals using data from the 2021 Survey on Access to Health Care and Pharmaceuticals During the Pandemic, collected from March to May 2021. First, it examines the proportion and characteristics of Canadians who reported not having prescription insurance to cover medication costs. Next, medication use, out-of-pocket spending on prescription medication, and non-adherence to prescription medication because of cost were examined. Analyses are presented across province, immigration status, and racialized groups, among other sociodemographic variables, and thus offers insight into potential inequities in access to pharmaceuticals in Canada.
- In 2021, about one fifth (21%) of Canadians reported not having insurance to cover any of the cost of prescription medications in the past 12 months.
- Among the provinces, the proportion without prescription insurance to cover medication costs was highest among residents of British Columbia (26%), especially seniors in British Columbia (33%), as well as residents of Prince Edward Island (25%). It was lowest among people living in Nova Scotia (14%).
- Percentages of people reporting not having prescription insurance to cover medication cost was higher among immigrants (29%) relative to non-immigrants (17%) and among racialized persons (29%) relative to non-racialized and non-Indigenous persons (17%).
- Prescription medication use was lower among people who did not have prescription medication insurance (56%) compared to those who did (70%).
- About 1 in 8 Canadians (13%) spent $500 or more out-of-pocket on prescription medications over the past year. Spending was higher for those without prescription insurance than for those with coverage.
- One in 10 Canadians (9%) reported not adhering (e.g., skipping doses, delaying filling) to their prescription medication because of cost. The share of Canadians reporting cost-related non-adherence was more than double among people without prescription insurance (17%) compared to those with prescription insurance (7%).
End of text box
Introduction
Prescription medications are essential in the management of many health issues and chronic conditions.Note Unlike every other developed country with universal health care, Canada does not have universal coverage of prescription medication (i.e., universal pharmacare).Note The decision to implement universal pharmacare is one that has been long debated in Canada, with considerations largely including cost and inequities in accessing prescription medications. In 2018, the Canadian federal government announced the creation of the Advisory Council on the Implementation of National Pharmacare to advise government on introducing a national insurance program for prescription drugs—known as pharmacare. In the 2022 budget, the federal government announced a commitment to passing a Canada Pharmacare Act by the end of 2023. According to the Advisory Council, pharmacare would “replace a patchwork of thousands of plans.”Note
Currently, each province and territory offers prescription insurance coverage to some Canadians through public drug plans that vary in terms of eligibility, affordability, and eligible drugs covered. Comprehensive drug coverage with minimal charges is offered to select eligible vulnerable groups, like seniors, people on social assistance, and people with disabilities.Note Catastrophic drug coverage is also available in most provinces and territories as an extended drug coverage to qualified Canadians with exceptionally high prescription drug costs.Note
Alternatively, some Canadians obtain private prescription insurance through their employer or their spouse’s employer. Others obtain their own private insurance. Those with private or employment-based insurance often have higher paying, full-time jobs and work for larger, often public sector and unionized organizations. In contrast, Canadians who are self-employed, unemployed or who work for smaller companies, and earn lower wages are often left without private prescription insurance.Note
Based on a report from the 2017 Conference Board of Canada, an estimated 5.2% of Canadians were uninsured for prescription medication, and among those eligible for public drug plans, only 59% were enrolled.Note Reasons for not enrolling when eligible could include a lack of awareness about eligibility for the program, difficulty accessing the program, or the deliberate choice not to enrol because of costs associated with prescription plans. Enrolment in public prescription plans is often associated with out-of-pocket costs for premiums, deductibles or co-payments, or caps required by the drug plan, leaving a portion of Canadians underinsured.
Therefore, those who are uninsured, and some who are underinsured, can face significant financial burden because of the out-of-pocket costs associated with prescription medications. The financial burden from out-of-pockets costs for medications can lead to non-adherence to a prescription plan, which has been associated with increased hospital visits and worse health outcomes, including increase in deaths for common conditions.Note Note Note
There is currently a lack of recent nationally representative data on overall prescription insurance coverage, access, and spending on pharmaceuticals in Canada, with the most recent publications using data from 2012 and 2016.Note This study addresses the need for timely data on pharmaceutical access and use (See Data sources, methods and definitions text box) by examining self-reported data from Canadians in 2020-2021 (during part of the COVID-19 pandemic), with a focus on access inequities across provinces and sociodemographic groups. This study provides estimates of the proportion of Canadians who reported not having prescription insurance to cover their medication costs. It also examines medication use, out-of-pocket spending on prescription medication, and non-adherence to prescription medication because of cost.
There is also a lack of disaggregated pharmaceutical use data, with the bulk of disaggregated analyses being on medication use across age and gender.Note Therefore, pharmaceutical access and use is examined across regions and sociodemographic groups. The analysis focuses primarily on immigration status and racialized groups, which are not criteria to determine eligibility for provincial pharmacare plans but have significant associations with employment factors linked to having private prescription insurance.Note This research provides insight into Canadians’ access to and use of pharmaceuticals during the pandemic. Findings on pharmaceutical access and use among the Indigenous population will be released in a forthcoming article.
One fifth of Canadians (21%) reported not having prescription insurance to cover medication costs
According to the 2021 Survey on Access to Health Care and Pharmaceuticals During the Pandemic (SAHCPDP), 1 in 5 (21%) Canadians reported not having insurance to cover any of the cost of prescription medication in the past 12 months. This proportion was similar for men (21%) and women (20%) and across age groups up to the age of 64. For adults 65 and over, a higher percentage (25%) reported not having prescription insurance compared to adults aged 25-64 (18%) (Table 1).Note
Seniors are the most likely to need prescriptions yet have the lowest percentages of reporting having prescription insurance to cover medication costs. All seniors are eligible for prescription insurance under provincial and territorial plans, but these plans vary in access and coverage.Note Depending on the public plan and at times, on income, some seniors are eligible for public prescription insurance but have deductibles that exceed their medication cost. Some may require drugs that are not eligible under provincial plans. It is also possible that some lost their employer-sponsored insurance upon retirement and may not realize that provincial drug coverage is available, are unaware of their insurance eligibility, or have not signed up for insurance due to choice or lack of knowledge about the programs or resources accessing them.Note
| Percentage | |
|---|---|
| All Canadians | 21 |
| Gender | |
| Males | 21Table 1 Note † |
| Females (ref.) | 20 |
| Age | |
| 18-24 | 21Table 1 Note † |
| 25-34 | 20Note * |
| 35-44 | 18Note ** |
| 45-54 | 18Note ** |
| 55-64 | 21Note * |
| 65+ (ref.) | 25 |
| Immigration status | |
| Immigrant (all) | 29Note ** |
| Recent immigrant (within 10 years of landing) | 31Note ** |
| Established immigrant (10 years or more since landing) | 28Note ** |
| Non-immigrant (ref.) | 17 |
| Racialized groups | |
| South Asian | 27Note ** |
| Chinese | 33Note ** |
| Black | 27Note * |
| Filipino | 21Table 1 Note ‡ |
| Arab | 25Table 1 Note ‡ |
| Latin American | 32Table 1 Note ‡ |
| Southeast Asian | 30Table 1 Note ‡ |
| West Asian | 41Table 1 Note ‡ |
| Other racialized groups | 22Table 1 Note ‡ |
| Non-racialized and non-Indigenous (ref.) | 17 |
Source: Statistics Canada, Survey on Access to Health Care and Pharmaceuticals During the Pandemic, 2021. |
|
Provincial and territorial differences in prescription insurance coverage are especially relevant because of the different drug benefit programs across provinces and territories. Chart 1 shows the overall proportion of people not having prescription insurance compared to Canadians aged 65 and over, by province. Data were not collected in the territories.

Data table for Chart 1
| Province | Canadians all ages | Canadians 65+ |
|---|---|---|
| percent | ||
| B.C. | 26Note ** | 33Note ** |
| Alta. | 17Note ** | 9Note ** |
| Sask. | 19 | 31Note * |
| Man. | 21 | 33Note ** |
| Ont. | 22Note * | 23 |
| Que. | 18Note * | 30Note ** |
| N.B. | 17Note * | 16Note ** |
| N.S. | 14Note ** | 11Note ** |
| P.E.I. | 25Note * | 24 |
| N.L. | 17Note * | 19Note * |
| Canada | 21 | 25 |
Source: Statistics Canada, Survey on Access to Health Care and Pharmaceuticals During the Pandemic, 2021. |
||
Overall, the share of Canadians reporting no prescription coverage varied considerably across the provinces, ranging from a high of 26% in British Columbia to a low of 14% in Nova Scotia. The situation for seniors was similar – the highest percentages of reporting no prescription coverage were among seniors living in B.C. (33%) and Manitoba (33%) and lowest among seniors in Alberta (9%) and Nova Scotia (11%). Differences in provincial plans likely play a role in the observed differences. For example, British Columbia and Manitoba, the provinces with the highest percentages of seniors without prescription coverage, have income-based deductible public coverage for all residents (including seniors). Therefore, for some seniors, especially higher income seniors, deductibles may surpass prescription cost, meaning they pay 100% out of pocket for their medication, and therefore, may have reported that they did not have insurance to cover the cost of medication in the last 12 months.
Along with pharmacare policies, provincial differences in prescription coverage could also be explained by factors including provincial variations in age or other sociodemographic characteristics. However, even when excluding seniors (65+ years) from analyses, provincial variations in insurance coverage mirrored the overall patterns suggesting that differences in coverage among seniors cannot account for provincial differences in prescription insurance coverage.
A higher percentage of immigrants and racialized persons reported not having insurance to cover medication costs
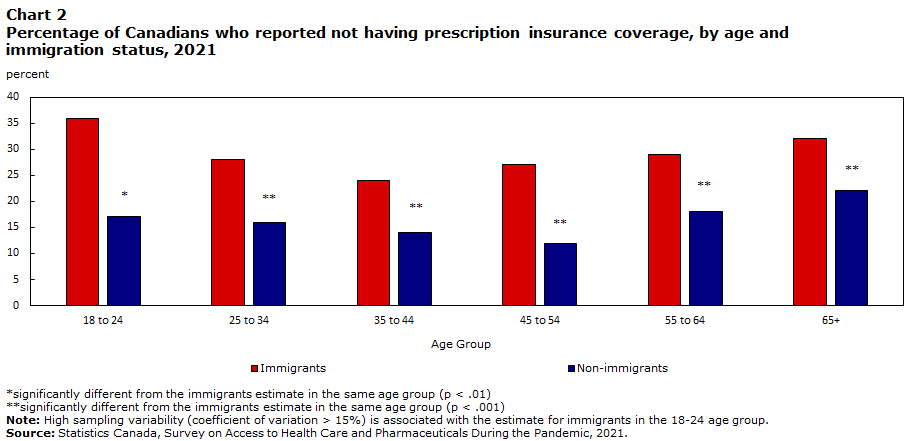
Close to one-third (29%) of immigrants reported not having prescription insurance to cover medication costs, compared with only one-sixth (17%) of non-immigrants.Note This self-reported non-coverage was heightened among recent immigrants, where 31% of immigrants who landed within 10 years reported having no coverage, compared to 28% of established immigrants.Note The higher percentage of immigrants without prescription insurance was consistent across all age groups, with the percentage point difference between immigrants and non-immigrants being highest for the youngest age group – 18 to 24 years (19 percentage points) (Chart 2).Note
Given that prescription insurance can be offered by employers, employment factors likely contribute to differences in prescription insurance coverage by immigration status and racialized groups.Note For example, in 2021, the unemployment rate for immigrants was higher at 8.4% compared to 7.0% for non-immigrants.Note The unemployment rate for racialized persons is also generally higher. This difference varies over time but the inequity appears to persist.Note Immigrants also tend to have shorter-tenure jobs and work in lower paying jobs, which in addition to being more susceptible to lay-offs, are also the kinds of jobs that are less likely to offer insurance plans for prescription drugs.Note
Data table for Chart 2
| Age | Immigrants | Non-immigrants |
|---|---|---|
| percent | ||
| 18 to 24 | 36 | 17Note * |
| 25 to 34 | 28 | 16Note ** |
| 35 to 44 | 24 | 14Note ** |
| 45 to 54 | 27 | 12Note ** |
| 55 to 64 | 29 | 18Note ** |
| 65+ | 32 | 22Note ** |
Source: Statistics Canada, Survey on Access to Health Care and Pharmaceuticals During the Pandemic, 2021. |
||
Racialized persons also had a higher percentage of reporting not having prescription insurance coverage (29%) compared to non-racialized and non-Indigenous groups (17%). This was the case for all age groups. Among racialized persons, reports of not having prescription medication coverage were highest for West Asians (41%), Chinese (33%), and Latin Americans (32%) (see Table 1).Note
To assess whether differences in reports of prescription insurance coverage observed across immigration status and racialized groups were driven by other factors, a multivariable model was run with the outcome variable of insurance coverage and covariates related to personal characteristics including immigration status, racialized group, age, disability status, as well as reported overall health and province, all of which were univariately associated with insurance coverage. Immigration status and the racialized person variable remained significant predictors of insurance coverage with the above covariates in the model (p < .001), suggesting their robustness as independent predictors. However, future research should run additional modeling to better understand the role of a variety of factors (e.g., health beliefs, access-related factors, enabling factors like marital status, person-level income, employment factors, living arrangements) when it comes to insurance coverage.
Two-thirds of Canadians were taking or prescribed medication during the pandemic
In 2021, two-thirds (67%) of Canadians reported taking or being prescribed medication in the last 12 months. Medication use tended to vary in the same way as provincial patterns in prescription coverage. The three provinces with the highest percentages of residents without prescription insurance coverage – British Columbia, Prince Edward Island and Ontario – were also the provinces with the lowest percentages of medication use (63% to 67%, compared to the highest percentages of 75% for Newfoundland and 73% for New Brunswick). Finally, consistent with previous research from data collected between 2007 and 2011, as well as between 2016 and 2019, medication use was higher for women (74%) compared to men (60%) and for older adults (86% for 65+) compared to younger adults (47% for adults aged 18-24) (Table 2).Note
Just as a lower percentage of immigrants (versus non-immigrants) and racialized persons (vs. non-racialized and non-Indigenous groups) reported having prescription insurance coverage, a lower percentage of immigrants (60%)—especially recent immigrants (46%)—and racialized people (55%) also reported taking or having been prescribed medication in the past 12 months.Note Across groups, percentages of reports of medication use were lowest for those who identified as Chinese (49%) and Filipino (49%) and were highest for those who identified as Latin American (62%).
Although the sample was not large enough to run multivariable analyses with covariates while contrasting racialized persons individually, a multivariable model was run with medication use as the outcome variable and immigration status, belonging to a racialized group, gender, age, province, disability status, and reported overall health as covariates. Immigration status remained a significant predictor of medication use, whereas being racialized was no longer significant in predicting prescription use. A larger sample size is needed to run models while comparing across individual racialized groups to determine the significance of group differences when accounting for other variables.
| Percentage | |
|---|---|
| All Canadians | 67 |
| Gender | |
| Males | 60Note ** |
| Females (ref.) | 73 |
| Age | |
| 18-24 | 47Note ** |
| 25-34 | 55Note ** |
| 35-44 | 59Note ** |
| 45-54 | 66Note ** |
| 55-64 | 74Note ** |
| 65+ (ref.) | 86 |
| Provinces | |
| B.C. | 63Note * |
| Alta. | 69Table 2 Note † |
| Sask. | 68Table 2 Note † |
| Man. | 67Table 2 Note † |
| Ont. | 65Note * |
| Que. | 70Note * |
| N.B. | 73Note ** |
| N.S | 70Note * |
| P.E.I. | 67Table 2 Note † |
| N.L. | 75Note ** |
| Canada (ref.) | 67 |
| Immigration status | |
| Immigrant (all) | 60Note ** |
| Recent immigrant (within 10 years of landing) | 46Note ** |
| Established immigrant (10 years or more since landing) | 65Note * |
| Non-immigrant (ref.) | 70 |
| Racialized groups | |
| South Asian | 60Note ** |
| Chinese | 49Note ** |
| Black | 56Note ** |
| Filipino | 49Note ** |
| Arab | 60Note ** |
| Latin American | 62Table 2 Note † |
| Southeast Asian | 56Note ** |
| Other racialized groups | 61Note * |
| Non-racialized and non-Indigenous (ref.) | 71 |
Source: Statistics Canada, Survey on Access to Health Care and Pharmaceuticals During the Pandemic, 2021. |
|
Prescription medication use lower among people who did not have prescription medication insurance
Given the cost of taking prescription medication, having prescription insurance may be important to accessing medication when needed. In the current study, for Canadians who reported having some level of prescription insurance coverage, 70% reported having taken or been prescribed medication in the past 12 months. This was higher than the proportion (56%) of those without prescription insurance. There is some research showing that compared to insured Canadians, those who are uninsured are less likely to get the medication they need because of cost.Note That being said, it is also possible that there are other reasons for not taking or being prescribed medication. In some cases, people may not sign-up for insurance because they do not need it. There can also be health care barriers, such as not having a regular health care provider. Indeed, among those who needed health care services, 9% reported they were not able to schedule an appointment during the pandemic.Note There can also be differences in perspectives on prescription medicine versus traditional medicine.
About 1 in 8 Canadians who took or were prescribed medications spent $500 or more out-of-pocket on prescription medications over the past year
In Canada, the cost of medications is the third highest among the Organisation for Economic Co-operation and Development (OECD) countries.Note Most often, Canadians who took or were prescribed medication were spending less than $250 out-of-pocket per year, with about three quarters (76%) either having no out-of-pocket expenses or paying up to $249 annually. Still, about 1 in 8 (13%) were spending $500 of more out-of-pocket for their prescription medication over the past year, with no difference between men and women. Not unexpectedly, the amount spent out-of-pocket differed between those with and without prescription insurance coverage. In particular, 23% without prescription insurance spent $500 or more, compared to 10% with insurance.
Immigrants who took or were prescribed medications spent less per year out-of-pocket (10% spent $500 or more) compared to non-immigrants (13% spent $500 or more). Similarly, racialized people who took or were prescribed medications spent less per year out-of-pocket (9% spent $500 or more) compared to the non-racialized and non-Indigenous population (14% spent $500 or more). Although it is possible that in some cases, immigrants and racialized people have better prescription insurance coverage than non-immigrants and non-racialized and non-Indigenous people, data from this and past research suggest that better coverage is likely not the leading explaining factor. Rather, more immigrants and racialized people reported not having prescription insurance compared to non-immigrants and non-racialized and non-Indigenous people. It is possible that immigrants and racialized people are less likely to fill their prescription or that they take fewer medications due to issues accessing medication, financial constraints, or a greater preference for alternative remedies, with drug usage being a last resort.Note Note
One in 10 Canadians reported not adhering to their prescription because of cost
Among Canadians who took or were prescribed medication in the past 12 months, close to 1 in 10 (9%) reported not adhering to their prescription medication (e.g., delayed filling, skipped doses) because of cost. Cost-related non-adherence did not vary by gender but generally decreased with age, from 16% for adults aged 25 to 34 to 4% for seniors aged 65 years and older.
Not having insurance coverage proved to be a barrier for some. Specifically, individuals without prescription insurance were almost 2.5 times more likely than those with coverage to report not adhering to their prescription because of cost (17% versus 7%).
Despite lower levels of prescription coverage, cost-related non-adherence was not higher among immigrants. That is, the same percentage (9%) of immigrants and non-immigrants reported not adhering to prescriptions due to cost. However, it is possible that some immigrants may have trouble accessing health care services in the first place, and therefore, were never asked the question on cost-related non-adherence. Only those who took or were prescribed medication were asked about cost barriers.
There was, however, a difference between racialized and non-racialized and non-Indigenous Canadians in adherence, with 12% of racialized people not adhering because of cost, compared to 8% of non-racialized and non-Indigenous people.
Conclusion
In the Advisory Council on the Implementation of National Pharmacare’s final 2019 report, The Advisory Council stated that national pharmacare will “replace a patchwork of thousands of plans that are nearing their financial breaking point (and yet leaving millions of Canadians unable to get the medicine they need) with one that is sustainable, fair and equitable, where all Canadians have access to prescription medicines based on need, and not their ability to pay.”Note
This research highlighted the problems with the varying provincial plans by identifying some of the gaps in the current system. About one in five Canadians reported not having prescription insurance to cover their medication costs in the past 12 months. There was considerable inter-provincial variation, and coverage was lower among immigrants and for all racialized groups, highlighting medication access inequities across regions and subpopulations. Future research could assess more clearly the proportion of Canadians with insurance coverage, distinguishing clearly from private versus public insurance, and among those with insurance, the percentage of their prescription costs covered by those insurance plans. This would help inform the effectiveness of provincial drug plans in particular.
The provinces and groups (i.e., immigrants, racialized people) with the lowest prescription insurance coverage were also the same as those with the lowest shares of medication use. This suggests that prescription insurance is one important route to accessing medication. Indeed, people without prescription insurance spent more money out-of-pocket annually on prescription medications than people with coverage, and they also had a higher percentage of reporting not adhering to their medication because of cost—a serious problem when untreated conditions result in poorer health and higher death rates.Note
Future studies could be designed to examine the intersection of various sociodemographic characteristics, including age, gender, immigrant status, racialized group, and province and territory of residence on pharmaceutical use and access. Such intersectionality would allow for a more granular understanding of Canadians’ experiences with pharmaceutical use and access.
In the 2022 budget, the federal government announced a commitment to “tabling a Canada Pharmacare bill and working to have it passed by the end of 2023” and task the Canadian Drug Agency to develop a national formulary of essential medicines and bulk purchasing plan. The government allocated $35 million over four years for Prince Edward Island to advance the implementation of universal national pharmacare.Note However, the future of universal pharmacare and achieving equitable access to pharmaceuticals in Canada, is still uncertain.
Kassandra Cortes is an analyst and Leah Smith is a unit head in the Health Statistics Branch
Start of text box
Data sources, methods and definitions
The Survey on Access to Health Care and Pharmaceuticals During the Pandemic (SAHCPDP) was a voluntary survey conducted from March 8, 2021 to May 15, 2021 and collected information from over 25,000 respondents. The target population of the survey included persons 18 years of age or older living in the ten provinces and excluded persons living on reserves and other Indigenous settlements in the provinces and the institutionalized population. An oversample of Indigenous people living in the ten provinces was included to increase the reliability of estimates for First Nations people living off reserve, Métis and Inuit living in the ten provinces. The additional sample was drawn from those who identified as Indigenous in the 2016 Census.
The SAHCPDP is a sample survey with a stratified sample and a cross sectional design. Survey weights were derived using Dwelling Universe File (DUF) to target all Canadians aged 18+ years old and the 2016 Census long form for respondents who self-identified as Indigenous in order to target the subpopulation of Canadian Indigenous people aged 18+ years old.
All estimates were produced using survey weights, which addresses non-response bias and makes the results representative of the Canadian population. The sampling variance was calculated by using bootstrap weights. Multivariable analyses were conducted using binary logistic regression and all analyses were conducted using SAS 9.4 software.
The questions about prescription insurance coverage, medication use, amount spent out-of-pocket, and not adhering to prescription medication because of cost are listed in order below:
- In the past 12 months, did you have insurance to cover at least some of the cost of prescription medications?
A. Yes, had insurance for all of the last 12 months
B. Yes, had insurance for part of the last 12 months
C. No
For the purposes of this study, respondents who answered to either one of the two “yes” options were coded as having prescription insurance to cover at least some of the cost of prescription medications for all or part of the past year.
- In the past 12 months, have you taken or were you prescribed any prescription medications?
A. Yes
B. No
- What was the approximate out of pocket cost in the past 12 months?
A. $0 to $249
B. $250 to $499
C. $500 to $749
D. $750 to $999
E. $1000 or more
- In the past 12 months, did you do any of the following because of the cost of your prescriptions?
Did you:
A. Not fill or collect a prescription
B. Skip doses of your medication
C. Reduce the dosage of your medication
D. Delay filling a prescription
E. None of the above
For the purposes of this study, respondents who answered to at least one of A-D responses were coded as not adhering to prescription medication because of cost, which was in contrast to those selecting “none of the above” who were coded as not engaging in non-adherence because of cost.
For the purposes of this study, immigrants refer to persons who are, or who have ever been, landed immigrants or permanent residents. Such persons have been granted the right to live in Canada permanently by immigration authorities. Immigrants who have obtained Canadian citizenship by naturalization are included in this category. Non-immigrants refer to the Canadian-born.
“Racialized persons” refers to whether or not a person belongs to one of the ‘visible minority’ population groups defined by the Employment Equity Act. The Employment Equity Act defines ‘visible minorities’ as "persons, other than Aboriginal peoples, who are non-Caucasian in race or non-white in colour." The racialized population consists mainly of the following groups: South Asian, Chinese, Black, Filipino, Latin American, Arab, Southeast Asian, West Asian, Korean and Japanese.
End of text box
- Date modified: