
Economic and Social Reports
Potential occupational exposure to artificial intelligence across selected cultural industries in Canada
 , Rupert Allen, Search for Statistics Canada publications by Josip Lesica, Josip Lesica , ORCID for Josip Lesica and Search for Statistics Canada publications by Jenny Watt, Jenny Watt , ORCID for Jenny Watt
 DOI: https://doi.org/10.25318/36280001202600300003-eng
Text begins
Abstract
A central concern surrounding recent advances in generative artificial intelligence (AI) technologies is their potential to replace human labour, especially in the domain of content creation, such as the production of music, videos, images and text in the cultural industries. However, there is a lack of information regarding how AI may impact workers in these industries. This article attempts to fill this information gap by examining potential occupational exposure to and complementarity with AI in selected cultural industries in Canada. A key finding is that occupations in cultural industries could potentially be more exposed to AI-related job transformation, facing a higher potential for AI substitution compared with jobs in other industries. However, jobs in cultural industries also have a greater potential to be augmented by AI. Although some evidence suggests relatively slower employment growth in certain cultural industries since the mass availability of generative AI tools in late 2022, it remains unclear whether the observed changes are solely driven by AI or result from the cumulative effects of pre-existing trends and other competing economic forces.
Acknowledgments
This article was supported by Canadian Heritage. The authors would like to thank Ryan Macdonald, Marc Frenette, Ping Ching Winnie Chan, Meghan Fulford and Behnoush Amery for their helpful comments and suggestions.
Authors
Tahsin Mehdi, Josip Lesica and Jenny Watt are with the Economic and Social Analysis and Modelling Division, Analytical Studies and Modelling Branch, at Statistics Canada. Rupert Allen is with the Strategic Policy, Planning and Research Directorate at Canadian Heritage.
Introduction
The mass availability of generative artificial intelligence (AI) tools has lowered the barriers for producing new creative content such as music, videos, images and text in the cultural
However, there is a lack of information about the potential impact of AI on employment across these cultural industries. This article attempts to fill this information gap by leveraging data from the 2021 Census of Population; the Canadian Employer–Employee Dynamics Database; and the Survey of Employment, Payrolls and Hours (SEPH). The focus is on employees in the commercial sector and employed in the following industries in the 2022 version of the North American Industry Classification System (NAICS): video game publishers (513212) and video game design and development services
To analyze the relationship between AI and employment in these industries, this article uses the complementarity-adjusted AI occupational exposure (C-AIOE) index, which categorizes occupations within industries into three groups: (1) high exposure and low complementarity, (2) high exposure and high complementarity, and (3) low exposure. The index assigns an exposure and complementarity score to each occupation and then classifies it as having high or low exposure and high or low complementarity based on the median exposure and complementarity score across all occupations. Occupational exposure to AI can be thought of as the potential for AI applications to substitute, complement or transform tasks within an occupation. Complementarity can be thought of as the degree to which AI technologies may augment or enhance human labour. The C-AIOE index was developed in the United States by Felten et al. (2021) and Pizzinelli et al. (2023). Mehdi and Morissette (2024) and Mehdi and Frenette (2024, 2026) applied the method to examine the potential impact of AI on the broader Canadian workforce.
Jobs in selected cultural industries are potentially more exposed to generative artificial intelligence technologies
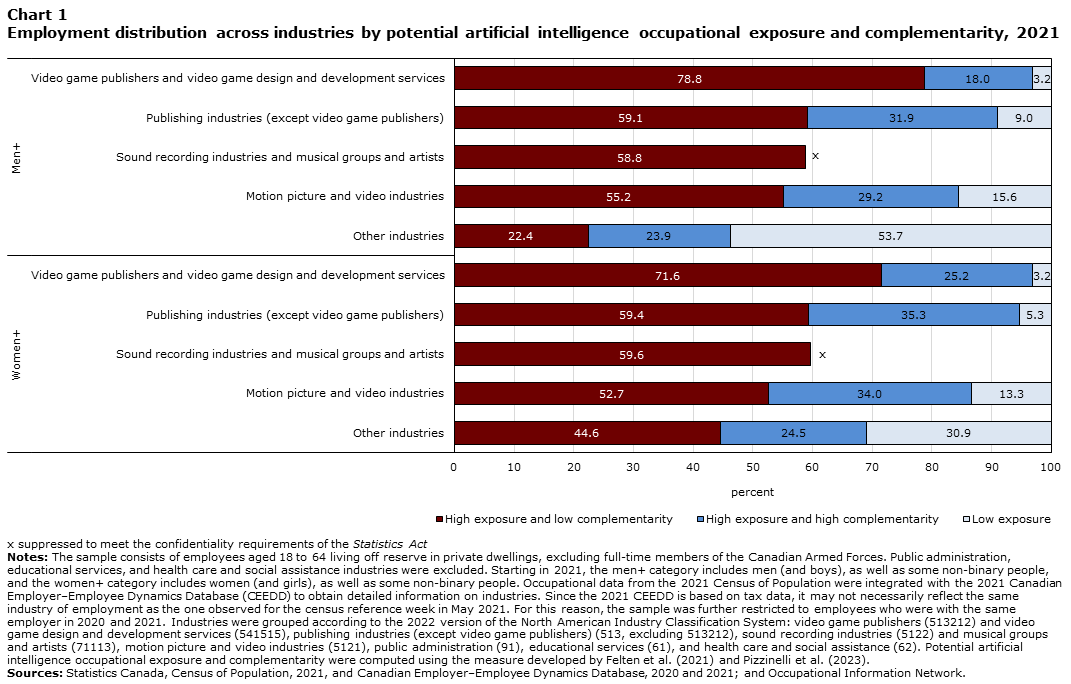
Chart 1 indicates that the selected group of cultural industries—video game publishers and video game design and development services, publishing industries (except video game publishers), sound recording industries and musical groups and artists, and motion picture and video industries—could potentially be more exposed to AI technologies than other sectors of the economy.
Data table for Chart 1
| High exposure and low complementarity | High exposure and high complementarity | Low exposure | |
|---|---|---|---|
| percent | |||
Sources: Statistics Canada, Census of Population, 2021, and Canadian Employer–Employee Dynamics Database, 2020 and 2021; and Occupational Information Network. |
|||
| Men+ | |||
| Video game publishers and video game design and development services | 78.8 | 18.0 | 3.2 |
| Publishing industries (except video game publishers) | 59.1 | 31.9 | 9.0 |
| Sound recording industries and musical groups and artists | 58.8 | x suppressed to meet the confidentiality requirements of the Statistics Act | x suppressed to meet the confidentiality requirements of the Statistics Act |
| Motion picture and video industries | 55.2 | 29.2 | 15.6 |
| Other industries | 22.4 | 23.9 | 53.7 |
| Women+ | |||
| Video game publishers and video game design and development services | 71.6 | 25.2 | 3.2 |
| Publishing industries (except video game publishers) | 59.4 | 35.3 | 5.3 |
| Sound recording industries and musical groups and artists | 59.6 | x suppressed to meet the confidentiality requirements of the Statistics Act | x suppressed to meet the confidentiality requirements of the Statistics Act |
| Motion picture and video industries | 52.7 | 34.0 | 13.3 |
| Other industries | 44.6 | 24.5 | 30.9 |
Occupations in the selected cultural industries skew heavily towards computer systems professionals, graphic artists and musicians, who may face relatively more AI-related job transformation because their jobs are more dependent on interfacing with digital technologies. Over 50% of jobs in the selected cultural industries are potentially highly exposed to and less complementary with AI technologies, versus less than 45% of jobs in other sectors of the
Conversely, and with the exception of video game publishers and video game design and development services, roughly 30% to 35% of jobs in the selected cultural industries are potentially highly complementary with AI technologies. These jobs have relatively more potential to be augmented or enhanced by AI. By contrast, about 25% of jobs may fall into this category in other industries.
While there is considerable uncertainty surrounding the scale of disruption that could be triggered by AI, it is also important to consider the quality of jobs that could potentially face disruption in cultural industries. For example, in 2022, median annual wages (in constant 2025 dollars) for video game publishers and video game design and development services ($96,000), publishing industries (except video game publishers) ($85,000), motion picture and video industries ($59,000), and sound recording industries and musical groups and artists ($57,000) were substantially higher than median annual wages in other industries ($50,000). With the exception of motion picture and video industries, jobs in the selected cultural industries were also more likely to be full-time and permanent compared with jobs in other industries.
Employment growth varied substantially across selected cultural industries since the mass availability of generative artificial intelligence technologies
Chart 2 shows monthly employment growth across selected cultural industries from January 2018 to November 2025 relative to the level observed in November 2022 - when ChatGPT became widely available and led to the mass availability of other generative AI

Data table for Chart 2
| Newspaper, periodical, book and directory publishers | Software publishers | Motion picture and video industries | Computer systems design and related services | Performing arts companies | Other industries (except sound recording industries) | |
|---|---|---|---|---|---|---|
| index (November 2022 = 100) | ||||||
| Notes: The dashed vertical line marks the beginning of the mass availability of ChatGPT and other generative artificial intelligence (AI) tools in November 2022. Public administration, educational services, and health care and social assistance industries were excluded. Employment growth is expressed relative to the level observed in November 2022. For example, an index of 70 would indicate a 30% decrease (70 - 100 = -30) in employment relative to the November 2022 level, while an index of 130 would indicate a 30% increase (130 - 100 = 30). Employment growth trend for sound recording industries, which accounted for 0.02% of employment in November 2025, was excluded for ease of presentation. Employment growth trends since November 2022 do not necessarily reflect advances in generative AI alone. Other economic factors also played a role in shaping employment growth trends.
Source: Statistics Canada, table 14-10-0220-01 Employment and average weekly earnings (including overtime) for all employees by industry, monthly, seasonally adjusted, Canada. |
||||||
| 2018 | ||||||
| January | 136.2 | 71.6 | 71.8 | 61.8 | 114.3 | 93.7 |
| February | 137.2 | 73.0 | 73.6 | 62.4 | 117.2 | 94.0 |
| March | 137.2 | 73.1 | 71.5 | 63.4 | 116.4 | 94.4 |
| April | 136.1 | 74.0 | 71.4 | 63.4 | 118.4 | 94.3 |
| May | 133.9 | 73.9 | 73.5 | 64.0 | 121.2 | 94.7 |
| June | 132.6 | 74.6 | 73.4 | 64.2 | 121.4 | 94.8 |
| July | 131.5 | 75.0 | 72.1 | 64.3 | 121.2 | 94.7 |
| August | 127.3 | 75.5 | 72.1 | 64.8 | 122.2 | 94.9 |
| September | 128.0 | 76.5 | 70.6 | 64.8 | 121.1 | 95.1 |
| October | 129.1 | 77.0 | 71.3 | 65.4 | 126.2 | 95.3 |
| November | 126.3 | 76.7 | 71.0 | 65.7 | 126.8 | 96.0 |
| December | 126.2 | 78.0 | 70.2 | 65.9 | 125.8 | 96.0 |
| 2019 | ||||||
| January | 126.1 | 79.5 | 72.8 | 66.3 | 127.3 | 96.3 |
| February | 127.8 | 79.6 | 73.2 | 66.4 | 128.9 | 96.5 |
| March | 128.7 | 80.3 | 74.5 | 66.9 | 130.7 | 96.6 |
| April | 128.0 | 79.8 | 74.8 | 67.3 | 128.4 | 96.5 |
| May | 126.6 | 81.2 | 76.0 | 67.4 | 130.8 | 96.6 |
| June | 125.1 | 79.5 | 77.1 | 68.1 | 128.4 | 96.7 |
| July | 124.6 | 79.6 | 76.5 | 68.7 | 130.9 | 96.9 |
| August | 122.9 | 79.7 | 76.7 | 69.3 | 130.3 | 97.0 |
| September | 121.8 | 79.7 | 77.8 | 69.4 | 134.3 | 96.9 |
| October | 121.1 | 81.4 | 77.6 | 69.5 | 138.6 | 96.9 |
| November | 119.4 | 80.4 | 78.9 | 70.1 | 140.8 | 97.0 |
| December | 117.4 | 81.0 | 80.2 | 70.2 | 139.9 | 97.1 |
| 2020 | ||||||
| January | 116.8 | 81.5 | 82.8 | 70.2 | 135.8 | 97.1 |
| February | 114.4 | 81.6 | 83.1 | 70.6 | 137.6 | 97.0 |
| March | 107.9 | 81.9 | 75.8 | 69.2 | 124.8 | 90.2 |
| April | 102.4 | 81.8 | 57.1 | 69.1 | 84.5 | 77.9 |
| May | 102.8 | 80.9 | 38.4 | 68.8 | 70.0 | 75.5 |
| June | 103.4 | 80.7 | 38.3 | 68.8 | 67.4 | 80.1 |
| July | 105.3 | 81.1 | 41.5 | 70.1 | 72.9 | 84.3 |
| August | 104.9 | 82.7 | 54.1 | 70.8 | 69.3 | 86.4 |
| September | 101.4 | 84.0 | 69.8 | 71.3 | 82.8 | 88.3 |
| October | 103.7 | 84.8 | 74.9 | 72.0 | 74.9 | 89.5 |
| November | 101.8 | 85.3 | 72.6 | 72.7 | 75.5 | 89.2 |
| December | 102.8 | 86.0 | 71.4 | 73.2 | 66.7 | 89.3 |
| 2021 | ||||||
| January | 103.6 | 87.0 | 70.8 | 74.3 | 74.7 | 88.3 |
| February | 103.8 | 88.0 | 73.5 | 75.0 | 72.8 | 88.8 |
| March | 102.7 | 88.8 | 74.5 | 75.6 | 70.8 | 90.3 |
| April | 100.9 | 89.5 | 74.0 | 76.3 | 66.2 | 91.0 |
| May | 102.8 | 90.2 | 73.5 | 77.7 | 60.9 | 89.3 |
| June | 102.4 | 90.7 | 73.5 | 78.7 | 64.1 | 90.6 |
| July | 101.3 | 92.5 | 76.6 | 79.3 | 76.8 | 92.6 |
| August | 101.7 | 93.6 | 78.0 | 79.9 | 81.8 | 93.5 |
| September | 102.2 | 94.9 | 80.3 | 82.6 | 84.1 | 94.0 |
| October | 102.5 | 97.1 | 82.8 | 83.7 | 83.1 | 94.8 |
| November | 103.1 | 98.3 | 83.0 | 85.0 | 84.1 | 95.2 |
| December | 103.6 | 99.0 | 84.9 | 86.5 | 90.8 | 95.8 |
| 2022 | ||||||
| January | 102.0 | 97.7 | 80.5 | 88.5 | 94.1 | 95.7 |
| February | 104.2 | 99.7 | 83.0 | 89.5 | 93.3 | 96.3 |
| March | 103.3 | 99.7 | 83.1 | 90.9 | 97.7 | 97.3 |
| April | 102.8 | 99.6 | 91.7 | 92.5 | 102.3 | 98.0 |
| May | 101.1 | 99.3 | 92.0 | 93.5 | 104.9 | 98.0 |
| June | 100.0 | 101.0 | 93.4 | 94.5 | 108.0 | 98.7 |
| July | 100.4 | 102.5 | 94.3 | 96.4 | 108.9 | 99.0 |
| August | 101.9 | 102.4 | 97.3 | 97.3 | 111.4 | 99.1 |
| September | 101.1 | 101.4 | 100.1 | 98.3 | 110.8 | 99.6 |
| October | 101.0 | 101.9 | 100.8 | 99.6 | 101.6 | 99.7 |
| November | 100.0 | 100.0 | 100.0 | 100.0 | 100.0 | 100.0 |
| December | 97.8 | 99.2 | 98.8 | 100.4 | 99.2 | 100.3 |
| 2023 | ||||||
| January | 98.2 | 99.0 | 93.2 | 100.6 | 101.5 | 100.6 |
| February | 98.2 | 98.4 | 90.3 | 100.8 | 103.5 | 100.9 |
| March | 98.2 | 99.0 | 87.1 | 101.0 | 104.7 | 100.8 |
| April | 97.2 | 97.4 | 86.9 | 101.4 | 104.5 | 100.9 |
| May | 95.4 | 96.8 | 87.3 | 101.6 | 104.8 | 101.1 |
| June | 94.6 | 94.1 | 83.6 | 101.9 | 102.0 | 101.2 |
| July | 94.3 | 94.1 | 78.9 | 101.1 | 105.4 | 101.1 |
| August | 94.0 | 93.6 | 76.9 | 101.3 | 106.7 | 101.1 |
| September | 94.7 | 94.3 | 73.4 | 100.9 | 106.9 | 101.2 |
| October | 93.4 | 94.5 | 71.2 | 100.9 | 111.2 | 101.0 |
| November | 92.1 | 94.1 | 73.2 | 100.5 | 111.5 | 100.9 |
| December | 92.1 | 93.6 | 74.8 | 99.9 | 109.1 | 100.8 |
| 2024 | ||||||
| January | 91.4 | 94.5 | 82.4 | 100.4 | 103.4 | 101.1 |
| February | 90.9 | 95.9 | 80.7 | 100.3 | 102.8 | 101.0 |
| March | 91.2 | 95.5 | 81.4 | 100.1 | 101.8 | 101.1 |
| April | 87.9 | 95.3 | 82.1 | 99.9 | 100.9 | 101.0 |
| May | 87.4 | 95.2 | 82.7 | 99.7 | 100.9 | 101.2 |
| June | 86.5 | 95.4 | 83.2 | 99.3 | 104.9 | 101.0 |
| July | 84.9 | 93.4 | 83.9 | 99.2 | 107.1 | 101.0 |
| August | 85.3 | 94.1 | 82.7 | 98.7 | 106.9 | 101.1 |
| September | 82.9 | 94.0 | 82.8 | 98.5 | 107.5 | 100.9 |
| October | 83.8 | 91.8 | 82.8 | 97.8 | 103.5 | 100.9 |
| November | 83.3 | 92.2 | 80.6 | 98.1 | 106.0 | 100.7 |
| December | 81.8 | 91.6 | 76.8 | 98.0 | 104.1 | 101.1 |
| 2025 | ||||||
| January | 83.0 | 93.1 | 76.1 | 97.9 | 108.3 | 101.0 |
| February | 83.3 | 94.1 | 74.5 | 97.9 | 107.3 | 100.9 |
| March | 82.6 | 93.9 | 73.0 | 98.0 | 106.0 | 100.7 |
| April | 82.8 | 92.8 | 73.4 | 98.0 | 103.7 | 100.6 |
| May | 83.1 | 94.4 | 76.1 | 98.3 | 105.1 | 100.8 |
| June | 85.9 | 94.9 | 75.7 | 98.2 | 106.6 | 100.6 |
| July | 84.3 | 93.4 | 76.1 | 98.8 | 104.7 | 100.8 |
| August | 84.7 | 91.3 | 78.6 | 98.5 | 105.4 | 100.8 |
| September | 83.9 | 91.7 | 78.7 | 98.5 | 105.7 | 100.7 |
| October | 84.6 | 92.5 | 79.7 | 98.5 | 103.7 | 100.8 |
| November | 84.8 | 91.4 | 73.7 | 98.5 | 101.1 | 100.6 |
However, the mass availability of generative AI tools coincided with other concurrent economic events, such as rapid demographic shifts driven by increased immigration levels in Canada, labour market adjustments following the COVID-19 pandemic (e.g., a substantial drop in job vacancies across industries since mid-2022; Convery et al. 2024) and recent trade tensions with the United States beginning in early 2025 (Statistics Canada 2025). These events may have led to structural changes across Canadian industries. Consequently, the employment trends after November 2022 shown in Chart 2 reflect a confluence of economic factors beyond the mass availability of generative AI tools.
Conclusion
While there is considerable uncertainty regarding the extent to which AI could disrupt the labour market, especially in the domain of content creation, this article finds that the majority of jobs in the selected cultural industries—video game publishers and video game design and development services, publishing industries (except video game publishers), sound recording industries and musical groups and artists, and motion picture and video industries—have potentially high exposure to and low complementarity with AI. This suggests greater potential for AI to replace tasks within these occupations. However, some jobs in these industries are also more likely to be classified as high exposure and high complementarity, meaning that there is substantial potential for AI to augment jobs in cultural occupations rather than replace human labour. Although there is some evidence of declining employment in certain cultural industries since the mass availability of generative AI tools in late 2022, it is not clear whether the observed changes are solely driven by AI or instead reflect the cumulative effects of pre-existing trends combined with other competing economic forces.
The estimates presented in this article are largely based on the technological feasibility of replacing job tasks. Employers may not immediately replace human labour with AI even if it is technologically feasible to do so, because of financial, legal and institutional factors. Therefore, exposure to AI does not necessarily imply a risk of job loss. At the very least, it could imply a certain degree of job transformation as generative AI tools hold the potential to reshape some tasks and workflows within occupations. Given the uncertainties surrounding technological progress and implementation, the estimates presented in this article should be interpreted with caution when drawing any conclusions regarding the likelihood of AI replacing jobs in cultural industries.
References
Allen, R. and J. Watt. 2025. A profile of the video game industry in the Canadian provinces. Economic and Social Reports (August), Ottawa: Statistics Canada.
Allen, R., Macdonald, R., Lesica, J. and J. Watt. 2025. Cultural industries in Canada: Exploring firm dynamics and measurement. Economic and Social Reports (April), Ottawa: Statistics Canada.
Bryan, V., Sood, S. and C. Johnston. 2025. Analysis on artificial intelligence use by businesses in Canada, second quarter of 2025. Analysis in Brief. Ottawa: Statistics Canada.
Convery, E., Sood, S. and C. Johnston. 2024. Analysis of labour challenges in Canada, fourth quarter of 2024 (Analysis in Brief). Ottawa: Statistics Canada.
Daschko, M. W. and M. K. Allen. 2011. Classification Guide for the Canadian Framework for Culture Statistics 2011 (Canadian Framework for Culture Statistics). Ottawa: Statistics Canada.
Felten, E., Raj, M. and R. Seamans. 2021. Occupational, Industry, and Geographic Exposure to Artificial Intelligence: A Novel Dataset and its Potential Uses. Strategic Management Journal 42(12): 2195-2217.
Government of Canada. 2025. Guide on the use of generative artificial intelligence.
Mehdi, T. and M. Frenette. 2024. Exposure to artificial intelligence in Canadian jobs: Experimental estimates. Economic and Social Reports (September), Ottawa: Statistics Canada.
Mehdi, T. and M. Frenette. 2026. Canadian employment trends in the era of generative artificial intelligence: Early evidence. Economic and Social Reports (January), Ottawa: Statistics Canada.
Mehdi, T. and R. Morissette. 2024. Experimental Estimates of Potential Artificial Intelligence Occupational Exposure in Canada. Analytical Studies Branch Research Paper Series, Ottawa: Statistics Canada.
Pizzinelli, C., Panton, A. J., Tavares, M. M., Cazzaniga, M. and L. Li. 2023. Labor market exposure to AI: Cross-country differences and distributional implications. International Monetary Fund, Staff Discussion Notes no. 216.
Statistics Canada. 2025. Research to Insights: Canada’s Economy During Recent Canada-U.S. Trade Developments. Ottawa: Statistics Canada.
- Date modified: