
Economic and Social Reports
High Inflation in 2022 in Canada: Demand–pull or supply–push?
DOI: https://doi.org/10.25318/36280001202400500005-eng
Text begins
Abstract
This article examines whether the high inflation in 2022 in Canada was demand–pull or supply–push. It finds that at the aggregate level, Canada’s household final consumption expenditure grew at a much higher rate than gross domestic product from early 2021 to mid 2022 and that headline inflation accelerated during this period. These findings suggest that the aggregate excess demand for consumption and high inflation in 2022 were highly related. This article also decomposes inflation in the price of household final consumption into the contributions by detailed products consumed. It finds that both demand and supply shocks are important contributors, with increasing contributions from the supply side until the fourth quarter of 2022. This is consistent with findings by Chen and Tombe (2023) and Wang (2023). From 2021 to 2022, quarterly inflation in household final consumption expenditure averaged 5.99%, of which 54.0%, 23.7% and 22.3% are attributed to the product-specific supply shock, the product-specific demand shock and the aggregate demand shock, respectively. In terms of contributions by product, food and fuels and lubricants had much larger contributions than all other products. Also, pent-up demand following the easing of public health restrictions in early 2022 led to a growing demand and higher prices for travel and recreation-related services. In addition, paid rental fees for housing contributed significantly to the high inflation in all four quarters of 2022. These top contributors are mostly essential goods and services, implying that many households could not afford to keep up their consumption of essential goods and services during the high inflation period.
Author
Weimin Wang is with the Economic Analysis Division, Analytical Studies and Modelling Branch, at Statistics Canada.
Acknowledgments
The author would like to thank Professor Trevor Tombe from the University of Calgary, Fares Bounajm from the Bank of Canada, and Taylor Mitchell and Matthew MacDonald from Statistics Canada for their valuable comments and suggestions.
Introduction
Headline inflation in Canada reached a 40-year high in 2022, peaking at 8.1% in June.Note Rising prices reduced the purchasing power of people whose incomes were not keeping pace with inflation. Recent evidence suggests that the impact of inflation was being felt most by the lowest-income Canadians.Note
Understanding the sources of high inflation in 2022 has important policy implications. In general, there are two types of inflation that arise either because of a demand shock or because of an increase in input prices in an economy. The increase in aggregate demand may lead to the creation of demand–pull inflation, and the decrease in aggregate supply because of external factors may lead to the creation of cost–push or supply–push inflation.Note
The high inflation in 2022 in Canada, as well as in many other countries, may have been caused by both demand and supply factors. First, household final consumption expenditure (HFCE) in Canada had rebounded strongly for over a year, since the second quarter of 2021, from the large decline in the first year of the COVID-19 pandemic. At the same time, inflation in Canada started to climb. Second, the interruption of global and local supply chains caused by the pandemic, the war in Ukraine and local climate factors led to large increases in the prices of food, energy and materials; therefore, production costs rose. Results from the Canadian Survey on Business Conditions in 2021 and 2022Note showed that businesses in Canada expected to face challenges related to the rising costs of inputs and supply chain issues and that these challenges would continue. However, it is not yet clear to what extent the inflation in Canada in 2022 was driven by demand factors and to what extent it was driven by supply factors.
Chen and Tombe (2023) quantified the contributions of demand- versus supply-side drivers of recent high inflation in Canada and found that both factors were important contributors, with increasing contributions from the supply side. Their approach is regression-based. Specifically, a set of sign restrictions in a vector autoregression model (VAR) was used to identify the existence and direction of demand and supply shocks. A demand shock can be identified when the sign of the error term for the price movement of a product and the sign of the error term for the quantity movement of the product are the same. A supply shock can be identified when these two signs are different.
This article first defines aggregate excess demand from the household consumption perspective and then examines how this excess demand at the aggregate level and the high inflation in 2022 were related. Next, it decomposes the aggregate inflation in the price of household consumption into the contributions by the goods and services consumed by households and then identifies demand and supply factors based on the same sign restrictions as in the Chen and Tombe (2023) study. The decomposition method in this article is an extension of the Tang and Wang (2004) study based on growth accounting instead of regression.Note A growth-accounting-based decomposition is easy to implement, while a regression-based approach may not be accurate as the sign of an error term may be subject to model specifications.Note
This article finds that an excess household consumption demand in Canada existed from early 2021 to mid-2022 and that headline inflation was accelerating during this period. Headline inflation started to drop when the excess demand disappeared in late 2022. This article also finds that both demand and supply factors were important contributors to the inflation in HFCE, with increasing importance of supply factors up to the fourth quarter of 2022. In terms of contributions by product, food and fuels and lubricants had a much larger contribution than all other products to high inflation in 2022. Also, the reopening of the economy in early 2022 led to a growing demand for travel and recreation-related services that was pent up during the pandemic and drove up their prices. In addition, paid rental fees for housing contributed significantly to high inflation in all four quarters of 2022.
Headline inflation and excess household consumption demand
Consumers’ cost of living depends on the prices of the goods and services they consume and the share of each in the household budget. Headline inflation—or the percentage change in the Consumer Price Index (CPI)—measures the change in the average consumer’s purchase power over a certain period.
HFCENote is the market value of all goods and services purchased by households and can be used as an indicator of domestic household demand for consumption. Gross domestic product (GDP) is the market value of all goods and services produced by an economy and can be used as an indicator of the aggregate domestic supply of goods and services.
Headline inflation is linked to either the excess demand for consumption or the excess supply in an economy. The question is, how does one know whether an economy is running with excess demand or excess supply? To answer the question, the growth rate of GDP is compared with the growth rate of HFCE, then both are examined to see how they link to the headline inflation rate. The quarterly excess household demand for consumption (EHDC) is defined as the difference between the quarterly year-to-year growth rate of HFCE and the quarterly year-to-year growth rate of GDP. A positive EHDC means higher growth of HFCE than of GDP. Continuous higher growth of household consumption spending than growth of GDP gives upward pressure on domestic consumption prices, which may end up with higher inflation, depending on global demand and supply conditions.
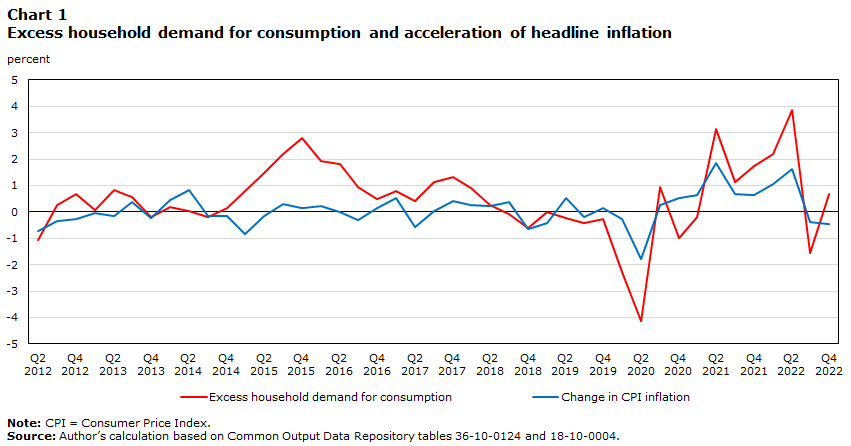
Chart 1 presents the quarterly EHDC and quarterly year-to-year change in headline inflation in Canada from the second quarter of 2012 to the fourth quarter of 2022. The chart shows that the recent high and fast increase in headline inflation was largely related to the EHDC. Headline inflation remained stable over the 2012-to-2019 period, although there was a large positive EHDC in late 2015 and early 2016. During this period, the excess household demand for final consumption was accompanied by less investment spending,Note more withdrawal of inventories and fewer exports.Note Imports in late 2015 and early 2016 were little changed. These findings suggest that the excess demand was not widespread in late 2015 and early 2016 and did not push up the overall price level.
Data table for Chart 1
| Excess household demand for consumption | Change in CPI inflation | |
|---|---|---|
| percent | ||
| 2012 | ||
| Q2 | -1.05 | -0.74 |
| Q3 | 0.28 | -0.36 |
| Q4 | 0.68 | -0.28 |
| 2013 | ||
| Q1 | 0.06 | -0.03 |
| Q2 | 0.84 | -0.14 |
| Q3 | 0.57 | 0.38 |
| Q4 | -0.20 | -0.22 |
| 2014 | ||
| Q1 | 0.20 | 0.45 |
| Q2 | 0.04 | 0.82 |
| Q3 | -0.21 | -0.14 |
| Q4 | 0.17 | -0.16 |
| 2015 | ||
| Q1 | 0.78 | -0.84 |
| Q2 | 1.47 | -0.17 |
| Q3 | 2.18 | 0.29 |
| Q4 | 2.79 | 0.14 |
| 2016 | ||
| Q1 | 1.93 | 0.21 |
| Q2 | 1.83 | 0.01 |
| Q3 | 0.93 | -0.32 |
| Q4 | 0.47 | 0.16 |
| 2017 | ||
| Q1 | 0.81 | 0.51 |
| Q2 | 0.40 | -0.58 |
| Q3 | 1.13 | 0.05 |
| Q4 | 1.32 | 0.41 |
| 2018 | ||
| Q1 | 0.92 | 0.26 |
| Q2 | 0.25 | 0.24 |
| Q3 | -0.07 | 0.37 |
| Q4 | -0.62 | -0.63 |
| 2019 | ||
| Q1 | 0.01 | -0.42 |
| Q2 | -0.24 | 0.53 |
| Q3 | -0.42 | -0.20 |
| Q4 | -0.25 | 0.15 |
| 2020 | ||
| Q1 | -2.29 | -0.28 |
| Q2 | -4.12 | -1.77 |
| Q3 | 0.93 | 0.24 |
| Q4 | -0.99 | 0.51 |
| 2021 | ||
| Q1 | -0.19 | 0.65 |
| Q2 | 3.14 | 1.87 |
| Q3 | 1.12 | 0.69 |
| Q4 | 1.73 | 0.64 |
| 2022 | ||
| Q1 | 2.19 | 1.05 |
| Q2 | 3.87 | 1.61 |
| Q3 | -1.54 | -0.37 |
| Q4 | 0.67 | -0.46 |
|
Note: CPI = Consumer Price Index. Source: Author’s calculation based on Common Output Data Repository tables 36-10-0124 and 18-10-0004. |
||
In the second quarter of 2020, HFCE and GDP dropped by 16.3% and 12.2%, respectively, because of pandemic-related restrictions. This negative EHDC led to a 1.8-percentage-point drop in the headline inflation rate at that time. HFCE in Canada began to recover strongly starting in the second quarter of 2021, when it grew by 15.3%, more than 3 percentage points higher than GDP growth at the same time. The EHDC continued to be a large positive until the second quarter of 2022. During this period, the total of investment in capital and inventories and exports rose by about 8.9%, suggesting that the excess demand at the time was widespread. Imports rose by 10.8% during the same period to meet the broad excess demand. As a result, these inflationary pressures led to a rise in headline inflation from 3.3% in the second quarter of 2021 to 7.3% in the second quarter of 2022. The headline inflation rate dropped to 6.5% in the fourth quarter of 2022, and the EHDC disappeared during the same period. The co-movement of the EHDC and changes in the headline inflation rate since the pandemic suggest that the EHDC is an important source of high inflation in 2022 in Canada. Excess demand can be driven by a positive demand shock or a negative supply shock. A robust growth in household consumption expenditure and an increase in prices facing households since 2021 suggest an aggregate demand shock during the period. The next section will quantify the importance of the aggregate demand shock, as well as product-specific demand and supply shocks, to inflation.
Decomposition of household final consumption expenditure inflation: Product-specific demand and supply shocks
The existence of excess demand at the aggregate level does not necessarily imply that there is excess demand for each good or service consumed. Shocks facing consumers are often product specific. The war in Ukraine has affected the supply of food and energy and driven up the prices of these products. As well, the reopening of the economy in early 2022 stimulated the demand for travel and recreation-related services and drove up their prices. These specific supply or demand shocks may also be important sources of high inflation in 2022.
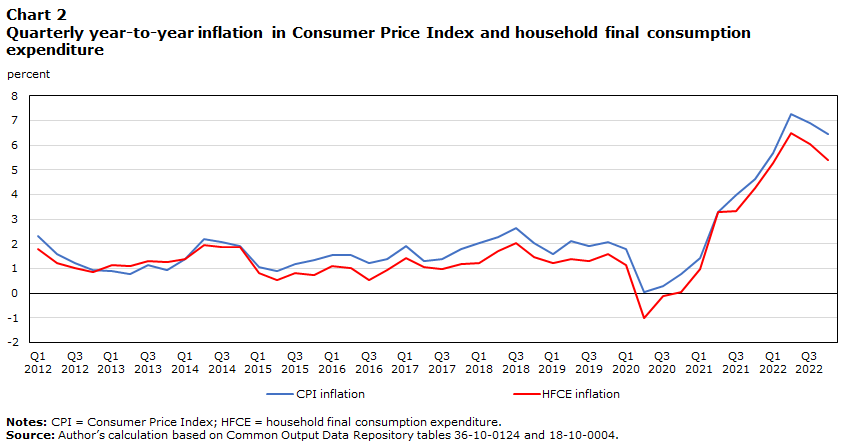
Price and quantity information are needed to examine the impact of specific supply or demand shocks. For the purpose of this article, the focus is on HFCE inflation, because price and quantity information are steadily available when using HFCE data. More importantly, HFCE inflation also measures the changes in purchasing power of households for all goods and services they consumed and is therefore a good indicator of headline inflation. As shown in Chart 2, CPI inflation and HFCE inflation move together closely.
Data table for Chart 2
| CPI inflation | HFCE inflation | |
|---|---|---|
| percent | ||
| 2012 | ||
| Q1 | 2.31 | 1.78 |
| Q2 | 1.57 | 1.22 |
| Q3 | 1.21 | 1.03 |
| Q4 | 0.94 | 0.85 |
| 2013 | ||
| Q1 | 0.90 | 1.14 |
| Q2 | 0.76 | 1.09 |
| Q3 | 1.14 | 1.30 |
| Q4 | 0.93 | 1.24 |
| 2014 | ||
| Q1 | 1.38 | 1.38 |
| Q2 | 2.20 | 1.95 |
| Q3 | 2.06 | 1.87 |
| Q4 | 1.91 | 1.86 |
| 2015 | ||
| Q1 | 1.07 | 0.79 |
| Q2 | 0.90 | 0.53 |
| Q3 | 1.19 | 0.80 |
| Q4 | 1.32 | 0.72 |
| 2016 | ||
| Q1 | 1.53 | 1.09 |
| Q2 | 1.54 | 1.01 |
| Q3 | 1.22 | 0.54 |
| Q4 | 1.38 | 0.95 |
| 2017 | ||
| Q1 | 1.89 | 1.40 |
| Q2 | 1.31 | 1.05 |
| Q3 | 1.36 | 0.97 |
| Q4 | 1.77 | 1.19 |
| 2018 | ||
| Q1 | 2.04 | 1.20 |
| Q2 | 2.27 | 1.72 |
| Q3 | 2.65 | 2.01 |
| Q4 | 2.02 | 1.47 |
| 2019 | ||
| Q1 | 1.60 | 1.21 |
| Q2 | 2.13 | 1.39 |
| Q3 | 1.92 | 1.28 |
| Q4 | 2.07 | 1.57 |
| 2020 | ||
| Q1 | 1.79 | 1.12 |
| Q2 | 0.02 | -1.02 |
| Q3 | 0.27 | -0.14 |
| Q4 | 0.78 | 0.05 |
| 2021 | ||
| Q1 | 1.43 | 0.96 |
| Q2 | 3.29 | 3.28 |
| Q3 | 3.98 | 3.32 |
| Q4 | 4.62 | 4.26 |
| 2022 | ||
| Q1 | 5.67 | 5.28 |
| Q2 | 7.28 | 6.49 |
| Q3 | 6.91 | 6.03 |
| Q4 | 6.45 | 5.41 |
|
Notes: CPI = Consumer Price Index; HFCE = household final consumption expenditure. Source: Author’s calculation based on Common Output Data Repository tables 36-10-0124 and 18-10-0004. |
||
As an alternative measure of inflation in addition to headline inflation, HFCE inflation provides information on both nominal and real measures for each consumed product, allowing supply or demand shocks specific to certain products to be identified. Economic theory states that, in a competitive market with an upward-slope supply curve and a downward-slope demand curve, a demand shock will lead to changes in the price and the quantity of a certain product in the same direction and a supply shock will lead to the opposite movements of its price and quantity, given the total income level.
For identifying demand or supply shocks, the quarterly year-to-year HFCE inflation rate is decomposed into the weighted sum of each product’s price growth, relative quantity growth and the interaction of these two:
where is the nominal share of each product in total spending in the same quarter of the previous year, is the price index of HFCE, is the price index of spending for each product, and is the real spending of each product relative to the total real spending.Note The growth of relative real spending measures the quantity growth of a particular product net of the aggregate quantity growth, which is equivalent to the adjusted quantity change of each product for the income effect.
Decomposition (1) can then be used for identifying product-specific demand and supply shocks. When spending on a product grows at a similar pace as aggregate spending, the price change of this product is the income effect, driven by an increase in aggregate demand.Note In practice, some variations of the income effect across products are allowed. In other words, when the relative quantity growth for a product is less than 2% and greater than -2%, the price change of this product is classified as the impact by aggregate demand or supply shock, not by product-specific demand or supply shock.Note When the relative quantity growth is more than 2% or less than -2%, the price change of the product will be classified as the impact by a product-specific supply shock if the interaction term is negative or by a product-specific demand shock if the interaction term is positive. Once all products are classified into three groups (product-specific supply shock, product-specific demand shock and aggregate demand or supply shock), the contribution of each group can then be measured based on the bottom-up estimate of HFCE inflation:
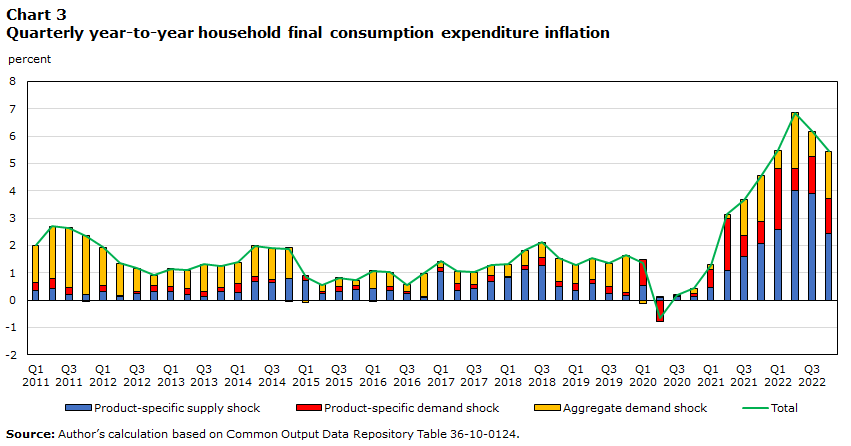
The decomposition results are presented in Chart 3. As shown, the contribution of the product-specific supply shock to HFCE inflation increased largely since the second quarter of 2021, when the high inflation period started. The contribution of the product-specific supply shock increased from 34.5% of HFCE inflation in the second quarter of 2021 to 63.3% in the third quarter of 2022. The momentum stopped in the fourth quarter of 2022, and the contribution declined to 44.7%.
Data table for Chart 3
| Total | Product-specific supply shock | Product-specific demand shock | Aggregate demand shock | |
|---|---|---|---|---|
| percent | ||||
| 2011 | ||||
| Q1 | 2.01 | 0.37 | 0.26 | 1.38 |
| Q2 | 2.70 | 0.44 | 0.35 | 1.91 |
| Q3 | 2.66 | 0.22 | 0.23 | 2.21 |
| Q4 | 2.35 | 0.21 | -0.02 | 2.16 |
| 2012 | ||||
| Q1 | 1.94 | 0.30 | 0.22 | 1.42 |
| Q2 | 1.34 | 0.13 | 0.04 | 1.17 |
| Q3 | 1.17 | 0.26 | 0.08 | 0.84 |
| Q4 | 0.91 | 0.32 | 0.20 | 0.39 |
| 2013 | ||||
| Q1 | 1.15 | 0.31 | 0.18 | 0.66 |
| Q2 | 1.09 | 0.20 | 0.22 | 0.67 |
| Q3 | 1.32 | 0.15 | 0.18 | 0.99 |
| Q4 | 1.26 | 0.31 | 0.15 | 0.81 |
| 2014 | ||||
| Q1 | 1.39 | 0.27 | 0.32 | 0.80 |
| Q2 | 1.98 | 0.68 | 0.19 | 1.12 |
| Q3 | 1.90 | 0.65 | 0.12 | 1.13 |
| Q4 | 1.88 | 0.80 | -0.06 | 1.14 |
| 2015 | ||||
| Q1 | 0.83 | 0.71 | 0.20 | -0.09 |
| Q2 | 0.56 | 0.25 | 0.06 | 0.24 |
| Q3 | 0.82 | 0.32 | 0.19 | 0.31 |
| Q4 | 0.72 | 0.38 | 0.14 | 0.20 |
| 2016 | ||||
| Q1 | 1.07 | 0.42 | -0.03 | 0.68 |
| Q2 | 1.03 | 0.36 | 0.14 | 0.52 |
| Q3 | 0.57 | 0.25 | 0.09 | 0.23 |
| Q4 | 0.98 | 0.10 | 0.03 | 0.85 |
| 2017 | ||||
| Q1 | 1.42 | 1.03 | 0.15 | 0.23 |
| Q2 | 1.06 | 0.35 | 0.26 | 0.46 |
| Q3 | 1.01 | 0.44 | 0.14 | 0.43 |
| Q4 | 1.28 | 0.70 | 0.19 | 0.39 |
| 2018 | ||||
| Q1 | 1.32 | 0.82 | 0.06 | 0.44 |
| Q2 | 1.83 | 1.12 | 0.13 | 0.58 |
| Q3 | 2.13 | 1.28 | 0.30 | 0.55 |
| Q4 | 1.54 | 0.49 | 0.21 | 0.84 |
| 2019 | ||||
| Q1 | 1.29 | 0.35 | 0.25 | 0.69 |
| Q2 | 1.52 | 0.62 | 0.13 | 0.78 |
| Q3 | 1.35 | 0.25 | 0.26 | 0.84 |
| Q4 | 1.63 | 0.16 | 0.10 | 1.37 |
| 2020 | ||||
| Q1 | 1.36 | 0.52 | 0.96 | -0.12 |
| Q2 | -0.67 | 0.09 | -0.79 | 0.03 |
| Q3 | 0.19 | 0.13 | 0.06 | 0.01 |
| Q4 | 0.43 | 0.14 | 0.12 | 0.17 |
| 2021 | ||||
| Q1 | 1.30 | 0.47 | 0.64 | 0.18 |
| Q2 | 3.15 | 1.09 | 1.90 | 0.16 |
| Q3 | 3.67 | 1.60 | 0.77 | 1.30 |
| Q4 | 4.55 | 2.06 | 0.82 | 1.67 |
| 2022 | ||||
| Q1 | 5.48 | 2.59 | 2.24 | 0.65 |
| Q2 | 6.85 | 4.00 | 0.83 | 2.02 |
| Q3 | 6.17 | 3.90 | 1.34 | 0.93 |
| Q4 | 5.45 | 2.44 | 1.28 | 1.73 |
| Source: Author’s calculation based on Common Output Data Repository Table 36-10-0124. | ||||
Table 1 shows the HFCE inflation and its sources by demand and supply factor for the four quarters of 2022. The impact of demand and supply factors is well balanced, with an increase in the contribution of the supply shock until the fourth quarter of 2022. This finding is consistent with that in the Chen and Tombe (2023) study.
| First quarter of 2022 | Second quarter of 2022 | Third quarter of 2022 | Fourth quarter of 2022 | |
|---|---|---|---|---|
| percent | ||||
| HFCE inflation | 5.48 | 6.85 | 6.17 | 5.45 |
| percentage points | ||||
| Contribution | ||||
| Product-specific supply shock | 2.59 | 4.00 | 3.90 | 2.44 |
| Product-specific demand shock | 2.24 | 0.83 | 1.34 | 1.28 |
| Aggregate demand shock | 0.65 | 2.02 | 0.93 | 1.73 |
|
Note: HFCE = household final consumption expenditure. Source: Author’s calculation based on Common Output Data Repository Table 36-10-0124. |
||||
Tables 2 to 4 present the top three contributors to the product-specific supply shock, the product-specific demand shock and the aggregate demand shock, respectively. Several findings are noteworthy. First, food and fuels and lubricants have a much larger contribution than the rest of the consumption products for all four quarters. The contribution of food to HFCE inflation averaged 1.02 percentage points for the four quarters, and that of fuels and lubricants averaged 1.14 percentage points. Second, real food consumption declined significantly in all four quarters, implying that the price increase in food consumption was driven by supply factors during the period. By contrast, real consumption of fuels and lubricants varied significantly from highly positive to highly negative, suggesting that the price increase in fuels and lubricants was driven by supply factors in one period and by demand factors in another period.Note Third, food and non-alcoholic beverage services and accommodation services were in the top three product-specific demand-driven contributors from the second quarter to the fourth quarter of 2022, reflecting the strong recovery of demand for these services after the easing of public health measures in early 2022. The demand for such travel and recreation-related services was pent up during the pandemic. Fourth, furniture and furnishings were among the top three contributors to the supply shock in all four quarters. Fifth, paid rental fees for housing were also a large contributor in all four quarters, reflecting a large and continuous increase in shelter costs.
| First quarter of 2022 | Second quarter of 2022 | Third quarter of 2022 | Fourth quarter of 2022 | |
|---|---|---|---|---|
| percentage points | ||||
| Food | 0.88 | 1.09 | 1.06 | 1.05 |
| New trucks, vans and sport utility vehicles | 0.28 | Note ...: not applicable | Note ...: not applicable | Note ...: not applicable |
| Furniture and furnishings | 0.22 | 0.34 | 0.28 | 0.20 |
| Fuels and lubricants | Note ...: not applicable | Note ...: not applicable | 1.02 | Note ...: not applicable |
| Paid rental fees for housing | Note ...: not applicable | 0.31 | Note ...: not applicable | Note ...: not applicable |
| Non-alcoholic beverages | Note ...: not applicable | Note ...: not applicable | Note ...: not applicable | 0.17 |
|
... not applicable Source: Author’s calculation based on Common Output Data Repository Table 36-10-0124. |
||||
| First quarter of 2022 | Second quarter of 2022 | Third quarter of 2022 | Fourth quarter of 2022 | |
|---|---|---|---|---|
| percentage points | ||||
| Fuels and lubricants | 1.20 | Note ...: not applicable | Note ...: not applicable | Note ...: not applicable |
| Food and non-alcoholic beverage services | 0.23 | 0.33 | 0.43 | 0.44 |
| Accommodation services | Note ...: not applicable | 0.24 | 0.27 | 0.16 |
| Gas | Note ...: not applicable | Note ...: not applicable | Note ...: not applicable | 0.18 |
| Used motor vehicles | 0.15 | Note ...: not applicable | Note ...: not applicable | Note ...: not applicable |
| Games of chance | Note ...: not applicable | 0.06 | 0.11 | Note ...: not applicable |
|
... not applicable Source: Author’s calculation based on Common Output Data Repository Table 36-10-0124. |
||||
| First quarter of 2022 | Second quarter of 2022 | Third quarter of 2022 | Fourth quarter of 2022 | |
|---|---|---|---|---|
| percentage points | ||||
| Paid rental fees for housing | 0.27 | Note ...: not applicable | 0.31 | 0.35 |
| Fuels and lubricants | Note ...: not applicable | 1.76 | Note ...: not applicable | 0.60 |
| New passenger cars | 0.12 | Note ...: not applicable | Note ...: not applicable | Note ...: not applicable |
| Other appliances, articles and products for personal care | Note ...: not applicable | 0.10 | Note ...: not applicable | Note ...: not applicable |
| Out-patient services | Note ...: not applicable | Note ...: not applicable | 0.10 | Note ...: not applicable |
| Spare parts and accessories for vehicles | 0.11 | Note ...: not applicable | Note ...: not applicable | Note ...: not applicable |
| Other actual financial charges | Note ...: not applicable | 0.08 | 0.08 | Note ...: not applicable |
| New trucks, vans and sport utility vehicles | Note ...: not applicable | Note ...: not applicable | Note ...: not applicable | 0.18 |
|
... not applicable Source: Author’s calculation based on Common Output Data Repository Table 36-10-0124. |
||||
On average, the year-to-year quarterly HFCE inflation was 5.99% from 2021 to 2022, of which 54.0% came from the product-specific supply shock, 23.7% came from the product-specific demand shock and 22.3% came from the aggregate demand shock (see Table 5). These findings are consistent with those of the Wang (2023) study, which showed that import prices accounted for more than 50% of final domestic demand inflation by the end of 2022, because rises in import prices were driven by various factors or disruptions on the supply side.
| Quarterly average, 2021/2022 | |
|---|---|
| percentage | |
| HFCE inflation | 6.0 |
| Contribution | |
| Product-specific supply shock | 54.0 |
| Product-specific demand shock | 23.7 |
| Aggregate demand shock | 22.3 |
| Top 10 contributors | |
| Fuels and lubricants | 19.1 |
| New trucks, vans and sport utility vehicles | 4.0 |
| Food | 17.0 |
| Accommodation services | 3.3 |
| Food and non-alcoholic beverage services | 6.0 |
| Gas | 3.2 |
| Paid rental fees for housing | 5.2 |
| Spare parts and accessories for vehicles | 2.4 |
| Furniture and furnishings | 4.4 |
| Non-alcoholic beverages | 2.3 |
|
Note: HFCE = household final consumption expenditure. Source: Author’s calculation based on Common Output Data Repository Table 36-10-0124. |
|
Also, 10 out of 96 household final consumption products contributed 66.7% of the quarterly HFCE inflation from 2021 to 2022. These top 10 contributors are mostly essential goods and services for households, such as energy, food, shelter and travel, implying that many households could not afford to keep up their consumption of essential goods and services during the high inflation period.
Concluding remarks
This article finds that the sources of high inflation in 2022 in Canada are quite broad-based. First, the economy started to recover one year after the onset of the COVID-19 pandemic. Household pent-up demand for goods and services during the first year of the pandemic also started to recover and grew at a much faster rate than GDP. The EHDCcontinued for more than a year and drove up the aggregate price level during this period. Second, price changes are highly disproportionate across goods and services. Food and energy are the two consumption products that contributed the most to high inflation in 2022. Food price increases were driven by supply shocks such as the war in Ukraine and local climate change, and energy price increases were driven by both demand and supply shocks. Higher prices in travel and recreation-related services were driven by a sharp increase in demand for these services after public health restrictions eased.
The prices of some goods and services, such as paid rental fees for housing, were also affected by aggregate demand shocks. Considering the impacts of product-specific supply shocks, product-specific demand shocks and aggregate demand shock, the article finds that the impact of demand and supply on inflation was well balanced, although the impact of supply was increasing until the fourth quarter of 2022. The large contribution from the supply side is consistent with the finding in the Wang (2023) study, where import prices contributed more than 50% to inflation in final domestic demand by the end of 2022. There are two reasons for the large contribution of import prices. One is that demand for consumption and investment grew at a higher rate than GDP, such that more imports were purchased to satisfy the aggregate demand shock. The other is that import prices increased largely because of various external factors, such as the appreciation of U.S. currency, the rise in commodity prices, changes in global geopolitical risks and economic conditions, and weather events.
References
Chen, Y., and T. Tombe. (2023). The Rise (and Fall?) of Inflation in Canada: A Detailed Analysis of Its Post-Pandemic Experience. Canadian Public Policy, volume 49 issue 2, pp. 197-217.
Diewert, W. E. (2010). On the Tang and Wang Decomposition of Labour Productivity Growth into Sectoral Effects, chapter 4, pp. 67-76 in Price and Productivity Measurement: volume 6 – Index Number Theory, edited by W.E. Diewert, B.M. Balk, D. Fixler, K.J. Fox and A.O. Nakamura. Trafford Press.
Dumagan, J. C. (2013). A Generalized Exactly Additive Decomposition of Aggregate Labour Productivity Growth, The Review of Income and Wealth, 59 (1), pp. 157-68.
Statistics Canada. (2023a, January 17). Consumer Price Index: Annual review, 2022. The Daily.
Statistics Canada. (2022a, November 25). Canadian Survey on Business Conditions, fourth quarter 2022. The Daily.
Statistics Canada. (2022b, August 30). Canadian Survey on Business Conditions, third quarter 2022. The Daily.
Statistics Canada. (2022c, May 30). Canadian Survey on Business Conditions, second quarter 2022. The Daily.
Statistics Canada. (2022d, February 25). Canadian Survey on Business Conditions, first quarter 2022. The Daily.
Statistics Canada. (2021a, November 26). Canadian Survey on Business Conditions, fourth quarter 2021. The Daily.
Statistics Canada. (2021b, August 27). Canadian Survey on Business Conditions, third quarter 2021. The Daily.
Statistics Canada. (2021c, May 28). Canadian Survey on Business Conditions, second quarter 2021. The Daily.
Statistics Canada. (2021d, March 5). Canadian Survey on Business Conditions, first quarter 2021. The Daily.
Tang, J., and W. Wang. (2015). Economic Growth in Canada and the United States: Supply-Push or Demand-Pull?, The Review of Income and Wealth, 61(4), pp. 773-98.
Tang, J., and W. Wang. (2004). Sources of aggregate labour productivity growth in Canada and the United States, The Canadian Journal of Economics, 37(2), pp. 421-44.
Uppal, S. (2023). Rising Prices and the Impact on the Most Financially Vulnerable: A Profile of those in the Bottom Family Income Quintile. (Insights on Canadian Society) Statistics Canada.
Wang, W. (2023). Import Prices and Inflation in Canada. Economic and Social Reports, 3(6). Statistics Canada.
- Date modified: