
Insights on Canadian Society
Rising prices and the impact on the most financially vulnerable: A profile of those in the bottom family income quintile

Text begins
Acknowlegement
This study was funded by the Financial Consumer Agency of Canada.
Start of text boxOverview of the study
This study uses the 2022 Portrait of Canadian Society Survey to examine the impact of rising inflation on the lowest income Canadians. Using multiple pre-pandemic data sources, the study takes a closer look at people living in the bottom family income quintile, examining their family income, debt and assets levels, as well as some indicators of economic hardship.
- In April 2022, more than six in ten (63%) Canadians in the lowest household income quintile reported being very concerned about their ability to meet everyday expenses. This was 1.5 times higher than those in the third quintile (42%) and over 3 times higher than those in the top quintile (19%).
- About one in five (19%) individuals in the bottom household income quintile reported that they had to often borrow money from friends or relatives or take on additional debt to meet day-to-day expenses. This compares to less than one in ten (8%) among people in the other income quintiles.
- Living in the bottom income quintile families was more common among women, the young and old, lone parents, those who were separated, divorced, widowed, those with lower levels of education, Indigenous people and recent immigrants.
- In 2019, the median after-tax income for economic families and unattached individuals in the bottom income quintile stood at $21,000, much lower than the median for all Canadians of $62,900.
- For the majority of families in the bottom income quintile (62%), the major source of income was government transfers. Another 27% had wages and salaries as the major source of income and 7% of families had income from self-employment. In comparison, for all other quintiles, the major source of income was wages and salaries (68%), with government transfers representing 9%.
- Families in the bottom income quintile are additionally vulnerable due to their low net worths and high debt-to-asset ratios. In 2019, the median net worth of families in the bottom quintile was $20,000, compared to the overall median of $329,900 and the median debt-to-asset ratio was 0.32 compared to 0.24.
Introduction
Following an initial decline in consumer prices within the first two months of the pandemic, the Canadian economy has experienced a period of rising inflation. In March 2021, the year-over-year rate of consumer inflation reached 2.2%, doubling to 4.4% by September 2021. Prices continued to rise and in June 2022, the annual rate of inflation was up to 8.1% - the largest yearly change in 40 years. By December 2022, the inflation rate cooled down to 6.3%. This was largely due to a decrease in the price of gasoline. The annual increase in the price of groceries rose to 11.0%.
Both domestic and international factors have been cited as contributing to the high inflation rate.Note Domestically, excess demand has pushed inflation higher. On the international front, global recovery from the pandemic has led to prolonged supply shortages, which has been compounded by the geopolitical impact of the conflict in Ukraine.
While prices of most goods and services have increased, wages have also been rising. However, on average, consumer prices in the past year have increased at a pace faster than wages. For example, average hourly wages of employees increased by 5.1% in the 12 months to December 2022Note compared to an increase of 6.3% in the consumer price index.Note Canadians have been feeling the effect of the increase on the cost of living. For example, a Statistics Canada survey conducted in April 2022 found that nearly three in four Canadians reported that rising prices are affecting their ability to meet day-to-day expenses such as transportation, housing, food and clothing.Note
The adverse effect of rising prices is not felt equally among different demographic groups. Some groups such as those on fixed incomeNote , and those in the bottom income quintile are likely to be more affected by rising inflation. Inflation has been dubbed as the “cruelest tax” harming the poorer sections of a society more heavily.Note It affects poorer people more than the richer as the latter spend a lower proportion of their income on essentials, and hence have more maneuverability and more ways to protect themselves.
It is well documented that low-income families spend a higher share of their budgets on necessities such as food and shelter, compared to families with higher incomes. For example, in 2019, Canadian households in the bottom income quintile devoted more than half (51%) of their expenditures to food (15%), shelter (32%) and clothing and accessories (4%) (Chart 1).Note This proportion was lower for the remaining quintiles, with the highest income quintile spending 42% on the same items.Note ,Note In fact, if the spending could be adjusted for quantity and quality of goods and services purchased, the gap between income quintiles in the proportion of income spent on shelter, food and clothing would be even larger. Families with higher incomes tend to buy more and better-quality products and services compared to those with lower incomes.

Data table for Chart 1
| Income quintile | |||||
|---|---|---|---|---|---|
| Bottom | Second | Third | Fourth | Top | |
| percent | |||||
| Total spending on shelter, food and clothing | 51.2 | 48.1 | 44.6 | 43.1 | 41.7 |
| Shelter | 31.6 | 27.8 | 26.1 | 25.3 | 25.6 |
| Food | 15.1 | 15.2 | 14.5 | 13.7 | 11.6 |
| Clothing | 4.4 | 5.1 | 4.1 | 4.1 | 4.5 |
| Source: Statistics Canada, Survey of Household Spending, 2019. | |||||
High inflation means that low-income Canadians may have more difficulty maintaining their existing standard of living compared to higher income households. This may cause families with low incomes to cut back more than usual on essentials like healthy food.Note To determine the impact of rising prices on the lowest income Canadians, this study uses the 2022 Portrait of Canadian Society Survey to examine the characteristics, experiences and perspectives of individuals in the bottom household income quintile. This information helps determine the extent to which the impact of inflation varies accross income quintiles.Note ,Note For more detailed information on the calculation of income quintiles, please see Data sources, methods and definitions.
The study goes on to provide a profile of those in the bottom income quintile and their family income levels, debt and assets levels, and indicators of economic hardship. Multiple data sources are used, including the 2019 Canadian Income Survey, 2019 Survey of Financial Security, 2019 Survey of Household Spending, 2018 Canadian Housing Survey and 2017 Canadian Survey of Disability. While these data sources predate the pandemic, they provide a more accurate understanding of the typical situation of those in the bottom income quintile by limiting the effect of temporary relief programs provided by the government during the pandemic.Note Depending on data availability, estimates are provided by various personal characteristics and population groups.
More than six in ten Canadians living in the bottom income quintile are very concerned about their ability to meet day-to-day expenses
In 2022, 44% of Canadians aged 15 years and older reported being very concerned with the impact of rising prices on their ability to meet day-to-day expenses over the next six months. As expected, those in the bottom household income quintile were most concerned. In particular, more than six in ten (63%) in the lowest income quintile reported being very concerned about their ability to meet everyday expenses (Table 1). This was 1.5 times higher than among those in the third quintile (42%) and over 3 times higher than among those in the top income quintile (19%).
| Household income quintile | |||||
|---|---|---|---|---|---|
| Bottom | Second | Third | Fourth | Top | |
| percentage | |||||
| Very concerned with the impact that rising prices may have on ability to meet day-to-day expenses over the next 6 months | 63.0 | 57.6 | 41.7Note * | 37.1Note * | 18.7Note * |
| Due to rising food prices, very likely to obtain food or meals from a community organization over the next 6 months | 17.0 | 7.9 | 4.8Note * | 4.9 | 1.2Note * |
| Very concerned with ability to afford housing or rent because of rising housing prices | 46.4 | 34.0 | 35.5 | 18.7Note * | 16.8Note * |
| Very concerned with rising gasoline prices | 73.3 | 75.0 | 74.6 | 67.2 | 47.0Note * |
| In the past 6 months, due to rising prices, often had to borrow money to meet day-to-day expenses | 19.2 | 14.9 | 6.6Note * | 7.0Note * | 2.1Note * |
| Most of the days extremely stressful due to financial issues | 22.9 | 17.6 | 4.9Note * | 8.4Note * | 5.8Note * |
|
|||||
Along with the affordability of everyday expenses, Canadians are also concerned with rising home and rental prices, with 30% being very concerned with their ability to afford housing or rent because of the rising cost of housing. Again, the lowest income Canadians are disproportionally concerned about this situation. Almost half (46%) of individuals in the bottom income quintile expressed this concern, compared to 17% of those in the top quintile.
When it came to concerns with rising gasoline prices, there was not much difference across the bottom three quintiles, with the proportion of those who were very concerned being around 74%. However, it was notably lower for the top quintile at 47%.
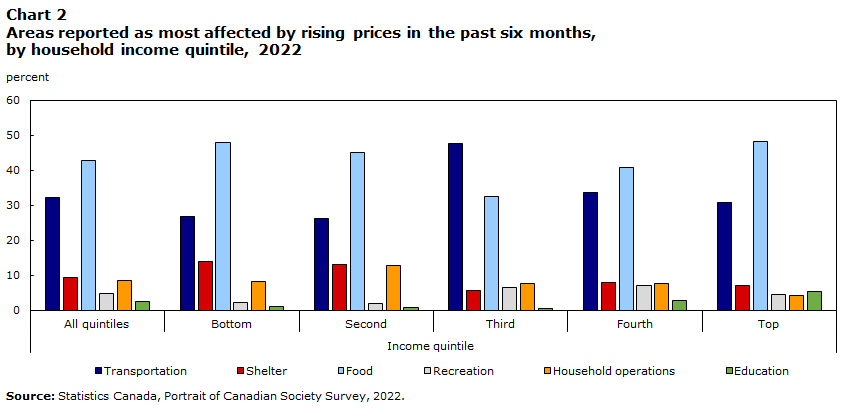
When asked about the area where they were most affected by rising prices, food topped the list at 43%, followed by transportation (32%), shelter (9%) and household operations (8%) (Chart 2). This same ranking was generally seen for all income quintiles, except the middle quintile. For these Canadians, transportation was the most affected area followed by food and household operations. Among the other quintiles, although the ranking was the same, there were some differences in proportions. For example, individuals in the bottom income quintile (14%) were twice as likely as those in the top quintile (7%) to report shelter as the most affected area.
Data table for Chart 2
| Income quintile | ||||||
|---|---|---|---|---|---|---|
| All | Bottom | Second | Third | Fourth | Top | |
| percent | ||||||
| Transportation | 32.2 | 26.7 | 26.3 | 47.7 | 33.6 | 30.8 |
| Shelter | 9.4 | 14.0 | 13.1 | 5.7 | 8.0 | 7.2 |
| Food | 42.9 | 48.1 | 45.2 | 32.5 | 40.9 | 48.2 |
| Recreation | 4.7 | 2.2 | 2.0 | 6.4 | 7.1 | 4.4 |
| Household operations | 8.4 | 8.1 | 12.7 | 7.5 | 7.6 | 4.1 |
| Education | 2.4 | 1.1 | 0.8 | 0.4 | 2.9 | 5.3 |
| Source: Statistics Canada, Portrait of Canadian Society Survey, 2022. | ||||||
Rising prices can also have an adverse effect on the financial stability and security of many Canadians, but more so among those with lower incomes. About one in five (19%) individuals in the bottom income quintile reported that they had to often borrow money from friends or relatives or take on additional debt to meet day-to-day expenses, compared to less than one in ten (8%) of those in the other income quintiles. In the top quintile, only 2% had to often borrow money or take on additional debt.
Individuals in the bottom income quintile were also more than three times as likely as other Canadians to report that they were very likely to obtain food or meals from a community organization over the next six months due to rising prices (17% versus 5%).
In 2019, the median after-tax income of the top quintile was seven times that of the bottom quintile
Given the disparate effects of rising prices on the lowest income Canadians, the remainder of this study provides insight on the characteristics of these most financially vulnerable Canadians.
Based on data from the Canadian Income Survey, around 5.1 million Canadians lived in familiesNote in the bottom quintile of after-tax economic family income, representing 14% of the total population in 2019 (Table 2). Regionally, Nova Scotia and Newfoundland and Labrador (18%) had a higher proportion of its population living in the bottom income quintile families, whereas Alberta (9%) had the least.
| Income quintile | Average family size | Number of families | Number of individuals | Distribution of families | Distribution of individuals |
|---|---|---|---|---|---|
| number | millions | percentage | |||
| Bottom | 1.6 | 3.2 | 5.1 | 20 | 13.9 |
| Second | 2.2 | 3.2 | 7.1 | 20 | 19.2 |
| Third | 2.4 | 3.2 | 7.7 | 20 | 20.8 |
| Fourth | 2.6 | 3.2 | 8.3 | 20 | 22.6 |
| Top | 2.7 | 3.2 | 8.7 | 20 | 23.5 |
| Source: Statistics Canada, Canadian Income Survey, 2019. | |||||
Living in the bottom income quintile families was more common among women, the young and old, those with lower levels of education, lone parents, Indigenous people and recent immigrants. The gender difference in the likelihood of living in families in the lowest income quintile was relatively small, with 15% of women falling in this category compared to 13% of men (Table 3). Gender difference may be attributable to higher proportions of women who are separated, divorced or widowed. In general, individuals who were separated (25%), divorced (30%) or widowed (27%) had a greater likelihood of being in the bottom income quintile than those who were married (9%) or living common-law (8%).
The gender difference, however, is much more pronounced when looking at the major income earners. Families with a woman as the major income earner were much more likely to be in the bottom income quintile (26%) compared to men as the major income earner (16%).
In addition, almost one-third of lone parents (32%) were in the bottom quintile. This proportion was notably higher than that for non-elderly couples with children (8%) or without children (8%).
Age is also linked to the likelihood of being in the lowest income quintile. Young people and seniors aged 65 years and older were most likely to live in families in the bottom income quintile. In 2019, 16% of Canadians aged 15 to 24 lived in the lowest income quintile, similar to the proportion of Canadians aged 65 years and older (17%). Middle-aged Canadians, those aged 45 to 54 years, were the least likely at 10%.
Lower levels of education are also associated with lower incomes. Almost one in four (24%) of those who did not complete high school were in the bottom income quintile families. This proportion was notably higher than individuals whose highest level of education was a high school diploma (16%), post-secondary education below a university degree (11%) or a university degree (11%).
Certain population groups are more often in the lowest income quintile families. Recent immigrants (those who immigrated in the years 2016 to 2020) were more likely to be in the bottom income quintile (24%) compared to both long-term immigrants (14%) and Canadian-born (13%).Note
Indigenous people were more likely to live in the bottom income quintile. The proportion of those in the bottom income quintile was 28%, and 18%, respectively for First Nations living off-reserve, and Métis.Note Lower incomes among the Indigenous population is a result of complex factors including systemic barriers to employment and education, racial discrimination in the workplace, and the intergenerational effects of colonization and residential school experiences. Note
| Characteristics | Percentage |
|---|---|
| All Canadians | 13.9 |
| Gender | |
| Male (ref.) | 13.0 |
| Female | 14.8Note * |
| Age group | |
| Less than 15 years | 13.1 |
| 15 to 24 years | 15.7 |
| 25 to 34 years | 13.8 |
| 35 to 44 years (ref.) | 12.7 |
| 45 to 54 years | 10.2Table 3 Note † |
| 55 to 64 years | 14.0 |
| 65 years and older | 17.3Note * Table 3 Note † |
| Highest level of education | |
| Less than a high school diploma (ref.) | 24.4Table 3 Note † |
| High school diploma | 16.3Note * Table 3 Note † |
| Trades/college certificate | 11.4Note * Table 3 Note † |
| University degree | 10.5Note * Table 3 Note † |
| Marital status | |
| Married (ref.) | 8.9Table 3 Note † |
| Common law | 7.8Table 3 Note † |
| Single (never married) | 19.9Note * Table 3 Note † |
| Separated | 24.9Note * Table 3 Note † |
| Divorced | 29.6Note * Table 3 Note † |
| Widowed | 26.5Note * Table 3 Note † |
| Economic family type | |
| Non-elderly couple with no children or relatives (ref) | 8.9Table 3 Note † |
| Non-elderly couple with children | 8.1Table 3 Note † |
| Lone parent | 31.5Note * Table 3 Note † |
| Other | 18.0Note * Table 3 Note † |
| Indigenous identity | |
| Indigenous | 23.3Note * Table 3 Note † |
| First Nations off-reserve | 27.8Note * Table 3 Note † |
| Métis | 18.1 |
| Inuit | Note F: too unreliable to be published |
| Non-Indigenous (ref.) | 13.8 |
| Immigrant status | |
| Immigrated 2016 to 2020 | 24.2Note * Table 3 Note † |
| Immigrated before 2011 | 13.7 |
| Canadian-born (ref.) | 12.7 |
| Province | |
| Newfoundland and Labrador | 17.5Table 3 Note † |
| Prince Edward Island | 16.6 |
| Nova Scotia | 18.2Note * Table 3 Note † |
| New Brunswick | 16.8 |
| Quebec | 15.5 |
| Ontario (ref.) | 14.0 |
| Manitoba | 17.0Note * Table 3 Note † |
| Saskatchewan | 15.1 |
| Alberta | 9.0Note * Table 3 Note † |
| British Columbia | 12.7 |
F too unreliable to be published
|
|
Median income of families in the bottom income quintile three times lower than overall
Overall, the median annual after-tax income of economic families and unattached individuals was $62,900 in 2019 (Chart 3). This is three times higher than that of the bottom quintile, for whom the median after-tax income stood at $21,000. The second income quintile had a median after-tax income double the bottom quintile amount at $41,100, and the top quintile had seven times the bottom amount at $146,000.

Data table for Chart 3
| Income quintile | ||||||
|---|---|---|---|---|---|---|
| All quintiles | Bottom | Second | Third | Fourth | Top | |
| dollars | ||||||
| After-tax economic family income | 62,900 | 21,000 | 41,100 | 63,600 | 90,300 | 146,000 |
| Source: Statistics Canada, Canadian Income Survey, 2019. | ||||||
Based on the market basket measure (MBM),Note 69% of Canadians in families in the bottom income quintile lived below the poverty line in 2019. According to the MBM, a family lives in poverty if it does not have enough income to purchase a specific basket of goods and services in its community.Note ,Note
Among families in the bottom income quintile, certain characteristics of the major income earner were related to lower levels of median income. These included being 15 to 24 years of age ($12,600), single ($16,900), having a university degree ($18,800) or being a recent immigrant ($14,600) (Table 4). Note Though individuals with a university degree were less likely to be in the bottom income quintile, among those who were, they were more likely to have a lower level of median income. One reason for this is that university degree holders in the bottom income quintile were more likely to be recent immigrants, a characteristic associated with lower incomeNote , or in other cases, they may still be students obtaining further educational credentials.Note
For the majority of families in the bottom income quintile (62%), the major source of income was government transfers.Note Another 27% had wages and salaries as the major source of income and 7% of families had income from self-employment. In comparison, for all other quintiles, the major source of income was wages and salaries (68%), with government transfers only representing 9%.
Among those in the bottom quintile, government transfers were more often the major source of income for families with females as the major income earner (67%) and lone-parent families (83%). These transfers also represented a major source for those who did not complete high school (83%). Those without a high school diploma are more likely to be older and hence depend on government transfers such as Canada/Quebec Pension Plan, Old Age Supplement and Guaranteed Income Supplement. Indeed, among those aged 65 years and older in the bottom income quintile, 97% relied on government transfers.
While government transfers were the major source of income for the majority of both Indigenous (75%) and non-Indigenous people (62%) in the bottom income quintile, First Nations people living off reserve and Métis were somewhat more likely than non-Indigenous people to have government transfers as the major source of income, at 77% and 70% respectively.
| Characteristics | Median economic family after-tax income | Major source of income | |||
|---|---|---|---|---|---|
| Total | Wages and salaries | Self-employment | Government transfers | Other source of income or no income | |
| dollars | percentage | ||||
| All Canadians aged 15 and older | 21,000 | 26.6 | 6.7 | 62.0 | 4.7 |
| Gender | |||||
| Male (ref.) | 20,300 | 28.2 | 10.7 | 55.9Table 4 Note † | 5.2 |
| Female | 21,300 | 25.2 | 3.5Note * Table 4 Note † | 66.9Note * | 4.4 |
| Age group | |||||
| 15 to 24 years | 12,600Note * Table 4 Note † | 64.0Note * Table 4 Note † | 3.4 | 29.1Note * Table 4 Note † | 3.5 |
| 25 to 34 years | 19,000Table 4 Note † | 46.9Note * Table 4 Note † | 9.1 | 43.0Note * Table 4 Note † | 1.0Note * |
| 35 to 44 years (ref.) | 21,500 | 26.5 | 9.2 | 58.3 | 6.0 |
| 45 to 54 years | 18,700Table 4 Note † | 31.4 | 13.6Table 4 Note † | 50.0Table 4 Note † | 5.0 |
| 55 to 64 years | 17,300Note * Table 4 Note † | 19.6Table 4 Note † | 11.2 | 55.9 | 13.3Note * Table 4 Note † |
| 65 years and older | 22,400Table 4 Note † | Note F: too unreliable to be published | 0.7Note * Table 4 Note † | 97.2Note * Table 4 Note † | 1.8Table 4 Note † |
| Highest level of education | |||||
| Less than a high school diploma (ref.) | 21,900Table 4 Note † | 10.5Table 4 Note † | 3.8 | 83.4Table 4 Note † | 2.3Table 4 Note † |
| High school diploma | 20,000Note * | 32.9Note * Table 4 Note † | 6.0 | 56.7Note * | 4.4 |
| Trades/college certificate | 21,600 | 24.9Note * | 7.4Note * | 61.4Note * | 6.3Note * |
| University degree | 18,800Note * Table 4 Note † | 37.0Note * Table 4 Note † | 10.0Note * | 47.4Note * Table 4 Note † | 5.6 |
| Marital status | |||||
| Married (ref.) | 31,400Table 4 Note † | 24.9 | 8.3 | 60.4 | 6.4 |
| Common-law | 24,300Note * Table 4 Note † | 26.5 | 12.0 | 53.3 | 8.2 |
| Separated | 21,400Note * | 19.2 | 9.2 | 65.8 | 5.8 |
| Divorced | 20,200Note * | 10.7Note * Table 4 Note † | 4.8 | 78.9Note * Table 4 Note † | 5.6 |
| Widowed | 22,100Note * Table 4 Note † | 1.2Note * Table 4 Note † | 1.7Note * Table 4 Note † | 95.0Note * Table 4 Note † | 2.1Note * Table 4 Note † |
| Single (never married) | 16,900Note * Table 4 Note † | 39.9Note * Table 4 Note † | 7.2 | 49.1Note * Table 4 Note † | 3.8 |
| Economic family type | |||||
| Non-elderly couple with no children or relatives (ref) | 23,200Table 4 Note † | 32.2 | 16.8Table 4 Note † | 35.3Table 4 Note † | 15.7Table 4 Note † |
| Non-elderly couple with children | 40,400Note * Table 4 Note † | 33.4 | 8.3 | 55.9Note * | Note F: too unreliable to be published |
| Lone parent | 31,300Note * Table 4 Note † | 11.3Note * Table 4 Note † | 2.4Note * Table 4 Note † | 82.6Note * Table 4 Note † | 3.7Note * Table 4 Note † |
| Other | 20,000Note * Table 4 Note † | 26.5 | 6.1Note * | 63.4Note * | 4.0 |
| Indigenous identity | |||||
| Indigenous | 20,800 | 18.2 | Note F: too unreliable to be published | 75.0Note * Table 4 Note † | 3.3 |
| First Nations off-reserve | 20,200 | 15.6 | Note F: too unreliable to be published | 76.8Note * Table 4 Note † | Note F: too unreliable to be published |
| Métis | 21,000 | 23.2 | Note F: too unreliable to be published | 70.3 | Note F: too unreliable to be published |
| Inuit | F | F | F | F | F |
| Non-Indigenous (ref.) | 21,000 | 26.9 | 6.9 | 61.5 | 4.7 |
| Immigrant status | |||||
| Immigrated 2016 to 2020 | 14,600Note * Table 4 Note † | 46.0Note * Table 4 Note † | Note F: too unreliable to be published | 41.1Note * Table 4 Note † | Note F: too unreliable to be published |
| Immigrated before 2016 | 22,800Table 4 Note † | 25.4 | 8.7 | 60.9 | 5.0 |
| Canadian-born (ref.) | 21,100 | 23.8 | 6.3 | 65.0 | 4.9 |
F too unreliable to be published
|
|||||
The median net worth of families in the second to fifth quintiles was more than 20 times of those in the bottom quintile
Taken together, low income levels and high poverty rates reveal current financial vulnerability of the Canadian population. On the other hand, low levels of assets and/or high levels of debt can be indicators of future financial vulnerability in situations such as job loss, retirement or other economic shock.Note Moreover, having low levels of debt and a high level of assets, in other words, a higher net worth, may indicate financial stability. Financially stable families are in a better position to weather the effects of inflation.
Data from the Survey of Financial Security includes two measures of debt: consumer debt and mortgage debt. Consumer debt refers to outstanding balances on credit cards, deferred payments or instalment plans (‘buy now, pay later’), loans or lines of credit, past due bills, and other non-mortgage debts. Unlike consumer debt, mortgage debt is backed by an asset – the value of a home. Therefore, differences in the types of debt can signal increased financial vulnerability or security.
In 2019, 54% of Canadian families in the bottom income quintile carried some form of debt, most with consumer debt (50%), followed by mortgage debt (12%) (Table 5). A higher share of families carried debt among families from the other income quintiles, with three-quarters (74%) reporting some type of debt. This included 64% with consumer debt and 44% with mortgage debt.
Differences in mortgage debt between quintiles is directly related to real estate assets. Less than one in three (31%) families in the bottom income quintile had some real estate assets, while three in four (75%) for the other income quintiles had these assets.
Perhaps reflecting the smaller share of mortgage debt and homeownership, those in the bottom income quintile who reported debt owed much less than other quintiles. Specifically, they carried about $13,000 in debt, lower than the median debt of $108,000 for the remaining quintiles. In addition, those in the bottom income quintile also had much lower asset levels, totalling a median of $26,400. This was 24 times lower than the other income quintiles, who had a median asset level of $627,000.Note
Looking at debt and assets together, the median debt-to-asset ratio was higher for families in the lowest income quintile (0.32) than other income quintiles (0.23). Families with a higher debt-to-asset ratio are considered to be in a weaker financial position. However, there is heterogeneity among the bottom income quintile. For example, younger families have low levels of assets and hence a high debt-to-asset ratio. In comparison, older families have high levels of assets and low levels of debt and as a result a lower debt-to-asset ratio. Specifically, the ratio was 0.55 for families where the major income earner was 25 to 34 years of age and 0.18 for seniors 65 years and older.
Net worth is another way of understanding financial security. Net worth is defined as the overall value of assets held by the family, minus the overall debt held by that family. The median net worth of families in the bottom quintile was $20,000, compared to $463,500 for the rest of the families.
In general, the net worth of individuals and families changes over the course of the life cycle. During working age, individuals tend to accumulate assets, such as housing and savings in pension plans, meaning net worth increases. In older age, many people cash out certain assets, such as savings in the Registered Retirement Savings Plan (RRSP) to supplement pension income to fund their retirement. Hence, net worth decreases. The median value of net worth was $7,000 for families in the bottom income quintile where the major income earner was 15 to 34 years of age. This value increased to $62,500 for those aged 55 to 64 and declined to $50,500 for seniors 65 years and older.
Married people had the highest net worth at $158,000, while divorced and single had the least with less than $10,000. Also, lone parent families ($6,500) had a net worth that was notably lower than non-elderly couples with or without children ($40,000 and $199,200, respectively).
| Characteristics | Have any type of debt | Have consumer debt | Have mortgage debt | Have real estate assests | Total amount of debt | Total amount of assets | Net worth (assets - debt) | Debt-to-asset |
|---|---|---|---|---|---|---|---|---|
| percentage | median dollars | ratios | ||||||
| All Canadians aged 15 and older | 53.5 | 49.7 | 12.2 | 30.6 | 13,000 | 26,400 | 20,000 | 0.32 |
| Gender | ||||||||
| Male | 52.5 | 48.1 | 11.9 | 31.9 | 13,500 | 28,500 | 20,300 | 0.26 |
| Female | 54.5 | 51.2 | 12.5 | 29.4 | 12,500 | 26,100 | 20,000 | 0.40 |
| Age group | ||||||||
| 15 to 24 years | 45.9 | 45.0 | 2.3 | 7.3 | 8,100 | 11,500 | 7,000 | 0.34 |
| 25 to 34 years | 69.3 | 67.2 | 7.9 | 14.8 | 13,000 | 15,000 | 7,000 | 0.55 |
| 35 to 44 years | 71.6 | 62.3 | 21.8 | 28.9 | 18,000 | 33,900 | 23,000 | 0.51 |
| 45 to 54 years | 61.6 | 56.1 | 26.3 | 37.7 | 30,000 | 31,000 | 20,500 | 0.30 |
| 55 to 64 years | 52.3 | 48.6 | 13.7 | 42.1 | 23,000 | 79,000 | 62,500 | 0.20 |
| 65 years and older | 35.8 | 33.1 | 8.3 | 43.9 | 6,000 | 71,000 | 50,500 | 0.18 |
| Highest level of education | ||||||||
| Less than a high school diploma | 41.3 | 39.3 | 6.6 | 32.4 | 4,500 | 22,000 | 18,300 | 0.25 |
| High school diploma | 49.9 | 47.4 | 9.0 | 24.5 | 10,000 | 20,300 | 14,900 | 0.33 |
| Trades/college certificate | 61.9 | 58.4 | 13.4 | 31.1 | 16,000 | 26,000 | 19,000 | 0.37 |
| University degree | 60.1 | 52.1 | 21.1 | 36.9 | 30,000 | 64,000 | 53,300 | 0.32 |
| Marital status | ||||||||
| Married | 59.9 | 49.1 | 26.8 | 58.8 | 37,600 | 200,400 | 158,000 | 0.25 |
| Common-law | 80.2 | 73.3 | 20.3 | 32.7 | 18,000 | 37,800 | 23,300 | 0.30 |
| Widowed | 26.0 | 23.5 | 8.9 | 48.5 | 9,000 | 104,300 | 91,500 | 0.25 |
| Separated | 56.8 | 53.1 | 14.8 | 28.7 | 14,000 | 26,200 | 20,000 | 0.38 |
| Divorced | 54.6 | 53.2 | 9.6 | 28.4 | 10,000 | 17,500 | 9,600 | 0.30 |
| Single (never married) | 53.4 | 52.0 | 6.1 | 15.1 | 10,000 | 15,000 | 8,000 | 0.47 |
| Economic family type | ||||||||
| Non-elderly couple with no children or relatives | 72.8 | 63.7 | 31.7 | 62.7 | 37,000 | 256,600 | 199,200 | 0.23 |
| Non-elderly couple with children | 73.8 | 59.4 | 29.3 | 42.5 | 32,500 | 54,200 | 40,000 | 0.39 |
| Lone parent | 72.4 | 69.5 | 19.7 | 24.2 | 13,000 | 14,800 | 6,500 | 0.48 |
| Other | 48.3 | 45.9 | 8.3 | 27.4 | 10,000 | 23,000 | 18,300 | 0.31 |
| Immigrant status | ||||||||
| Immigrated 2015 to 2019 | 56.7 | 51.1 | 9.6 | 28.0 | 10,000 | 19,000 | 10,700 | 0.32 |
| Immigrated before 2015 | 55.4 | 46.7 | 21.3 | 43.7 | 25,100 | 54,200 | 40,000 | 0.39 |
| Canadian-born | 55.8 | 53.8 | 10.4 | 29.4 | 12,400 | 31,500 | 22,000 | 0.32 |
| Indigenous identity | ||||||||
| Indigenous | 47.8 | 46.7 | 5.2 | 19.9 | 8,600 | 10,600 | 4,000 | 0.33 |
| First Nations off-reserve | 42.8 | 41.4 | 4.6 | 17.9 | F | 4,600 | 2,400 | Note F: too unreliable to be published |
| Métis | 56.1 | 55.4 | 6.2 | 22.4 | F | 30,100 | 15,900 | Note F: too unreliable to be published |
| Inuit | Note F: too unreliable to be published | Note F: too unreliable to be published | Note F: too unreliable to be published | Note F: too unreliable to be published | F | F | F | Note F: too unreliable to be published |
| Non-Indigenous | 53.8 | 49.9 | 12.6 | 31.2 | 13,000 | 27,000 | 20,300 | 0.32 |
| Region | ||||||||
| Atlantic | 59.0 | 55.9 | 12.7 | 36.5 | 13,000 | 22,800 | 16,600 | 0.40 |
| Quebec | 54.5 | 51.3 | 10.2 | 24.4 | 8,600 | 22,000 | 13,700 | 0.27 |
| Ontario | 52.0 | 49.3 | 10.5 | 29.3 | 15,000 | 24,500 | 16,800 | 0.30 |
| Prairies | 54.4 | 50.1 | 16.9 | 37.8 | 15,000 | 35,500 | 29,800 | 0.40 |
| British Columbia | 52.1 | 44.8 | 15.3 | 34.7 | 25,000 | 40,000 | 32,400 | 0.32 |
|
F too unreliable to be published Source: Statistics Canada, Survey of Financial Security, 2019. |
||||||||
Seeking financial support reported by one in four Canadians living in bottom income quintile households
To make ends meet, those in the bottom income quintile households sometimes looked to family and friends for financial help. In particular, in 2018, more than one in four (26%) of Canadians in the bottom income quintile lived in households where at least one member asked for financial help in the past 12 months to cover day-to-day expenses (Table 6). This compares to 14% among those in other income quintiles.Note
Turning to family and friends for financial help was more often seen among younger people. For example, among individuals living in the bottom income quintile households, 35% of those under 45 years of age reported living in households that asked for financial help. This proportion decreased to 28% among the 45- to 54-year-olds, to 23% among the 55- to 64-year-olds and 10% among those aged 65 and older. This is consistent with the fact that younger people are more likely to have lower incomes as they are starting out with their careers. Moreover, they are more likely to have young children and hence more financial responsibilities. Younger households are also more likely to have larger financial liabilities such as outstanding mortgage debt.
More than one-third (37%) of individuals in the bottom income quintile households who were separated lived in households that asked for financial help. In comparison, 18% of married individuals lived in such households. Single (never married) people (33%) were more likely, and widowed (12%) were less likely to live in such households. In both cases, the results are driven by age. Single (never married) are likely to be younger and widowed are likely to be older. Older individuals are more likely to be financially stable than younger ones.
Mirroring these patterns, lone parent bottom income quintile households (46%) were twice as likely to have asked for financial help compared with couples with children (23%) in the bottom quintile.
Indigenous people in the bottom income quintile households were also more likely than the non-indigenous population to live in households in which a member had to ask for financial help (37% versus 26%). This was especially true for Inuit in the bottom income quintile, where 44% lived in such households. The comparable proportions for First Nations people living off reserve and Métis were 36% and 37%, respectively.
Overall, racialized groups in the bottom income quintile households (24%) were almost as likely as the their non-racialized non-Indigenous counterparts (26%) to live in households that asked for financial help. However, there were differences among the racialized groups. For instance, chinese people (13%) were much less likely to live in such households.
Another group in the bottom income quintile that was more likely to live in households that asked for financial help was LGB+ personsNote (39% versus 26% of heterosexual persons). Lastly, there were no differences among recent immigrants, long-term immigrants and non-immigrants and veterans and non-veterans.
| Characteristics | TypeTable 6 Note 1 of economic hardship | |||||
|---|---|---|---|---|---|---|
| Type 1 | Type 2 | Type 3 | Type 4 | Type 5 | Type 6 | |
| percentage | ||||||
| All Canadians | 26.2 | 20.5 | 15.8 | 38.9 | 23.0 | 11.8 |
| Gender | ||||||
| Male (ref.) | 26.1 | 21.1 | 15.4 | 38.7 | 23.0 | 12.6 |
| Female | 26.3 | 20.0 | 16.1 | 39.0 | 23.0 | 11.0 |
| Age group | ||||||
| Less than 15 years | 33.3Table 6 Note † | 27.6Table 6 Note † | 23.0Table 6 Note † | 45.8Table 6 Note † | 27.2 | 15.7 |
| 15 to 24 years | 34.2Table 6 Note † | 23.1 | 16.0 | 40.0 | 19.6 | 16.7 |
| 25 to 34 years | 36.9Table 6 Note † | 25.3 | 18.1 | 40.1 | 25.0 | 13.1 |
| 35 to 44 years (ref.) | 36.7Table 6 Note † | 28.8Table 6 Note † | 21.3Table 6 Note † | 45.4 | 28.1 | 10.9 |
| 45 to 54 years | 27.6Note * | 22.7 | 18.6 | 46.9Table 6 Note † | 25.1 | 15.5 |
| 55 to 64 years | 22.8Note * | 19.0Note * | 15.8 | 39.1 | 22.2 | 10.5 |
| 65 years and older | 9.6Note * Table 6 Note † | 8.7Note * Table 6 Note † | 5.5Note * Table 6 Note † | 26.2Note * Table 6 Note † | 14.4Note * Table 6 Note † | 2.1Note * Table 6 Note † |
| Highest level of education | ||||||
| Less than a high school diploma (ref) | 22.5 | 16.4Table 6 Note † | 17.5 | 38.9 | 18.7 | 11.7 |
| High school diploma | 24.6 | 18.4 | 13.3Note * | 35.0 | 19.5 | 10.2 |
| Trades/college certificate | 25.8 | 21.2Note * | 14.9 | 40.0 | 23.6 | 10.7 |
| University degree | 25.5 | 20.0 | 9.6Note * Table 6 Note † | 34.6 | 26.1Note * | 9.4 |
| Marital status | ||||||
| Married (ref.) | 17.5Table 6 Note † | 15.0Table 6 Note † | 8.6Table 6 Note † | 31.5Table 6 Note † | 22.6 | 9.5 |
| Common law | 26.0Note * | 21.3 | 16.5Note * | 41.2Note * | 28.0 | 11.1 |
| Single (never married) | 33.3Note * Table 6 Note † | 25.2Note * Table 6 Note † | 20.9Note * Table 6 Note † | 43.5Note * | 23.8 | 14.2 |
| Separated | 36.8Note * Table 6 Note † | 26.8Note * | 19.0Note * | 45.4Note * | 22.6 | 14.6 |
| Divorced | 25.2Note * | 21.3Note * | 16.7Note * | 43.4Note * | 19.1 | 8.5Table 6 Note † |
| Widowed | 11.9Note * Table 6 Note † | 8.1Note * Table 6 Note † | 6.7Table 6 Note † | 26.2Table 6 Note † | 16.0Table 6 Note † | 3.7Note * Table 6 Note † |
| Economic family type | ||||||
| Couple with no children (ref.) | 14.6Table 6 Note † | 13.2Table 6 Note † | 6.5Table 6 Note † | 28.5Table 6 Note † | 17.5 | 7.5Table 6 Note † |
| Couple with children | 23.3Note * | 22.4Note * | 16.1Note * | 40.2Note * | 27.6Note * | 13.2 |
| Lone parent | 46.1Note * Table 6 Note † | 34.0Note * Table 6 Note † | 29.9Note * Table 6 Note † | 53.4Note * Table 6 Note † | 26.8Note * | 20.2Note * Table 6 Note † |
| Other | 24.8Note * | 16.0Table 6 Note † | 13.2Note * | 35.7Note * | 17.9Table 6 Note † | 7.0Table 6 Note † |
| Sexual orientation | ||||||
| Heterosexual (ref.) | 25.7 | 20.3 | 15.2 | 38.6 | 22.7 | 11.5 |
| Sexually and gender diverse | 38.5Note * Table 6 Note † | 30.5 | 29.7Note * Table 6 Note † | 45.0 | 22.1 | 17.7 |
| Indigenous identity | ||||||
| Indigenous | 36.5Note * Table 6 Note † | 25.4 | 29.9Note * Table 6 Note † | 52.7Note * Table 6 Note † | 21.0 | 22.9Note * Table 6 Note † |
| First Nations off-reserve | 35.7Note * | 24.5 | 27.7Note * Table 6 Note † | 47.2 | 23.3 | 24.3Note * Table 6 Note † |
| Métis | 36.6Note * | 26.6 | 31.5Note * Table 6 Note † | 58.0Note * Table 6 Note † | 18.0 | 19.2Note * |
| Inuit | 43.7Note * Table 6 Note † | 23.4 | 38.2Note * Table 6 Note † | 59.7Note * Table 6 Note † | 25.5 | 39.4Note * Table 6 Note † |
| Non-Indigenous (ref.) | 25.7 | 20.2 | 14.9 | 38.1 | 23.2 | 11.2 |
| Racialized group | ||||||
| South Asian | 22.8 | 16.9 | 6.6Note * Table 6 Note † | 43.0 | 35.3Note * | 15.0 |
| Chinese | 13.0Note * Table 6 Note † | 6.5Note * Table 6 Note † | 4.5Note * Table 6 Note † | 25.3Note * Table 6 Note † | 35.7Note * | Note F: too unreliable to be published |
| Black | 25.2 | 24.3 | 23.4Note * | 47.2 | 25.1Note * | 20.2Note * |
| Filipino | 42.7 | Note F: too unreliable to be published | Note F: too unreliable to be published | 39.6 | 55.6Note * Table 6 Note † | Note F: too unreliable to be published |
| Latin American | 28.5 | 22.8 | 20.3 | 45.1 | 25.5 | Note F: too unreliable to be published |
| Arab | 33.6 | 32.9 | 21.1 | 46.7 | 39.6Note * Table 6 Note † | 10.6 |
| Southeast Asian | Note F: too unreliable to be published | Note F: too unreliable to be published | Note F: too unreliable to be published | 39.7 | 55.3Note * Table 6 Note † | Note F: too unreliable to be published |
| West Asian | 33.1 | Note F: too unreliable to be published | Note F: too unreliable to be published | 46.1 | 42.6Note * | Note F: too unreliable to be published |
| Korean | Note F: too unreliable to be published | Note F: too unreliable to be published | Note F: too unreliable to be published | Note F: too unreliable to be published | Note F: too unreliable to be published | Note F: too unreliable to be published |
| Japanese | Note F: too unreliable to be published | Note F: too unreliable to be published | Note F: too unreliable to be published | Note F: too unreliable to be published | Note F: too unreliable to be published | Note F: too unreliable to be published |
| Visible minority, n.i.e | Note F: too unreliable to be published | Note F: too unreliable to be published | Note F: too unreliable to be published | Note F: too unreliable to be published | Note F: too unreliable to be published | Note F: too unreliable to be published |
| Multiple visible minorities | Note F: too unreliable to be published | Note F: too unreliable to be published | Note F: too unreliable to be published | Note F: too unreliable to be published | Note F: too unreliable to be published | Note F: too unreliable to be published |
| Non-racialized non-Indigenous (ref.) | 26.2 | 20.6 | 15.7 | 37.3 | 16.1Table 6 Note † | 10.9 |
| Immigrant status | ||||||
| Immigrated 2012 to 2016 | 26.0 | 16.6 | 12.7 | 37.1 | 28.7 | 2.9Note * Table 6 Note † |
| Immigrated before 2012 | 25.4 | 20.5 | 8.8Note * Table 6 Note † | 42.3 | 36.9Note * Table 6 Note † | 9.3 |
| Canadian-born (ref.) | 26.3 | 20.8 | 17.0 | 38.4 | 20.2 | 12.8 |
| Veteran | ||||||
| Yes | 25.7 | 25.7 | 20.0 | 40.6 | 15.8 | Note F: too unreliable to be published |
| No (ref.) | 24.5 | 18.8 | 14.0 | 37.1 | 21.8 | 10.5 |
| Province/Territory | ||||||
| Newfoundland and Labrador | 25.4 | 16.0Note * | 14.9 | 38.2 | 13.6Note * Table 6 Note † | 13.3 |
| Prince Edward Island | 23.4 | 13.4Note * Table 6 Note † | 14.2 | 36.1 | 13.1Note * Table 6 Note † | 15.3 |
| Nova Scotia | 29.8 | 18.9 | 17.8 | 38.4 | 14.1Note * Table 6 Note † | 15.3 |
| New Brunswick | 26.6 | 18.1 | 17.0 | 40.4 | 10.6Note * Table 6 Note † | 12.6 |
| Quebec | 19.8Note * Table 6 Note † | 15.4Note * Table 6 Note † | 12.6Note * | 33.8Note * | 15.6Note * Table 6 Note † | 10.2 |
| Ontario (ref.) | 29.6 | 22.6 | 17.0 | 41.7 | 28.4 | 12.3 |
| Manitoba | 28.6 | 18.7 | 18.6 | 35.7 | 17.1Note * | 13.9 |
| Saskatchewan | 33.5 | 25.9 | 18.7 | 45.3 | 22.3 | 17.1 |
| Alberta | 24.1 | 27.8 | 13.4 | 43.2 | 23.1 | 13.2 |
| British Columbia | 26.0 | 19.6 | 17.4 | 35.7 | 27.8 | 8.5 |
| Yukon | 19.0 | 21.1 | 22.6 | 38.1 | Note F: too unreliable to be published | Note F: too unreliable to be published |
| Northwest Territories | 49.8Note * Table 6 Note † | 22.8 | 28.6Note * Table 6 Note † | 37.4 | 23.0 | Note ...: not applicable |
| Nunavut | 50.5Note * Table 6 Note † | 27.2 | 42.2Note * Table 6 Note † | 70.4Note * Table 6 Note † | 27.7 | 51.3Note * Table 6 Note † |
|
... not applicable F too unreliable to be published
|
||||||
One in six Canadians in the bottom quintile lived in households that asked a charitable organization for help
Along with informal sources of financial support, two indicators of formalized sources were collected by the Canadian Housing Survey: 1) taking on debt or selling an asset in the past 12 months because short of money, and 2) seeking assistance from a charitable organization in the past 12 months.
These more formalized avenues for financial assistance were somewhat less common than help from family and friends. In 2018, about one in five (21%) Canadians in the bottom income quintile households reported that at least one household member had to take on debt or sell an asset to pay for day-to-day expenses (Table 6).
As for help from a charity, 16% sought assistance because they were short of money. In comparison, among the other income quintiles, the proportions were 14% for taking on debt or selling an asset, and 3% for seeking assistance from a charity.
Some of the personal characteristics associated with taking on debt/selling an asset or turning to a charitable organization were similar to those associated with asking for financial help from family or friends. For example, taking on debt, selling assets or seeking help from a charity was more commonly reported by separated persons, those living in lone parent households, and LGB+ individuals.
In addition, among those within the lowest income quintile, differences emerged in formal help seeking behaviour by population group. First Nations people living off reserve (28%), Métis (32%) and Inuit (38%) were much more likely to turn to a charity compared to the non-Indigenous population (15%).
Among racialized groups, Chinese people (7%) were less likely than the non-racialized non-Indigenous population (21%) to take on debt or sell an asset. Also, Chinese people (5%) along with the South Asian population (7%) were less likely to turn to a charity compared to non-racialized non-Indigenous Canadians (16%). On the other hand, Black Canadians (23%) were more likely to turn to a charity.
Skipping payments on rent or mortgage reported by almost one in four Canadians living in lowest income households
The inability to afford expenses is sometimes related to keeping up with increasing rent or mortgage payments. In 2018, among the bottom income quintile households, almost one in four (23%) renters or homeowners with a mortgage had experienced significant financial difficulties because of increases in rent or mortgage payments. The corresponding share was 16% among households in the other quintiles (Table 6).
Those in the bottom quintile households were also twice as likely as those in the other quintiles to have skipped or delayed a mortgage payment or rent in the past 12 months (12% versus 6%).
Certain population groups in the bottom quintile were notably more likely to have experienced financial difficulties. For example, Filipino (56%) and Southeast Asian (55%) were more than three times as likely and West Asian (43%), Arab (40%), Chinese (36%) and South Asian (35%) were twice as likely as the non-racialized non-Indigenous population (16%) to have experienced difficulties in paying rent or their mortgage. In addition, Black Canadians (20%) were almost twice as likely to have skipped mortgage or rental payments compared to the non-racialized non-Indigenous population (11%).
Inuit persons (39%), First Nations living off-reserve (24%) and Métis (19%) were more likely than the non-Indigenous population (11%) to have skipped mortgage or rental payments.
Start of text box
In 2017, more than three in ten Canadians in the bottom income quintile households had a disability
Individuals in the bottom income quintile are more likely to live in poverty and have lower levels of net worth and hence are more financially vulnerable. They are also more likely to have physical and mental disabilities. Whereas all individuals in the bottom quintile are financially vulnerable, those with a disability are more at risk during periods of high inflation. This is because they are less likely to be employed and more likely to be dependent on fixed income sources, such as the Canadian Disability Benefit.
Based on data from the Canadian Survey on Disability, 22% of Canadians aged 15 years and older had a disability in 2017. Persons in the bottom income quintile were more likely to have a disability. Specifically, more than three in ten (32%) individuals in the bottom income quintile had a disability compared to 21% in the other quintiles (Table 7).
The most prevalent disability among individuals in the bottom quintile of family income was the same as that for the remaining quintiles: pain-related (68% and 65%, respectively). This type was followed by flexibility (52% and 43%), mobility (52% and 41%), mental health-related (45% and 30%) and seeing (28% and 24%). The least prevalent disability type was developmental (8% and 5%).
Every type of disability except hearing was more common among Canadians in the bottom income quintile families. However, the gap between the bottom quintile and the other income quintiles was most pronounced in the case of mental health-related disabilities (14 percentage points) and mobility (11 percentage points).
Not only were all types of disabilities (except hearing) more prevalent among individuals in the bottom income quintile, they were also likely to be more severe. The disability was severe or very severe in more than half (55%) of those in the bottom income quintile. The comparable proportion for those in the other income quintiles was 39%.
| Adjusted family income quintile | ||
|---|---|---|
| Bottom quintile | Second to top quintile | |
| percentage | ||
| All types of disability | 32.0 | 21.0 |
| Severity of disability | ||
| Mild | 27.8 | 39.9 |
| Moderate | 17.1 | 20.7 |
| Severe | 24.4 | 19.7 |
| Very severe | 30.7 | 19.7 |
| Type of disability | ||
| Mobility | 51.5 | 40.7 |
| Flexibility | 51.7 | 43.2 |
| Dexterity | 24.9 | 19.3 |
| Seeing | 27.8 | 23.6 |
| Hearing | 17.6 | 22.6 |
| Pain-related | 68.2 | 65.1 |
| Developmental | 7.7 | 4.5 |
| Mental health-related | 44.5 | 30.4 |
| Memory | 23.7 | 15.5 |
| Unknown | 2.4 | 2.5 |
| Source: Statistics Canada, Canadian Survey on Disability, 2017. | ||
Navigating through difficult financial periods
During periods of rising prices, the risk of becoming financially vulnerable increases for all Canadians. For example, lower-income families may have little room in their already tight budgets to absorb price increases, while high interest rates can place middle- and high-income families, who took on large debt loads (such as large mortgages), in a precarious financial situation.
While financial vulnerability is not limited to certain groups, systemic barriers, as well as life-changing events (e.g., loss of employment, health concerns) can further amplify the risk of financial vulnerability. This in turn can lead to negative financial outcomes.
There is no simple solution for addressing financial vulnerability. It requires a multipronged approach that moves beyond putting the onus solely on the individual, and instead fosters collaboration among the larger financial ecosystem, including the financial service industry, regulatory and government bodies, researchers, academia, employers, and community groups.
As indicated in the Financial Consumer Agency of Canada’s National Financial Literacy Strategy(2021-2016), building financial resilience, defined as the ability to adapt or persevere financially, starts with reducing barriers that limit people from accessing, understanding, and using appropriate financial products and services, and catalyzing actions that help Canadians take positive financial actions. This will increase the ability of all Canadians, regardless of income level, to navigate through difficult financial periodsNote .
Conclusion
Canada has experienced a period of rising inflation starting in mid-2021. In December 2022, the rate of inflation was 6.3%. The annual increase in the price of groceries was 11.0%. Rising prices affect different segments of society differently.
Those with lower levels of income are affected more adversely as they spend a higher proportion of their income on necessities such as food and shelter and hence have less room to make adjustments in their budget. In this study, data from various Statistics Canada surveys were used to provide a profile of families or households in the lowest income quintile.
In 2019, around 5.1 million Canadians lived in families that were in the bottom quintile of after-tax economic family income, representing 14% of the total population. Some personal characteristics associated with a higher likelihood of being in a bottom income quintile family included being young, 65 years of age and older, separated, divorced, widowed, lone parent, Indigenous, or a recent immigrant. Moreover, 69 % Canadians living in the bottom income quintile were below the poverty line.
In 2022, among Canadians in the bottom income quintile, almost nine in ten reported that rising prices were affecting their ability to meet day-to-day expenses compared to less than seven in ten of those in the other income quintiles. Those in the bottom income quintile were also more likely to be concerned about the impact rising prices would have on their ability to meet expenses in the coming months, and more likely to borrow money from friends or relatives or take on additional debt to meet day-to-day expenses.
Families in the bottom income quintile have lower levels of debt but also lower levels of assets. In 2019, the net worth of families in the second to fifth income quintiles was more than 20 times that of those in the bottom income quintile. This confirms that those in the bottom income quintile are financially more vulnerable in events such as job loss or retirement.
In 2018, one in four of Canadians in the bottom income quintile lived in a household that had to seek financial help from family or friends for day-to-day expenses because they were short of money. Also, one in six lived in households that asked a charitable organization for help. They were also more likely to have experienced significant financial difficulties because of increases in rent or mortgage and to skip or delay a mortgage payment or rent.
Canadians in the bottom income quintile were more likely to have a disability. More than three in ten individuals in the bottom income quintile had a disability compared to one in five in the other quintiles. The disabilities of those in the bottom income quintile were likely to be more severe.
Pre-pandemic data were used in this study to present estimates of income, debt, assets and the economic hardship faced by Canadians living in families in the bottom income quintile. These data present a more accurate understanding of the situation of Canadians in the bottom income quintile by limiting the effect of temporary government transfers provided during the pandemic. These estimates might be an underestimate of the debt levels or economic hardship faced in 2022 due to high inflation and rising interest rates. However, they do provide decision makers with insight into the individuals and families that are most affected by inflation and the types of hardships they face with meeting day-to-day expenses. As data from 2022 become available, additional research will show how spending on necessities, net worth, and perceptions of economic hardship changed during the period of high inflation.
Sharanjit Uppal is a senior researcher at the Centre for Social Data Insights and Innovation at Statistics Canada.
Start of text box
Data sources, methods and definitions
Data from the third 2022 Portrait of Canadian Society Survey (PCS3), 2019 Canadian Income Survey (CIS), 2019 Survey of Financial Security (SFS), 2019 Survey of Household Spending (SHS), 2018 Canadian Housing Survey (CHS), and 2017 Canadian Survey on Disability (CSD) are used in this study.
PCS3 was the third survey of Statistics Canada Survey series, Portrait of Canadian Society (PCS). The PCS survey series is a brand-new project that consists of short online surveys given to the same respondents over a one-year period. These voluntary surveys use a probability panel based on the General Social Survey – Social Identity and are therefore representative of the Canadian population aged 15 years and older. PCS3 was the third survey of the series and collected information about people’s perceptions about the impact of rising prices on their lives, and in some instances the lives of their family, friends and community members.
The primary objective of the CIS is to provide information on the income and income sources of Canadians, along with their individual and household characteristics. The data collected in the CIS is combined with Labour Force Survey and tax data.
The purpose of the SFS is to collect information from a sample of Canadian households on their assets, debts, employment, income and education. The SFS provides a comprehensive picture of the financial health of Canadians. Information is collected on the value of all major financial and non-financial assets and on the money owing on mortgages, vehicles, credit cards, student loans and other debts.
The SHS primarily collects detailed information on household expenditures. It also collects information about the annual income of household members (from personal income tax data), demographic characteristics of the household, and select information on dwelling characteristics and household equipment.
The CHS collects information about housing needs and experiences from a sample of Canadian households. Information is collected on housing conditions and costs, dwelling and neighbourhood satisfaction, housing moves, perceptions of economic hardship and other aspects of well-being related to housing.
The CSD is a national post-censal survey of Canadians aged 15 years and over whose everyday activities are limited because of a long-term condition or health-related problem. The survey collects information including the type and severity of disability, use of aids and assistive devices, and unmet needs for accommodations at school or work.
Household refers to a person or group of persons who occupy the same dwelling and do not have a usual place of residence elsewhere in Canada or abroad. The dwelling may be either a collective dwelling or a private dwelling. The household may consist of a family group such as a census family, of two or more families sharing a dwelling, of a group of unrelated persons or of a person living alone. Household members who are temporarily absent on reference day are considered part of their usual household.
Economic family refers to a group of two or more persons who live in the same dwelling and are related to each other by blood, marriage, common-law union, adoption or a foster relationship. In this study, families include economic families and unattached individuals.
Adjusted income quintiles were calculated using after-tax economic family income and economic family size for CIS, SFS and CSD; after-tax household income and household size for SHS; and before-tax household income and household size for PCS3 and CHS. The income levels were adjusted by dividing the economic family (household) income by the square root of economic family (household) size.
The objective of the article is to look at families (households) and individuals in families (or households) in the bottom family (or household) income quintile. Hence, the quintiles were constructed at the family (or household) level for all data sets. Thus, whereas the bottom quintile consists of 20% families (or households), it consists of less than 20% individuals as families (households) in the bottom income quintile have smaller family (household size) (Table 2). Results for SHS and SFS are for families (or households) in the bottom family (or household) quintile while those for CIS, CHS, PCS3 and CSD are for individuals in the bottom family (or household) quintile.
An alternative method is to calculate quintiles at the individual level by assigning family (household) income to each family (household) member and then dividing the population into five groups. This approach was not followed as spending, debt, assets and net worth are usually evaluated at the family level. Table A1 in the appendix contains the distribution of individuals by personal characteristics based on these two alternative methods of constructing income quintiles.
When possible and sample size permitting, disaggregated data on personal characteristics are provided for CIS, SFS, and CHS, such as differences by gender, age, Indigenous people, and racialized groups.
| Characteristics | Unit of analysis used for constructing quintiles | |
|---|---|---|
| Family | Individual | |
| Total number of individuals | 5,137,100 | 7,371,900 |
| percentage | ||
| Percentage of total population | 13.9 | 20.0 |
| Gender | ||
| Male | 46.3 | 46.3 |
| Female | 53.7 | 53.7 |
| Age group | ||
| Less than 15 years | 15.0 | 16.1 |
| 15 to 24 years | 13.4 | 12.2 |
| 25 to 34 years | 14.0 | 13.7 |
| 35 to 44 years | 12.4 | 12.3 |
| 45 to 54 years | 9.4 | 8.9 |
| 55 to 64 years | 14.0 | 12.7 |
| 65 years and older | 21.9 | 24.1 |
| Economic family size | ||
| One | 41.7 | 36.1 |
| Two | 24.2 | 26.3 |
| Three | 10.0 | 10.3 |
| Four | 11.8 | 12.2 |
| Five or more | 12.3 | 15.2 |
| Marital status | ||
| Married | 25.4 | 28.6 |
| Common law | 5.3 | 5.5 |
| Separated | 3.0 | 2.7 |
| Divorced | 8.9 | 7.8 |
| Widowed | 7.8 | 8.3 |
| Single (never married) | 34.0 | 30.3 |
| Not applicable (less than 15 years of age) | 15.7 | 16.9 |
| Economic family type | ||
| Non-elderly couple with no children or relatives | 8.4 | 8.4 |
| Non-elderly couple with children | 20.1 | 23.4 |
| Lone parent | 10.2 | 9.3 |
| Other | 61.3 | 59.0 |
| Source: Statistics Canada, Canadian Income Survey, 2019. | ||
| Characteristics | Top income quintile | Comparison between the bottom and top income quintiles | ||||||||
|---|---|---|---|---|---|---|---|---|---|---|
| Median economic family after-tax income | Major source of income | Economic family after-tax income - Ratio top to bottom quintile | Major source of income - Percentage point difference between the bottom and top income quintile | |||||||
| Wages and salaries | Self-employment | Government transfers | Other source of income or no income | Wages and salaries | Self-employment | Government transfers | Other source of income or no income | |||
| dollars | percentage | ratio | percentage points difference | |||||||
| All Canadians aged 15 and older | 146,000 | 78.0 | 4.0 | 0.2 | 17.8 | 7.0 | -51.4 | 2.7 | 61.8 | -13.1 |
| Gender | ||||||||||
| Male | 147,500 | 79.6 | 4.2 | 0.3 | 15.9 | 7.3 | -51.4 | 6.5 | 55.6 | -10.7 |
| Female | 143,200 | 74.8 | 3.6 | 0.0 | 21.6 | 6.7 | -49.6 | -0.1 | 66.9 | -17.2 |
| Age group | ||||||||||
| 15 to 24 years | F | F | F | F | Note F: too unreliable to be published | Note ...: not applicable | Note ...: not applicable | Note ...: not applicable | Note ...: not applicable | Note ...: not applicable |
| 25 to 34 years | 128,800 | 92.3 | 5.0 | 0.0 | 2.7 | 6.8 | -45.4 | 4.1 | 43.0 | -1.7 |
| 35 to 44 years | 145,000 | 89.9 | 4.0 | 0.1 | 6.0 | 6.7 | -63.4 | 5.2 | 58.2 | 0.0 |
| 45 to 54 years | 166,400 | 90.7 | 3.1 | 0.1 | 6.1 | 8.9 | -59.3 | 10.5 | 49.9 | -1.1 |
| 55 to 64 years | 148,700 | 77.5 | 3.7 | 0.2 | 18.6 | 8.6 | -57.9 | 7.5 | 55.7 | -5.3 |
| 65 years and older | 121,300 | 24.4 | 5.2 | 0.6 | 69.8 | 5.4 | -24.1 | -4.5 | 96.6 | -68.0 |
| Highest level of education | ||||||||||
| Less than a high school diploma | 126,100 | 63.4 | 7.2 | 0.6 | 28.8 | 5.8 | -52.9 | -3.4 | 82.8 | -26.5 |
| High school diploma | 137,700 | 76.4 | 3.3 | 0.3 | 20.0 | 6.9 | -43.5 | 2.7 | 56.4 | -15.6 |
| Trades/college certificate | 141,800 | 82.9 | 3.1 | 0.2 | 13.8 | 6.6 | -58.0 | 4.3 | 61.2 | -7.5 |
| University degree | 153,000 | 76.3 | 4.5 | 0.1 | 19.1 | 8.1 | -39.3 | 5.5 | 47.3 | -13.5 |
| Marital status | ||||||||||
| Married | 161,200 | 77.6 | 3.4 | 0.2 | 18.8 | 5.1 | -52.7 | 4.9 | 60.2 | -12.4 |
| Common-law | 133,300 | 82.2 | 5.0 | 0.2 | 12.6 | 5.5 | -55.7 | 7.0 | 53.1 | -4.4 |
| Separated | 117,800 | 82.3 | 5.7 | 0.2 | 11.8 | 5.5 | -63.1 | 3.5 | 65.6 | -6.0 |
| Divorced | 104,300 | 71.8 | 3.7 | 0.9 | 23.6 | 5.2 | -61.1 | 1.1 | 78.0 | -18.0 |
| Widowed | 108,600 | 29.1 | 0.5 | 0.1 | 70.3 | 4.9 | -27.9 | 1.2 | 94.9 | -68.2 |
| Single (never married) | 101,000 | 87.4 | 5.9 | 0.1 | 6.6 | 6.0 | -47.5 | 1.3 | 49.0 | -2.8 |
| Economic family type | ||||||||||
| Non-elderly couple with no children or relatives | 129,100 | 85.0 | 3.7 | 0.0 | 11.3 | 5.6 | -52.8 | 13.1 | 35.3 | 4.4 |
| Non-elderly couple with children | 181,600 | 88.5 | 3.6 | 0.2 | 7.7 | 4.5 | -55.1 | 4.7 | 55.7 | -5.3 |
| Lone parent | 143,300 | 83.4 | 0.8 | 0.0 | 15.8 | 4.6 | -72.1 | 1.6 | 82.6 | -12.1 |
| Other | 137,400 | 70.5 | 4.3 | 0.3 | 24.9 | 6.9 | -44.0 | 1.8 | 63.1 | -20.9 |
| Indigenous identity | ||||||||||
| First Nations | 147,600 | 79.1 | 5.5 | 0.0 | 15.4 | 7.2 | -63.5 | -1.8 | 76.8 | -11.5 |
| Metis | 124,600 | 84.3 | 6.4 | 0.7 | 8.6 | 5.9 | -61.1 | -2.6 | 69.6 | -5.9 |
| Inuit | F | F | F | F | Note F: too unreliable to be published | Note ...: not applicable | Note ...: not applicable | Note ...: not applicable | Note ...: not applicable | Note ...: not applicable |
| Non-Indigenous | 146,300 | 77.9 | 4.0 | 0.2 | 17.9 | 7.0 | -51.0 | 2.9 | 61.3 | -13.2 |
| Immigrant status | ||||||||||
| Immigrated 2016 to 2020 | F | F | F | F | Note F: too unreliable to be published | Note ...: not applicable | Note ...: not applicable | Note ...: not applicable | Note ...: not applicable | Note ...: not applicable |
| Immigrated before 2016 | 160,600 | 79.6 | 3.2 | 0.2 | 17.0 | 7.0 | -54.2 | 5.5 | 60.7 | -12.0 |
| Canadian-born | 143,400 | 77.6 | 3.9 | 0.2 | 18.3 | 6.8 | -53.8 | 2.4 | 64.8 | -13.4 |
|
... not applicable F too unreliable to be published Source: Statistics Canada, Canadian Income Survey, 2019. |
||||||||||
| Characteristics | Top income quintile | Top versus bottom income quintile | ||||
|---|---|---|---|---|---|---|
| Debt | Assets | Net worth | Debt | Assets | Net worth | |
| median dollars | ratio top to bottom quintile | |||||
| All Canadians aged 15 and older | 206,000 | 1,341,500 | 1,106,000 | 15.8 | 50.8 | 55.3 |
| Gender | ||||||
| Male | 210,000 | 1,300,400 | 1,047,600 | 15.6 | 45.6 | 51.6 |
| Female | 200,000 | 1,442,600 | 1,193,100 | 16.0 | 55.3 | 59.7 |
| Age group | ||||||
| 15 to 24 years | Note F: too unreliable to be published | Note F: too unreliable to be published | Note F: too unreliable to be published | Note ...: not applicable | Note ...: not applicable | Note ...: not applicable |
| 25 to 34 years | 260,000 | 619,100 | 313,100 | 20.0 | 41.3 | 44.7 |
| 35 to 44 years | 260,000 | 1,036,000 | 762,800 | 14.4 | 30.6 | 33.2 |
| 45 to 54 years | 225,000 | 1,442,100 | 1,159,000 | 7.5 | 46.5 | 56.5 |
| 55 to 64 years | 127,000 | 1,695,500 | 1,535,100 | 5.5 | 21.5 | 24.6 |
| 65 years and older | 65,000 | 2,152,600 | 2,071,200 | 10.8 | 30.3 | 41.0 |
| Highest level of education | ||||||
| Less than a high school diploma | 200,000 | 888,500 | 805,800 | 44.4 | 40.4 | 44.0 |
| High school diploma | 195,000 | 1,186,700 | 932,600 | 19.5 | 58.5 | 62.6 |
| Trades/college certificate | 187,000 | 1,175,100 | 943,400 | 11.7 | 45.2 | 49.7 |
| University degree | 230,000 | 1,535,000 | 1,292,700 | 7.7 | 24.0 | 24.3 |
| Marital status | ||||||
| Married | 230,000 | 1,598,000 | 1,366,000 | 6.1 | 8.0 | 8.6 |
| Common-law | 226,300 | 1,013,100 | 771,600 | 12.6 | 26.8 | 33.1 |
| Widowed | F | 1,895,900 | 1,895,900 | Note ...: not applicable | 18.2 | 20.7 |
| Separated | 171,500 | 1,148,600 | 841,500 | 12.3 | 43.8 | 42.1 |
| Divorced | 148,000 | 1,256,300 | 995,800 | 14.8 | 71.8 | 103.7 |
| Single (never married) | 155,000 | 713,700 | 511,300 | 15.5 | 47.6 | 63.9 |
| Economic family type | ||||||
| Non-elderly couple with no children or relatives | 195,000 | 1,168,900 | 959,100 | 5.3 | 4.6 | 4.8 |
| Non-elderly couple with children | 310,500 | 1,405,900 | 1,071,800 | 9.6 | 25.9 | 26.8 |
| Lone parent | Note F: too unreliable to be published | Note F: too unreliable to be published | Note F: too unreliable to be published | Note ...: not applicable | Note ...: not applicable | Note ...: not applicable |
| Other | 156,000 | 1,362,900 | 1,197,200 | 15.6 | 59.3 | 65.4 |
| Immigrant status | ||||||
| Immigrated 2015 to 2019 | Note F: too unreliable to be published | Note F: too unreliable to be published | Note F: too unreliable to be published | Note ...: not applicable | Note ...: not applicable | Note ...: not applicable |
| Immigrated before 2015 | 270,000 | 1,447,500 | 1,157,200 | 10.8 | 26.7 | 28.9 |
| Canadian-born | 192,000 | 1,322,500 | 1,104,300 | 15.5 | 42.0 | 50.2 |
| Indigenous identity | ||||||
| First Nations | Note F: too unreliable to be published | Note F: too unreliable to be published | Note F: too unreliable to be published | Note ...: not applicable | Note ...: not applicable | Note ...: not applicable |
| Metis | Note F: too unreliable to be published | Note F: too unreliable to be published | Note F: too unreliable to be published | Note ...: not applicable | Note ...: not applicable | Note ...: not applicable |
| Inuit | Note F: too unreliable to be published | Note F: too unreliable to be published | Note F: too unreliable to be published | Note ...: not applicable | Note ...: not applicable | Note ...: not applicable |
| Non-Indigenous | 210,000 | 1,353,000 | 1,123,400 | 16.2 | 50.1 | 55.3 |
|
... not applicable F too unreliable to be published Source: Statistics Canada, Survey of Financial Security, 2019. |
||||||
| Characteristics | Top income quintile | Bottom versus top income quintile | ||||||||||
|---|---|---|---|---|---|---|---|---|---|---|---|---|
| TypeTable A4 Types of economic hardship faced by individuals, top versus bottom income quintile, by personal charactersitics, 2018 Note 1 of economic hardship |
||||||||||||
| Type 1 | Type 2 | Type 3 | Type 4 | Type 5 | Type 6 | Type 1 | Type 2 | Type 3 | Type 4 | Type 5 | Type 6 | |
| percentage | percentage point difference between the bottom and top income quintile | |||||||||||
| All Canadians | 7.9 | 8.8 | 1.5 | 11.5 | 11.4 | 2.6 | 18.3 | 11.7 | 14.3 | 27.4 | 11.6 | 9.2 |
| Gender | ||||||||||||
| Male | 7.8 | 8.6 | 1.7 | 12.0 | 11.6 | 3.0 | 18.3 | 12.5 | 13.7 | 26.7 | 11.4 | 9.6 |
| Female | 7.9 | 9.0 | 1.4 | 11.1 | 11.3 | 2.1 | 18.4 | 11 | 14.7 | 27.9 | 11.7 | 8.9 |
| Age group | ||||||||||||
| Less than 15 years | 5.8 | 10.4 | 0.9 | 12.6 | 9.9 | 2.4 | 27.5 | 17.2 | 22.1 | 33.2 | 17.3 | 13.3 |
| 15 to 24 years | 10.5 | 10.0 | 2.2 | 13.3 | 10.8 | 3.1 | 23.7 | 13.1 | 13.8 | 26.7 | 8.8 | 13.6 |
| 25 to 34 years | 10.6 | 10.2 | 1.2 | 13.1 | 14.4 | 3.2 | 26.3 | 15.1 | 16.9 | 27 | 10.6 | 9.9 |
| 35 to 44 years | 7.0 | 11.6 | 2.1 | 13.1 | 11.1 | 2.4 | 29.7 | 17.2 | 19.2 | 32.3 | 17 | 8.5 |
| 45 to 54 years | 7.4 | 8.0 | 1.3 | 11.7 | 9.6 | 2.7 | 20.2 | 14.7 | 17.3 | 35.2 | 15.5 | 12.8 |
| 55 to 64 years | 8.4 | 6.9 | 1.6 | 9.5 | 12.5 | 1.6 | 14.4 | 12.1 | 14.2 | 29.6 | 9.7 | 8.9 |
| 65 years and older | 4.0 | 4.1 | 1.2 | 6.9 | 11.0 | 1.8 | 5.6 | 4.6 | 4.3 | 19.3 | 3.4 | 0.3 |
| Highest level of education | ||||||||||||
| Less than a high school diploma | 10.2 | 11.1 | 2.9 | 17.0 | 10.9 | 2.8 | 12.3 | 5.3 | 14.6 | 21.9 | 7.8 | 8.9 |
| High school diploma | 10.5 | 9.5 | 1.9 | 14.7 | 12.9 | 3.9 | 14.1 | 8.9 | 11.4 | 20.3 | 6.6 | 6.3 |
| Trades/college certificate | 8.3 | 8.9 | 1.4 | 13.1 | 13.5 | 2.5 | 17.5 | 12.3 | 13.5 | 26.9 | 10.1 | 8.2 |
| University degree | 6.6 | 7.6 | 1.1 | 7.8 | 9.8 | 2.0 | 18.9 | 12.4 | 8.5 | 26.8 | 16.3 | 7.4 |
| Marital status | ||||||||||||
| Married | 6.1 | 6.6 | 1.2 | 9.2 | 9.1 | 1.9 | 11.4 | 8.4 | 7.4 | 22.3 | 13.5 | 7.6 |
| Common law | 8.4 | 9.8 | 1.4 | 11.8 | 14.7 | 2.3 | 17.6 | 11.5 | 15.1 | 29.4 | 13.3 | 8.8 |
| Single (never married) | 9.4 | 10.2 | 1.6 | 14.0 | 11.9 | 3.0 | 23.9 | 15 | 19.3 | 29.5 | 11.9 | 11.2 |
| Separated | 16.3 | 29.3 | Note F: too unreliable to be published | 27.5 | 28.8 | Note F: too unreliable to be published | 20.5 | -2.5 | Note ...: not applicable | 17.9 | -6.2 | Note ...: not applicable |
| Divorced | 12.2 | 13.6 | 3.1 | 12.4 | 9.3 | 5.2 | 13 | 7.7 | 13.6 | 31 | 9.8 | 3.3 |
| Widowed | 6.0 | 5.9 | Note F: too unreliable to be published | 8.8 | 13.9 | Note F: too unreliable to be published | 5.9 | 2.2 | Note ...: not applicable | 17.4 | 2.1 | Note ...: not applicable |
| Economic family type | ||||||||||||
| Couple with no children | 4.8 | 5.8 | 0.7 | 7.9 | 9.6 | 1.4 | 9.8 | 7.4 | 5.8 | 20.6 | 7.9 | 6.1 |
| Couple with children | 8.1 | 9.3 | 1.0 | 12.3 | 9.8 | 2.3 | 15.2 | 13.1 | 15.1 | 27.9 | 17.8 | 10.9 |
| Lone parent | 15.4 | 13.5 | 3.7 | 18.4 | 21.7 | 5.3 | 30.7 | 20.5 | 26.2 | 35 | 5.1 | 14.9 |
| Other | 10.5 | 11.1 | 4.2 | 13.6 | 16.6 | 4.3 | 14.3 | 4.9 | 9 | 22.1 | 1.3 | 2.7 |
| Sexual orientation | ||||||||||||
| Heterosexual | 7.6 | 8.6 | 1.4 | 11.3 | 11.0 | 2.5 | 18.1 | 11.7 | 13.8 | 27.3 | 11.7 | 9 |
| Sexual minorities | 18.3 | 14.8 | 7.4 | 23.8 | 21.4 | 4.9 | 20.2 | 15.7 | 22.3 | 21.2 | 0.7 | 12.8 |
| Indigenous identity | ||||||||||||
| First Nations | 17.4 | 9.8 | 2.0 | 15.1 | 14.0 | 3.3 | 18.3 | 14.7 | 25.7 | 32.1 | 9.3 | 21 |
| Metis | 12.8 | 21.0 | Note F: too unreliable to be published | 18.1 | 10.3 | Note F: too unreliable to be published | 23.8 | 5.6 | Note ...: not applicable | 39.9 | 7.7 | Note ...: not applicable |
| Inuit | 6.9 | 5.9 | 3.3 | 11.5 | 3.5 | 3.6 | 36.8 | 17.5 | 34.9 | 48.2 | 22 | 35.8 |
| Non-Indigenous | 7.7 | 8.6 | 1.5 | 11.4 | 11.4 | 2.5 | 18 | 11.6 | 13.4 | 26.7 | 11.8 | 8.7 |
| Racialized group | ||||||||||||
| South Asian | 5.6 | 5.2 | Note F: too unreliable to be published | 11.6 | 23.1 | Note F: too unreliable to be published | 17.2 | 11.7 | Note ...: not applicable | 31.4 | 12.2 | Note ...: not applicable |
| Chinese | 4.6 | 2.8 | Note F: too unreliable to be published | 8.5 | 12.3 | Note F: too unreliable to be published | 8.4 | 3.7 | Note ...: not applicable | 16.8 | 23.4 | Note ...: not applicable |
| Black | 20.8 | 24.3 | Note F: too unreliable to be published | 26.7 | 27.4 | Note F: too unreliable to be published | 4.4 | 0 | Note ...: not applicable | 20.5 | -2.3 | Note ...: not applicable |
| Filipino | 16.6 | 6.3 | Note F: too unreliable to be published | 20.4 | 29.0 | Note F: too unreliable to be published | 26.1 | Note ...: not applicable | Note ...: not applicable | 19.2 | 26.6 | Note ...: not applicable |
| Latin American | Note F: too unreliable to be published | Note F: too unreliable to be published | Note F: too unreliable to be published | 11.5 | 12.3 | Note F: too unreliable to be published | Note ...: not applicable | Note ...: not applicable | Note ...: not applicable | 33.6 | 13.2 | Note ...: not applicable |
| Arab | Note F: too unreliable to be published | Note F: too unreliable to be published | Note F: too unreliable to be published | 17.8 | 37.2 | Note F: too unreliable to be published | Note ...: not applicable | Note ...: not applicable | Note ...: not applicable | 28.9 | 2.4 | Note ...: not applicable |
| Southeast Asian | Note F: too unreliable to be published | Note F: too unreliable to be published | Note F: too unreliable to be published | Note F: too unreliable to be published | Note F: too unreliable to be published | Note F: too unreliable to be published | Note ...: not applicable | Note ...: not applicable | Note ...: not applicable | Note ...: not applicable | Note ...: not applicable | Note ...: not applicable |
| West Asian | Note F: too unreliable to be published | Note F: too unreliable to be published | Note F: too unreliable to be published | Note F: too unreliable to be published | Note F: too unreliable to be published | Note F: too unreliable to be published | Note ...: not applicable | Note ...: not applicable | Note ...: not applicable | Note ...: not applicable | Note ...: not applicable | Note ...: not applicable |
| Korean | Note F: too unreliable to be published | Note F: too unreliable to be published | Note F: too unreliable to be published | Note F: too unreliable to be published | Note F: too unreliable to be published | Note F: too unreliable to be published | Note ...: not applicable | Note ...: not applicable | Note ...: not applicable | Note ...: not applicable | Note ...: not applicable | Note ...: not applicable |
| Japanese | Note F: too unreliable to be published | Note F: too unreliable to be published | Note F: too unreliable to be published | Note F: too unreliable to be published | Note F: too unreliable to be published | Note F: too unreliable to be published | Note ...: not applicable | Note ...: not applicable | Note ...: not applicable | Note ...: not applicable | Note ...: not applicable | Note ...: not applicable |
| Visible minority, n.i.e | Note F: too unreliable to be published | Note F: too unreliable to be published | Note F: too unreliable to be published | Note F: too unreliable to be published | Note F: too unreliable to be published | Note F: too unreliable to be published | Note ...: not applicable | Note ...: not applicable | Note ...: not applicable | Note ...: not applicable | Note ...: not applicable | Note ...: not applicable |
| Multiple visible minorities | Note F: too unreliable to be published | Note F: too unreliable to be published | Note F: too unreliable to be published | Note F: too unreliable to be published | Note F: too unreliable to be published | Note F: too unreliable to be published | Note ...: not applicable | Note ...: not applicable | Note ...: not applicable | Note ...: not applicable | Note ...: not applicable | Note ...: not applicable |
| Non-racialized non-Indigenous | 7.7 | 9.0 | 1.3 | 10.4 | 8.8 | 2.0 | 18.5 | 11.6 | 14.4 | 26.9 | 7.3 | 8.9 |
| Immigrant status | ||||||||||||
| Immigrated 2012 to 2016 | 2.4 | 5.3 | Note F: too unreliable to be published | 9.8 | 12.2 | Note F: too unreliable to be published | 23.6 | 11.3 | Note ...: not applicable | 27.3 | 16.5 | Note ...: not applicable |
| Immigrated before 2012 | 9.1 | 8.6 | 2.8 | 15.3 | 24.3 | 3.9 | 16.3 | 11.9 | 6.0 | 27.0 | 12.6 | 5.4 |
| Canadian-born | 7.8 | 8.8 | 1.4 | 11.1 | 9.6 | 2.4 | 18.5 | 12 | 15.6 | 27.3 | 10.6 | 10.4 |
| Veteran | ||||||||||||
| Yes | 9.1 | 8.0 | Note F: too unreliable to be published | 18.8 | 24.1 | 15.5 | 16.6 | 17.7 | Note ...: not applicable | 21.8 | -8.3 | Note ...: not applicable |
| No | 8.1 | 8.6 | 1.6 | 11.2 | 11.4 | 2.3 | 16.4 | 10.2 | 12.4 | 25.9 | 10.4 | 8.2 |
|
... not applicable F too unreliable to be published
|
||||||||||||
- Date modified: