
Economic and Social Reports
Import prices and inflation in Canada
DOI: https://doi.org/10.25318/36280001202300600002-eng
Skip to text
Text begins
Abstract
This article examines to what extent the current high inflation in Canada was driven by the rise in import prices, and the key factors that have driven up import prices. By decomposing final domestic demand (FDD) inflation into the contributions from its domestic and import components, this article finds that the importance of import prices to FDD inflation has been increasing since the second quarter of 2021 and reached 50% by the end of 2022. The robust demand for imports and the large depreciation of the Canadian dollar against the U.S. dollar seem to have driven up import prices. Other external factors, such as geopolitical risks, also affected import prices. This is reflected by a jump in imported energy prices. In addition, import inflation is driven more by intermediates and capital imports rather than imports of consumption goods.
Keywords: inflation, import price
Authors
Weimin Wang is with the Economic Analysis Division, Analytical Studies and Modelling Branch, at Statistics Canada.
Acknowledgments
The author would like to thank David Boileau and Nguyen Luu from Global Affairs Canada, Fares Bounajm from the Bank of Canada, and Matthew MacDonald from Statistics Canada for their valuable comments and suggestions.
Introduction
Canada has been experiencing high inflation starting in early 2022. As stated in Statistics Canada (2023a), the Consumer Price Index (CPI) increased 6.8% on an annual average basis in 2022, accelerating from 3.4% in 2021 and 0.7% in 2020. It is also at a 40-year high since 1982. Excluding energy, the increase in the annual average CPI was 5.7% in 2022 and 2.4% in 2021.
Rising prices increased the cost of living for Canadians, especially those with a low and fixed income, as prices for essential items increased the most. For example, in 2022, the price of transportation, food and shelter increased 10.6%, 8.9% and 6.9%, respectively. Recent evidence suggests that the impact of inflation is being felt most by Canadians in the lowest income brackets.Note
Currently, monetary policy aims at getting inflation back down to the target range of 1% to 3%. For policy to work properly, policy makers need to understand the sources of the current high inflation. Canada is a small open economy with a high ratio of trade to gross domestic product (GDP). Canada’s ratios of exports and imports to GDP were about 34% in 2022. As a small open economy, Canada is vulnerable to, but has little influence on, global inflation pressures and supply constraints, suggesting that a rise in import prices may increase the overall price level. Over the period from the second quarter of 2021 to the fourth quarter of 2022, the implicit price index (IPI) of imports in Canada increased by more than 19%,Note while the CPI increased by 9% during the same period.
This article examines to what extent the current high inflation is impacted by rising import prices. As imported goods make up a significant portion of the consumption basket, a rise in import prices may lead to a large increase in the aggregate price level and hence inflation. A rise in import prices may also lead to higher production costs when businesses rely largely on imported goods and services as their production inputs. To maintain their profit margins, businesses may have to raise the price of their final products to “pass through” the rising costs to consumers.
Import prices are impacted by demand and supply factors. Canada experienced a robust growth in demand for imports during the period with high inflation. Year-to-year quarterly CPI inflation peaked in the second quarter of 2022. Over the period from the second quarter of 2021 to the second quarter of 2022, real imports increased by 10.8% and import prices increased by 14.5%. Rising import prices in Canada may have also been driven by various external factors, such as the appreciation of U.S. currency, the rise in commodity prices, changes in global geopolitical risks and economic conditions, and weather events.
By decomposing final domestic demand (FDD) inflation into the contributions from its domestic and import components, this article finds that FDD inflation was largely driven by import prices during the high inflation period. Import inflation accounted for about 50% of FDD inflation from the second to fourth quarters in 2022. This finding is consistent with the Bank of Canada’s Monetary Policy Reports that showed commodity prices and supply chain disruptions made large contributions to the deviation of CPI inflation from 2%.Note This article also finds that import inflation was largely driven by intermediates and capital imports rather than by imports of consumption goods. This is consistent with the fact that 70% of Canada’s imports are intermediates and capital.Note
Final domestic demand inflation and import prices
The total supply in an economy is the sum of GDP and imports, and the total demand is the sum of FDD and exports. The supply–demand balance at the aggregate level implies that
FDD consists of demand for final consumption and investment, and price changes in FDD measure the purchase power changes of consumption and investment spending. Hence, FDD is an alternative measure of inflation. Compared with CPI-based headline inflation, FDD inflation is broader in scope, as it measures not only price changes facing households but also price changes facing governments, non-profit institutions and investors. Chart 1 presents FDD inflation and CPI inflation for the past 10 years. Not surprisingly, FDD inflation and CPI inflation moved together most of the time.Note

Data table for Chart 1
| Final domestic demand inflation (log growth) | Consumer Price Index inflation (log growth) | |
|---|---|---|
| percent | ||
| 2012 | ||
| Quarter 1 | 2.16 | 2.31 |
| Quarter 2 | 1.79 | 1.57 |
| Quarter 3 | 1.43 | 1.21 |
| Quarter 4 | 1.17 | 0.94 |
| 2013 | ||
| Quarter 1 | 1.53 | 0.90 |
| Quarter 2 | 1.46 | 0.76 |
| Quarter 3 | 1.86 | 1.14 |
| Quarter 4 | 1.93 | 0.93 |
| 2014 | ||
| Quarter 1 | 2.09 | 1.38 |
| Quarter 2 | 2.50 | 2.20 |
| Quarter 3 | 2.26 | 2.06 |
| Quarter 4 | 2.32 | 1.91 |
| 2015 | ||
| Quarter 1 | 1.81 | 1.07 |
| Quarter 2 | 1.41 | 0.90 |
| Quarter 3 | 1.62 | 1.19 |
| Quarter 4 | 1.38 | 1.32 |
| 2016 | ||
| Quarter 1 | 1.35 | 1.53 |
| Quarter 2 | 1.08 | 1.54 |
| Quarter 3 | 0.79 | 1.22 |
| Quarter 4 | 1.02 | 1.38 |
| 2017 | ||
| Quarter 1 | 1.29 | 1.89 |
| Quarter 2 | 1.66 | 1.31 |
| Quarter 3 | 1.14 | 1.36 |
| Quarter 4 | 1.43 | 1.77 |
| 2018 | ||
| Quarter 1 | 1.17 | 2.04 |
| Quarter 2 | 1.33 | 2.27 |
| Quarter 3 | 1.97 | 2.65 |
| Quarter 4 | 1.65 | 2.02 |
| 2019 | ||
| Quarter 1 | 1.87 | 1.60 |
| Quarter 2 | 2.01 | 2.13 |
| Quarter 3 | 1.77 | 1.92 |
| Quarter 4 | 2.07 | 2.07 |
| 2020 | ||
| Quarter 1 | 1.99 | 1.79 |
| Quarter 2 | 1.47 | 0.02 |
| Quarter 3 | 1.64 | 0.27 |
| Quarter 4 | 1.66 | 0.78 |
| 2021 | ||
| Quarter 1 | 2.58 | 1.43 |
| Quarter 2 | 3.35 | 3.29 |
| Quarter 3 | 4.32 | 3.98 |
| Quarter 4 | 5.18 | 4.62 |
| 2022 | ||
| Quarter 1 | 5.92 | 5.67 |
| Quarter 2 | 6.42 | 7.28 |
| Quarter 3 | 5.75 | 6.91 |
| Quarter 4 | 5.21 | 6.45 |
| Source: Author’s calculation based on data from Statistics Canada tables 36-10-0104-01 and 18-10-0004-01. | ||
There are domestic components and imported components in FDD. The imported components consist of the final use of imports and the value of imports used as intermediate inputs in production. Once the price and quantity information for the imported components of FDD is known, the contribution of changes in import prices to FDD inflation can be estimated based on a Törnqvist price index formula,Note i.e.,
The left-hand side of equation (1) gives the log growth of the IPI of FDD, or FDD inflation, which is the weighted average of the log growth of import prices and the log growth of prices of the domestic components in FDD. The weights are the average nominal shares of each component in FDD over the same quarter in two consecutive years.
To estimate the contribution of changes in import prices to FDD inflation using equation (1), it is necessary to divide the total imports into two parts: imports in FDD and imports in exports. For this purpose, proportionality is assumed, i.e.,
It is also assumed that imports in FDD and imports in exports have the same price as total imports. The contribution of changes in import prices to FDD inflation can then be calculated. Although the price of the domestic component in FDD is not known, its contribution can be residually derived.
Chart 2 presents the decomposition of FDD inflation from 2018 onward. As shown, FDD inflation was stable at about 1% to 2% from 2018 to 2020. It started to increase from 1.7% in the fourth quarter of 2020 to 6.4% in the second quarter of 2022, then dropped to 5.2% in the fourth quarter of 2022. The increase in import prices lagged for three quarters but picked up quickly to 4.6% in the third quarter of 2021 from a negative growth in the previous quarter, then jumped to more than 10% in the four quarters of 2022. As a result, the contribution of changes in import prices to FDD inflation became significant during the high inflation period. It increased from 1.1 percentage points (or 25.3%) in the third quarter of 2021 to 3.3 percentage points (or 51.9%) in the second quarter of 2022 and 2.7 percentage points (or 51.0%) in the fourth quarter of 2022. This result implies that external factors are important determinants of the current high inflation in Canada. As domestic policies have limited influence on the external factors that affect import prices, the duration of the current high inflation may largely depend on global inflation pressures and supply constraints.

Data table for Chart 2
| Final domestic demand inflation | Contribution of import component | Contribution of domestic component | |
|---|---|---|---|
| percent | |||
| 2018 | |||
| Quarter 1 | 1.17 | -0.06 | 1.23 |
| Quarter 2 | 1.33 | 0.05 | 1.28 |
| Quarter 3 | 1.97 | 1.64 | 0.33 |
| Quarter 4 | 1.65 | 1.36 | 0.29 |
| 2019 | |||
| Quarter 1 | 1.87 | 1.17 | 0.70 |
| Quarter 2 | 2.01 | 0.83 | 1.18 |
| Quarter 3 | 1.77 | -0.04 | 1.81 |
| Quarter 4 | 2.07 | -0.19 | 2.26 |
| 2020 | |||
| Quarter 1 | 1.99 | 0.24 | 1.75 |
| Quarter 2 | 1.47 | -0.40 | 1.87 |
| Quarter 3 | 1.64 | -0.24 | 1.88 |
| Quarter 4 | 1.66 | -0.17 | 1.83 |
| 2021 | |||
| Quarter 1 | 2.58 | -0.75 | 3.33 |
| Quarter 2 | 3.35 | -0.08 | 3.44 |
| Quarter 3 | 4.32 | 1.09 | 3.23 |
| Quarter 4 | 5.18 | 1.73 | 3.46 |
| 2022 | |||
| Quarter 1 | 5.92 | 2.52 | 3.40 |
| Quarter 2 | 6.42 | 3.33 | 3.09 |
| Quarter 3 | 5.75 | 2.73 | 3.03 |
| Quarter 4 | 5.21 | 2.66 | 2.55 |
| Source: Author’s calculation based on data from Statistics Canada table 36-10-0104-01. | |||
The decomposition of equation (1) captures the impact of the changes in import prices through two channels: raising the price level of goods and services for final use, and increasing the production costs of businesses that use imported inputs, directly and indirectly. Equation (1) implicitly assumes that the rising production costs will be fully passed through to the output prices and hence gives an upper bound to the direct and indirect impact of rising import prices. When a firm uses imports to produce a product, the rise in the import prices would lead to a rise in the price of its output if the cost pass-through is positive. No matter if the output of the firm is for final or intermediate use, the impact of the import price should be captured when the total imports are used. Therefore, both direct and indirect effects are captured.
An alternative approach is to use detailed supply and use tables to examine the impact of a particular item of imports. However, in terms of the aggregate impact of all imports, this alternative approach and the one based on equation (1) may give similar results because both approaches capture the impact of a rise in the prices of imports for final consumption and for intermediate use in production. Both approaches need to assume the full pass-through of the rising production costs.
Rise in import prices
As previously mentioned, various factors may have an impact on import prices. One of these factors is the exchange rate, especially the Canada–U.S. exchange rate, as the United States is the main source of imports for Canada.
Chart 3 shows the quarterly import price index and the Canada–U.S. exchange rate from the first quarter of 2018 to the fourth quarter of 2022. As shown, there seemed to be little pass-through effect of the Canada–U.S. exchange rate in Canada’s import prices before the current high import inflation starting in the second quarter of 2021. After the second quarter of 2021, the Canadian dollar depreciated by 10.6% against the U.S. dollar, and import prices increased by 19.4%. The co-movement of import prices and the Canada–U.S. exchange rate after the second quarter of 2021 may suggest a pass-through effect of the depreciation of the Canadian dollar on import prices.

Data table for Chart 3
| Import price index | CAN$ per US$ (right scale) | |
|---|---|---|
| 2018 | ||
| Quarter 1 | 111.01 | 1.26 |
| Quarter 2 | 113.21 | 1.29 |
| Quarter 3 | 115.95 | 1.31 |
| Quarter 4 | 116.15 | 1.32 |
| 2019 | ||
| Quarter 1 | 116.15 | 1.33 |
| Quarter 2 | 116.92 | 1.34 |
| Quarter 3 | 115.76 | 1.32 |
| Quarter 4 | 115.27 | 1.32 |
| 2020 | ||
| Quarter 1 | 117.24 | 1.34 |
| Quarter 2 | 115.01 | 1.39 |
| Quarter 3 | 114.66 | 1.33 |
| Quarter 4 | 114.46 | 1.30 |
| 2021 | ||
| Quarter 1 | 113.70 | 1.27 |
| Quarter 2 | 114.59 | 1.23 |
| Quarter 3 | 120.09 | 1.26 |
| Quarter 4 | 122.98 | 1.26 |
| 2022 | ||
| Quarter 1 | 126.44 | 1.27 |
| Quarter 2 | 131.26 | 1.28 |
| Quarter 3 | 134.06 | 1.31 |
| Quarter 4 | 136.82 | 1.36 |
| Source: Author’s calculation based on data from Statistics Canada table 36-10-0104-01 and the Federal Reserve Bank of St. Louis (https://fred.stlouisfed.org/series/CCUSMA02CAQ618N). | ||
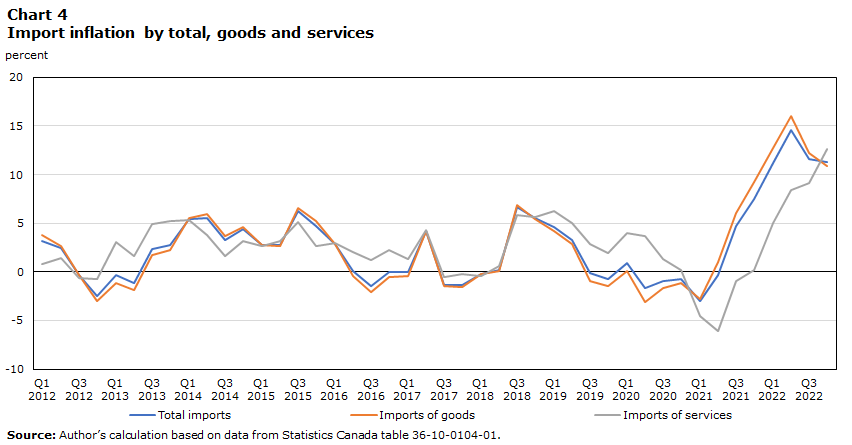
Changes in total import prices are usually driven by changes in the prices of imported goods, as the majority of imports are goods. In Canada, goods account for about 80% of total imports. Chart 4 presents the movements in total import inflation, inflation in imported goods and inflation in imported services for the past 10 years. As shown, the inflation in total imports and the inflation in imported goods are highly correlated. Their correlation coefficient is about 99.2%. This suggests that the movements in total import inflation and in the inflation in imported goods are almost the same.
Data table for Chart 4
| Total imports | Imports of goods | Imports of services | |
|---|---|---|---|
| percent | |||
| 2012 | |||
| Quarter 1 | 3.19 | 3.75 | 0.79 |
| Quarter 2 | 2.44 | 2.66 | 1.47 |
| Quarter 3 | -0.33 | -0.28 | -0.60 |
| Quarter 4 | -2.54 | -2.97 | -0.73 |
| 2013 | |||
| Quarter 1 | -0.35 | -1.16 | 3.10 |
| Quarter 2 | -1.19 | -1.86 | 1.61 |
| Quarter 3 | 2.38 | 1.77 | 4.93 |
| Quarter 4 | 2.80 | 2.21 | 5.25 |
| 2014 | |||
| Quarter 1 | 5.47 | 5.51 | 5.32 |
| Quarter 2 | 5.53 | 5.96 | 3.75 |
| Quarter 3 | 3.32 | 3.73 | 1.62 |
| Quarter 4 | 4.36 | 4.65 | 3.20 |
| 2015 | |||
| Quarter 1 | 2.72 | 2.73 | 2.70 |
| Quarter 2 | 2.76 | 2.67 | 3.17 |
| Quarter 3 | 6.26 | 6.54 | 5.15 |
| Quarter 4 | 4.74 | 5.25 | 2.63 |
| 2016 | |||
| Quarter 1 | 2.87 | 2.84 | 2.98 |
| Quarter 2 | 0.08 | -0.39 | 1.99 |
| Quarter 3 | -1.46 | -2.11 | 1.19 |
| Quarter 4 | 0.02 | -0.51 | 2.19 |
| 2017 | |||
| Quarter 1 | -0.05 | -0.40 | 1.35 |
| Quarter 2 | 4.24 | 4.23 | 4.27 |
| Quarter 3 | -1.31 | -1.50 | -0.57 |
| Quarter 4 | -1.31 | -1.58 | -0.24 |
| 2018 | |||
| Quarter 1 | -0.23 | -0.18 | -0.39 |
| Quarter 2 | 0.19 | 0.09 | 0.57 |
| Quarter 3 | 6.68 | 6.90 | 5.81 |
| Quarter 4 | 5.50 | 5.46 | 5.65 |
| 2019 | |||
| Quarter 1 | 4.64 | 4.21 | 6.27 |
| Quarter 2 | 3.27 | 2.82 | 4.98 |
| Quarter 3 | -0.16 | -0.95 | 2.86 |
| Quarter 4 | -0.76 | -1.46 | 1.89 |
| 2020 | |||
| Quarter 1 | 0.94 | 0.10 | 3.97 |
| Quarter 2 | -1.63 | -3.09 | 3.67 |
| Quarter 3 | -0.96 | -1.67 | 1.27 |
| Quarter 4 | -0.71 | -1.12 | 0.21 |
| 2021 | |||
| Quarter 1 | -3.02 | -2.79 | -4.58 |
| Quarter 2 | -0.36 | 1.01 | -6.05 |
| Quarter 3 | 4.74 | 6.06 | -0.94 |
| Quarter 4 | 7.44 | 9.18 | 0.16 |
| 2022 | |||
| Quarter 1 | 11.21 | 12.70 | 4.97 |
| Quarter 2 | 14.55 | 16.03 | 8.38 |
| Quarter 3 | 11.64 | 12.22 | 9.17 |
| Quarter 4 | 11.26 | 10.92 | 12.65 |
| Source: Author’s calculation based on data from Statistics Canada table 36-10-0104-01. | |||
The contribution of imported goods by commodity to inflation is examined using a variant of the Törnqvist price index, i.e.,
Equation (3) says that the log growth of the price of imported goods equals the weighted sum of the log growth of the price of each imported commodity, and the weights are the average nominal shares of each imported commodity in the same quarter in two consecutive years.
Using publicly available data from Statistics Canada’s website, the contribution of imported goods to inflation is estimated for 11 commodity groups for the period of the second quarter of 2021 to the fourth quarter of 2022. The results are presented in Table 1. As shown, the prices of imported energy products increased by 59.7% from the second quarter of 2021 to the fourth quarter of 2022, the highest among all commodity groups, followed by 28.2% for imported farm, fishing and intermediate food products; 25.2% for imported forestry products and building and packaging materials; 21.7% for imported basic and industrial chemical, plastic and rubber products; and 20.0% for imported industrial machinery, equipment and parts. On the other hand, import inflation for investment goods averaged lower during the period. In terms of contributions, 20.8% of inflation in imported goods over this period came from inflation in imported consumer goods, 19.0% came from inflation in imported energy products, 30.8% came from inflation in imported investment goodsNote and 29.5% came from inflation in imported intermediate inputs.Note The result suggests that while the rise in import prices will immediately affect inflation by increasing the price of energy and consumption goods for consumers, inflation will be more affected by the rising prices of imported investment goods and imported intermediate goods. This is consistent with the fact that 70% of Canada’s imports are intermediates and capital. However, consumer goods and energy products disproportionately contributed to the inflation in imported goods.
| Imported goods by commodity group | Second quarter of 2021 to fourth quarter of 2022 | |
|---|---|---|
| Log price growth | Contribution | |
| percent | ||
| Total imported goods (excluding special trade transactions) | 17.8 | 100.0 |
| Consumer goods | 17.8 | 20.8 |
| Energy products | 59.7 | 19.0 |
| Industrial machinery, equipment and parts | 20.0 | 12.8 |
| Basic and industrial chemical, plastic and rubber products | 21.7 | 10.1 |
| Motor vehicles and parts | 11.8 | 9.9 |
| Forestry products and building and packaging materials | 25.2 | 6.6 |
| Metal and non-metallic mineral products | 13.9 | 6.4 |
| Farm, fishing and intermediate food products | 28.2 | 5.7 |
| Electronic and electrical equipment and parts | 9.0 | 5.6 |
| Aircraft and other transportation equipment and parts | 13.2 | 2.4 |
| Metal ores and non-metallic minerals | 4.8 | 0.6 |
| Source: Author’s calculation based on Statistics Canada tables 12-10-0122-01 and 12-10-0125-01. | ||
Conclusion
Evidence in this article shows that import prices played an important role in increasing inflation in Canada because of the country’s reliance on imported goods and services. As a trading nation, Canada imports a large share of the goods it consumes, including energy products, consumer goods, raw materials and capital equipment. Therefore, a rise in the prices of these imports can significantly reduce the purchasing power of consumers and raise production costs and hence output prices.
Given the importance of the rise in import prices, the monitoring of import prices and a global coordination on inflation control become essential for maintaining price stability and supporting the overall health of the Canadian economy.
References
Bank of Canada. (2022). Monetary Policy Report: October 2022.
Bank of Canada. (2023). Monetary Policy Report: January 2023.
Statistics Canada. (2023a, January 17). Consumer Price Index: Annual review, 2022. The Daily.
Statistics Canada. (2023b). Table 36-10-0104-01 Gross domestic product, expenditure-based, Canada, quarterly (x 1,000,000) [Data table].
Statistics Canada. (2023c). Table 12-10-0143-01 International merchandise trade by Broad Economic Categories and top sixty trading partners (x 1,000) [Data table].
Uppal, S. (2023). Rising Prices and the Impact of the Most Financially Vulnerable: A Profile of those in the Bottom Family Income Quintile. (Insights on Canadian Society) Statistics Canada.
- Date modified: