
Economic and Social Reports
Do university-educated immigrants recover economically from a slow start?
DOI: https://doi.org/10.25318/36280001202300500003-eng
Skip to text
Text begins
Abstract
The selection of highly educated immigrants is based in part on the premise that they can better adapt to the labour market and will have, on average, better economic outcomes than less-educated immigrants. Earlier research indicates that this is the case. However, some university-educated immigrants have a slow start in the initial years after immigration. Little Canadian research has considered whether these immigrants eventually catch up with similarly educated immigrants who have early economic success. Likewise, it is unknown whether they outperform less-educated immigrants. Using the Longitudinal Immigration Database, this study looks at the long-term economic outcomes of university-educated economic principal applicant immigrants who immigrated at the ages of 20 to 44 during the period from 1990 to 2014 by their earnings level in the initial years after immigration. The analysis finds that, in the third year after immigration, those who had no earnings or the lowest earnings during the first two years after immigration experienced large observed negative earnings gaps compared with those who had higher initial earnings. This group also earned less than the average earnings among principal applicants with a high school education or less, although this gap was eliminated by the seventh or eighth year after immigration. The gap between university-educated immigrants with no or low initial earnings and their counterparts with high initial earnings persisted, although it was considerably reduced with years since migration. The university-educated principal applicants with high initial earnings earned 3.5 to 4.8 times more than those with no initial earnings or the lowest initial earnings three years after landing; by year 15, this was reduced to 1.6 to 2.0 times more, which is still a significant gap. These general patterns held across different economic classes (e.g., Federal Skilled Worker Program, provincial programs and Canadian Experience Class). Multivariate analyses found that differences in background characteristics explained little of the observed gap in any given year, or of the change in the gap over time. Most of the explanation for the gap, and the persistence of a gap after many years in Canada, rests with other factors that are not empirically examined in this study, including (1) unobserved characteristics such as motivation, interpersonal skills, and the quality of the university education or job experience; (2) the inability to sufficiently improve human capital for a host of possible reasons; or (3) the possibility of scarring, whereby a poor initial employment experience leads to poorer economic outcomes in the longer run. It is likely that all these possibilities play some role in the persistent gap.
Keywords: economic immigrants, earnings, university education
Authors
Eden Crossman and Garnett Picot are with the Research and Evaluation Branch at Immigration, Refugees and Citizenship Canada. Feng Hou is with the Social Analysis and Modelling Division, Analytical Studies and Modelling Branch, at Statistics Canada.
Acknowledgments
This study was conducted in collaboration with Immigration, Refugees and Citizenship Canada. The authors would like to thank Cédric de Chardon, Christopher Hamilton, Rebeka Lee, René Morissette and Tingting Zhang for their advice and comments on an earlier version of this paper.
Introduction
The selection of highly educated economic immigrants is based, in part, on the premise that they can better adapt to labour market change than less-educated immigrants. As a result, it is expected that they will experience superior economic outcomes in the longer run. Earlier research indicates that, on average, this premise holds (Picot, Hou & Qiu, 2016). However, little is known about whether it holds for all highly educated immigrants. Some university-educated immigrants may experience very poor economic outcomes—either no earnings or very low earnings—during the first few years in Canada.
While there has been considerable work on the average economic outcomes of university-educated immigrants, little is known regarding the array of such outcomes. How many have very good economic outcomes and how many have poor outcomes during the first couple of years in Canada? What does the economic future in Canada hold for those with poor initial outcomes? Is there a convergence over time with their initially more economically successful counterparts?
To address these questions, this study examines the association between earnings in the initial year after immigration and long-term earnings among university-educated immigrants, particularly the long-term economic outcomes of university-educated immigrants who had a slow start with respect to earnings in the initial years after immigration. Specifically, the paper focuses on (1) the distribution of the initial earnings status of university-educated principal applicants in the economic class; (2) whether the earnings gaps between the initially more and less successful close over time; (3) whether the tendency for the earnings gaps to close has improved with each successive entering cohort; (4) the extent to which immigrant background characteristics can explain the earnings gaps, and the potential narrowing of the gaps; and (5) whether there are differences between the immigrant classes (i.e., Federal Skilled Worker Program [FSWP], provincial programs and Canadian Economic Class [CEC]) in the earnings gaps and trajectories.
Background
Human capital model of immigrant selection
The human capital immigration selection model is based on the premise that higher-skilled immigrants have better economic outcomes than lower-skilled immigrants and a greater resiliency to adapt to changing labour market conditions (Section 12(1) of the 2001 Immigration and Refugee Protection Act). Education is one of the main criteria upon which the potential to become economically established is based (Bonikowska et al., 2015; Picot, Hou & Qiu, 2016). Evidence suggests that the Canadian human capital selection model has been quite successful in terms of the labour market outcomes of economic principal applicant immigrants (Organisation for Economic Co-operation and Development (OECD), 2019). The literature draws a clear link between highly skilled immigrants, particularly those with high education levels and a good command of one of the two official languages, and the ability to integrate into the Canadian labour market (e.g., OECD, 2017; Picot, Hou, & Qiu, 2016).
The human capital model predicts consistent and predictable patterns of immigrant labour market behaviours over time. Research regularly shows that immigrant labour market outcomes improve with time spent in Canada. Poorer economic outcomes during the early years in Canada are mostly attributed to new immigrants’ lack of human capital specific to the domestic labour market (e.g., limited official language knowledge, limited labour market information, foreign credential recognition challenges) and lack of professional and social networks. As the period of time spent in Canada increases, immigrants add domestic human capital to their foreign human capital by acquiring local labour market knowledge and skills.
Traditionally, attaining a university education has been a key measure of human capital and a good predictor of success in the labour market among immigrants. Education has been used as a key criterion in immigration selection in Canada, and the educational level of new economic immigrants has increased much faster than among the Canadian-born population in recent decades. The expectation is that higher educational levels allow immigrants to bring the skills needed in a knowledge-based economy and to adjust better to both cyclical and structural changes in the labour market than those with lower educational levels. However, the earnings advantage among university-educated immigrants has changed in the recent past. Picot, Hou and Qiu (2016) found that the earnings advantage at entry for new immigrants with a university degree relative to that of people with a high school education decreased dramatically over the last 30 years. Nevertheless, university-educated immigrants had a much steeper earnings trajectory than immigrants with trades or a high school education; the earnings advantage among highly educated immigrants increased significantly with time spent in Canada. This pattern was observed for all immigrant classes and arrival cohorts. As a result, the authors suggested that short-run economic outcomes of immigrants are not good predictors of longer-run results, at least by educational attainment (e.g., the more highly educated continue to do better in the long run).Note
Average labour market outcomes mask considerable variation. Some higher-educated individuals enjoy good initial labour market outcomes; others earn much less than the average. One study found that in 2016, 35% of recent immigrants (immigrated to Canada 1 to 10 years earlier) with a university degree worked in jobs that required no more than a high school education, compared with 16% of Canadian-born youth (Hou, Lu & Schimmele, 2020).
What happens when a university-educated immigrant does not have early labour market success? There are two main schools of thought on the resulting longer-term earnings trajectories: (1) earnings catch-up or (2) continued inferior earnings outcomes because of either labour market scarring or unobserved heterogeneity, whereby unobserved characteristics that result in poor initial outcomes also negatively affect longer-term outcomes.
On the one hand, the resiliency to adapt to changing needs of the labour market would result in rapid growth in earnings. Skill sets related to in-depth knowledge in a field, general or transferable work skills, and soft skills can help immigrants achieve economic success over years spent in Canada. In addition, higher education is expected to help develop skills often referred to as transversal skills (OECD, 2017), including literacy and numeracy; problem solving, analytical reasoning and critical thinking; and social and emotional skills such as communication, teamwork, perseverance, initiative, leadership and self-organization. These are also essential to the success of individuals in the labour market. These skills may become more effective as immigrants stay longer in the receiving country and result in some catch-up among university-educated immigrants who had a slow start with respect to earnings in the labour market.
On the other hand, there is a body of research to suggest that the early employment experiences of skilled immigrants may have longer-term impacts on their labour market outcomes. The notion is that the more challenging the first job, the more skills and experiences will be accumulated within that job. This additional qualification further increases the opportunities for a higher-paying second job. In turn, a higher-paying second job will increase chances for a good third job, and so on (Belfi et al., 2021). Belfi et al. (2021, p. 5) argued that “problems in finding an initial job may result in a so-called scarring effect, which may form a negative signal for later employers. This is because there are certain norms regarding how an individual’s career develops over time and which achievements are appropriate given one’s career stage. The further one falls behind the ‘normal’ career timetable, the more likely one is to be viewed unfavourably by prospective future employers (Verbruggen et al., 2015).” The principle of path dependencyNote points to the importance of initial labour market experiences for longer-term economic outcomes—even among those with higher education. However, path dependency is difficult to empirically establish.Note
A recent study reported mixed results on the association between early adverse labour market experiences in the destination country and immigrants’ long-term earnings. Zhang and Banerjee (2021) found that part-time employment was negatively associated with long-term earnings trajectories, particularly for female immigrants, although they were unable to differentiate voluntary from involuntary part-time employment. They also found that male immigrants who were occupationally mismatchedNote in the medium term also faced a long-term wage penalty. However, months of joblessness and working in occupations outside their main occupation early on had little effect on longer-term economic outcomes. Based on the mixed findings, the authors argued that immigrants’ early difficulties regarding part-time employment had some effect on longer-term outcomes,Note although other factors were found to have little or no effect.
Finally, characteristics that are not captured and observed in the selection system, such as motivation, skill in interpersonal relations, education quality and other unobserved factors that affect earnings, can result in poor initial earnings, as well as continued inferior earnings outcomes in the longer run.
Transferability of foreign educational credentials
The higher the level of education, the easier it tends to be for immigrants to integrate into the labour market. Still, there appears to be a large element of non-transferability of education and work experience acquired overseas, particularly for immigrants from developing source countries (Li & Sweetman, 2014; Picot, Hou & Crossman, 2022). There may be a number of reasons for the non-transferability of some foreign education. First, it may be of lower quality than education obtained in Canada. Second, because Canadian employers may be risk averse and have imperfect knowledge of foreign credentials, full compensation may not be given to foreign credentials. Moreover, transferability of education can be severely limited by a lack of knowledge of either official language (e.g., Goldmann et al., 2011; Ferrer et al., 2006). Third, there may be discrimination against immigrant degree holders based on sociodemographic factors (Oreopoulos, 2011). Fourth, even conditional on education quality, there may be considerable variation in the abilities of university graduates.
To address issues of foreign credential recognition among skilled immigrants, the Government of Canada has introduced several initiatives over the past two decades. Banerjee et al. (2021, p. 359) described these initiatives, which “include regulations to ensure fair access for occupational licensing bodies, bridge training, mentorship programs, and professionally focused language training programs (Reitz, Curtis, & Elrick, 2014). In addition to these efforts, Canada has introduced various new economic immigration streams over the years in an attempt to address the problem of skill devaluation. These include the Canada Experience Class, the Provincial Nomination Program, and the Express Entry (EE) system, all designed with features to bring selection more closely in line with the actual needs of employers.”
In 2013, Canada introduced the requirement for a formal educational credential assessment (ECA) for applicants in the FSWP category to determine whether a foreign educational credential is authentic and equivalent to a completed credential in Canada. Banerjee et al. (2021) found that the ECA requirement is positively related to early employment rates and earnings for both male and female skilled worker immigrants. However, this effect was limited to those with no previous employment experience in Canada. Their study also found that, even with the ECA requirement, significant differences in the earnings of immigrants from different source regions remained.
Also, the share of economic immigrants with Canadian education has been rising. Over the 2000-to-2019 period, the share of new economic principal applicant immigrants with Canadian study experience increased from 6% to 38% (Crossman & Hou, 2022). Immigrants with Canadian study experience tend to be younger, more educated, more likely to speak an official language and much more likely to have pre-admission earnings in Canada than immigrants who did not study in Canada (Crossman & Hou, 2022). Crossman and Hou (2022) found that the benefit of Canadian study experience grew in the longer term and that, a decade after immigration, economic immigrants with at least one year of Canadian study experience had higher earnings than those without such experience.
Overall, higher education is expected to play a key role in the upskilling (improving existing skills) and reskilling (learning new skills) of individuals throughout their lives to enhance employability. University-educated immigrants are viewed as more adaptable to changing demands of the labour market. At the same time, there is variation in the initial labour market experiences of university-educated immigrants, and early outcomes may have longer-term individual economic consequences. Some of this may have to do with the transferability of foreign credentials or other factors, including heterogeneity of unobserved worker abilities. These compounding factors invite the question of what happens to university-educated immigrants who have a slow start in earnings after immigration. To what extent does early success matter?
Data, measures and methods
Data
This study used the Longitudinal Immigration Database (IMDB), which combines the landing records and annual tax information of immigrants (Statistics Canada, 2021). Immigrants who have filed at least one tax return since 1982 are included in the database. The landing records contain immigrant characteristics at the time of landing, including education, age, admission category (e.g., economic class, family class and refugee), source country and self-reported ability to speak an official language. Tax records provide information on annual income and place of residence. The IMDB data used in this study cover landing information up to 2020 and tax information up to 2019.
The analysis focused on principal applicants in the economic class who were aged 20 to 44 at the time of immigration and arrived in Canada from 1990 to 2014. The choice of 2014 as the last arrival year was to ensure immigrants’ earnings trajectories could be observed for at least five years after immigration. The upper age limit was chosen because the analysis traced immigrants’ earnings trajectories up to 20 years after immigration, and some immigrants would be approaching the common retirement age by then. About 87% of all economic principal applicants who arrived in the study period were aged 20 to 44 at landing. The analysis was further restricted to immigrants who filed income taxes in the first two years after immigration, since the first two years were used to define immigrants’ initial earnings status. This restriction excluded about 4% of economic principal applicants in the selected age range and arrival period who did not file income taxes in the first two years but did so in subsequent years. The analysis of earnings in the subsequent years included only immigrants who reported at least $500 (in 2019 constant dollars) in annual earnings in a given tax year.
Measures
The focal variable in this study was a seven-category combination of education levels and initial earnings status. This variable initially divided immigrants with at least a bachelor’s degree at landing into five groups, based on their maximum annual employment earnings in the first two years after immigration: no earnings in the first two years, the lowest earnings (with positive earnings less than or equal to half the national median earningsNote ), low earnings (more than half the national median earnings and less than or equal to the national median earnings), high earnings (more than the national median earnings and less than or equal to twice the national median earnings) and the highest earnings (more than twice the national median earnings). Following this, immigrants without a university degree were divided into two groups: with a high school education or less, and with a non-university postsecondary diploma.Note
The outcome variable was annual earnings (wages and salaries plus net self-employment income) in 2019 constant dollars. The log transformation of annual earnings was used in multivariate analysis.Note
The study used several control variables when comparing immigrants’ earnings trajectories by initial earnings status, including year of landing cohorts, sex, age at landing, official language knowledge at landing, levels of pre-landing Canadian earnings, years of pre-landing Canadian study experience, source region, school attendance after landing and province of residence. The landing cohorts were coded as five-year groups in the models for immigrants who arrived from 1990 to 2014, as two-year groups in subgroup analysis for immigrants who arrived in the 1990s or in the 2000s, and as one-year groups for immigrants who arrived from 2010 to 2014. Age at landing was coded as five groups in five-year intervals. Official language knowledge at landing was based on the combination of mother tongue and self-reported knowledge of official languages: English mother tongue, French mother tongue, other mother tongue but spoke English, other mother tongue but spoke French, other mother tongue but spoke English and French, and did not speak English or French.
The level of pre-landing Canadian earnings was based on an individual’s maximum annual earnings in Canada in the 10 years before acquiring permanent residency. This variable was coded into five levels against the national median employment earnings (measured in the year before landing): no pre-landing Canadian earnings, more than 0 and less than or equal to half of the national median earnings, more than half of the national median earnings and less than or equal to the national median earnings, more than the national median earnings and less than or equal to twice the national median earnings, and more than twice the national median earnings. Years of Canadian study experience before landing were based on the total duration of valid study permits an individual had before becoming a permanent resident.
Source region was coded into 14 categories: the United States, Central America, the Caribbean, South America, Northern Europe, Western Europe, Southern Europe, Eastern Europe, Africa, Southern Asia, Southeast Asia, Eastern Asia, Western Asia and others. School attendance after immigration was measured by months of attending full-time postsecondary education, derived from tax deductions for education.
Methods
The analysis started with a descriptive table showing the distribution of initial earnings status for university-educated economic principal applicants, by sex, by broad arrival cohort (the 1990s, 2000s, and 2010 to 2014) and by admission program (FSWP, provincial programsNote and the CEC) for the last cohort of 2010-to-2014 landings.Note The demographic characteristics of immigrants by initial earnings status were presented next.
In multivariate analyses, an ordinary least squares (OLS) regression model was constructed to estimate immigrants’ earnings trajectories starting from the third year after immigration (since the initial earnings status was based on earnings in the first two years). The model contains the seven-category initial status variable based on education levels and initial earnings status, years since immigration (in single years), the interaction between initial earnings status and years since immigration, and the selected control variables. The estimated earnings trajectories by initial earnings status were compared with the corresponding observed trajectories. The differences between the observed and estimated earnings trajectories reflect the effects of group differences in the control variables. The regression model was estimated for all economic principal applicants who arrived from 1990 to 2014; for men and women separately; for the three broad cohorts separately; and separately for the FSWP, provincial programs and the CEC in the 2010-to-2014 cohort.
Results
Outcomes during the first two years in Canada
The analysis begins by showing the share of all economic immigrants (principal applicants, as well as spouses and dependants) who had relatively poor early economic outcomes. This is to provide an overall picture of the distribution of initial earnings among all economic immigrants and establish some context for the subsequent analysis of principal applicants. Among all economic immigrants aged 20 to 44 who landed from 1990 to 2014, roughly one-half had either no earnings (19%) or the lowest earnings (28%) during the first two years in Canada (Table 1). The latter group includes those who earned up to one-half the national median annual earnings. Not surprisingly, there was a significant difference between principal applicants and their spouses and dependants in the share who were not working during the first two years, at 12% among principal applicants and 31% among spouses and dependants. Overall, a little over one-third of principal applicants had no earnings or the lowest earnings, compared with two-thirds of spouses and dependants. The less-educated economic immigrants tended to have poorer economic outcomes during the first two years: 54% of high school graduates had no earnings or the lowest earnings, compared with 43% of university graduates (Table 1).
| Number of observations | Earnings status in the first two years after immigration | |||||
|---|---|---|---|---|---|---|
| No earnings | Lowest earnings | Low earnings | High earnings | Highest earnings | ||
| number | percent | |||||
| All economic immigrants | ||||||
| Total | 1,702,000 | 19.4 | 27.8 | 26.0 | 19.6 | 7.3 |
| Less than high school | 263,300 | 27.9 | 30.6 | 27.4 | 12.3 | 1.9 |
| High school | 126,600 | 21.4 | 32.9 | 27.1 | 15.5 | 3.2 |
| Trades certificate | 121,000 | 18.6 | 27.4 | 29.2 | 20.2 | 4.7 |
| Non-university diploma | 201,200 | 17.9 | 29.0 | 29.2 | 19.3 | 4.5 |
| Bachelor's degree or higher | 989,900 | 17.2 | 26.2 | 24.4 | 22.1 | 10.1 |
| Principal applicants | ||||||
| Total | 1,049,400 | 12.0 | 24.0 | 28.3 | 25.3 | 10.5 |
| Less than high school | 109,900 | 15.1 | 25.6 | 35.1 | 20.4 | 3.7 |
| High school | 55,200 | 12.3 | 26.1 | 32.0 | 23.7 | 5.9 |
| Trades certificate | 74,900 | 10.9 | 23.0 | 32.6 | 26.6 | 6.9 |
| Non-university diploma | 124,800 | 11.0 | 24.7 | 33.0 | 24.9 | 6.5 |
| Bachelor's degree or higher | 684,600 | 11.8 | 23.5 | 25.5 | 26.1 | 13.0 |
| Spouses and dependants | ||||||
| Total | 652,600 | 31.2 | 33.9 | 22.3 | 10.5 | 2.1 |
| Less than high school | 153,400 | 37.1 | 34.1 | 21.8 | 6.4 | 0.6 |
| High school | 71,400 | 28.4 | 38.1 | 23.3 | 9.1 | 1.1 |
| Trades certificate | 46,100 | 31.1 | 34.5 | 23.6 | 9.8 | 1.0 |
| Non-university diploma | 76,400 | 29.3 | 36.1 | 23.0 | 10.2 | 1.4 |
| Bachelor's degree or higher | 305,300 | 29.4 | 32.2 | 21.9 | 13.1 | 3.4 |
| Source: 2020 Longitudinal Immigration Database. | ||||||
To assess change over time, the principal applicants were divided into three entry cohorts: those who landed during the 1990s, those who landed during the 2000s and those who landed from 2010 to 2014. Overall, there were small improvements in the initial outcomes of university-educated principal applicants.Note The share of those with no employment during the first two years declined marginally over the three cohorts, from 14% for the 1990s cohort to 10% for the early 2010s cohort (Table 2). There was no discernible trend regarding the share of principal applicants with the lowest initial earnings.
| Number of observations | Earnings status in the first two years after immigration | |||||
|---|---|---|---|---|---|---|
| No earnings | Lowest earnings | Low earnings | High earnings | Highest earnings | ||
| number | percent | |||||
| All | 684,600 | 11.8 | 23.5 | 25.5 | 26.1 | 13.0 |
| Sex | ||||||
| Men | 446,000 | 11.0 | 21.8 | 23.1 | 27.8 | 16.4 |
| Women | 238,600 | 13.4 | 26.6 | 30.1 | 23.1 | 6.9 |
| Landing cohorts | ||||||
| 1990 to 1999 | 155,100 | 13.7 | 21.2 | 21.1 | 27.2 | 16.8 |
| 2000 to 2009 | 333,800 | 11.9 | 25.4 | 26.2 | 25.2 | 11.4 |
| 2010 to 2014 | 195,700 | 10.2 | 22.0 | 28.0 | 27.0 | 12.9 |
| Admission program in the 2010-to-2014 cohort | ||||||
| Federal Skilled Worker Program | 62,700 | 14.2 | 24.6 | 23.8 | 24.2 | 13.2 |
| Provincial programs | 93,100 | 10.3 | 23.2 | 27.8 | 27.4 | 11.3 |
| Canadian Experience Class | 19,300 | 3.4 | 8.7 | 16.1 | 39.2 | 32.6 |
| Other economic classes | 20,600 | 3.6 | 20.9 | 52.4 | 21.9 | 1.3 |
| Source: 2020 Longitudinal Immigration Database. | ||||||
The 2010-to-2014 cohort is used to assess the difference among immigrant classes in early outcomes. Early outcomes were poorest among federal skilled workers (39% had no earnings or the lowest earnings), somewhat better among provincial nominees (34%) and best among CEC immigrants (12%; Table 2).Note
Interestingly, a significant proportion of principal applicants had very successful economic outcomes during the first two years, earning more than twice the national median annual earnings (the highest earnings category). However, the share with such outcomes declined from the 1990s cohort to the early 2010s cohort, from 17% to 13% (Table 2). The CEC generated the highest share of highest earners (at one-third), followed by the FSWP (13%) and the provincial programs (11%).
Economic principal applicants with poor initial earnings outcomes differed in a number of ways from those with early success (Table 3). Those with no earnings or the lowest earnings tended to be older, more likely not to speak English or French, and less likely to have English or French as their mother tongue. The largest difference between the two groups was related to Canadian work experience before landing. The share of principal applicants with such experience was relatively small among those with no earnings (8%) or the lowest earnings (17%), compared with much larger shares among those with higher earnings (33%) and among those with the highest earnings (49%). Immigrants with poorer initial earnings outcomes were also less likely to have Canadian study experience. Source country also played a role, and principal applicants with superior early earnings were more likely to come from Western and Northern Europe and less likely to come from Africa, Eastern Asia and Western Asia (Table 3).
| Earnings status in the first two years after immigration | |||||
|---|---|---|---|---|---|
| No earnings | Lowest earnings | Low earnings | High earnings | Highest earnings | |
| percent | |||||
| Men | 59.0 | 60.1 | 58.8 | 69.2 | 81.6 |
| Age at immigration | |||||
| 20 to 24 | 1.1 | 2.1 | 2.5 | 3.5 | 2.1 |
| 25 to 29 | 16.8 | 23.7 | 25.7 | 31.1 | 26.0 |
| 30 to 34 | 31.6 | 33.0 | 32.3 | 31.9 | 33.6 |
| 35 to 39 | 29.7 | 25.3 | 23.9 | 21.4 | 24.3 |
| 40 to 44 | 20.9 | 16.0 | 15.5 | 12.1 | 14.0 |
| Educational level at immigration | |||||
| Bachelor's degree | 65.8 | 67.7 | 74.2 | 69.9 | 57.5 |
| Master's degree | 28.6 | 28.7 | 23.3 | 25.6 | 31.2 |
| Doctorate | 5.6 | 3.7 | 2.5 | 4.5 | 11.3 |
| Self-reported official language ability | |||||
| Not speaking English or French | 15.4 | 15.0 | 9.7 | 7.2 | 4.7 |
| Other mother tongue, speaking English and French | 21.0 | 18.6 | 14.0 | 12.4 | 8.8 |
| Other mother tongue, speaking French | 6.2 | 4.7 | 2.9 | 1.6 | 0.6 |
| Other mother tongue, speaking English | 51.8 | 54.7 | 65.1 | 64.8 | 61.0 |
| Mother tongue French | 2.4 | 4.2 | 4.5 | 6.4 | 5.5 |
| Mother tongue English | 3.4 | 2.9 | 3.8 | 7.6 | 19.3 |
| With Canadian work experience | 7.6 | 17.2 | 26.4 | 32.9 | 49.1 |
| With Canadian study experience | 8.2 | 13.4 | 12.9 | 20.2 | 18.0 |
| Source region | |||||
| Central America | 0.9 | 0.9 | 1.0 | 1.5 | 1.8 |
| Caribbean | 0.9 | 1.3 | 1.3 | 1.4 | 1.1 |
| South America | 3.8 | 3.4 | 2.9 | 3.8 | 4.9 |
| Western Europe | 1.3 | 2.1 | 2.7 | 5.5 | 7.3 |
| Northern Europe | 3.3 | 2.8 | 2.3 | 3.8 | 9.9 |
| Southern Europe | 0.7 | 0.7 | 0.9 | 1.1 | 1.2 |
| Eastern Europe | 8.5 | 9.2 | 9.1 | 10.6 | 9.2 |
| Africa | 15.9 | 13.9 | 10.7 | 9.1 | 9.1 |
| Southern Asia | 13.1 | 17.2 | 19.5 | 19.7 | 20.1 |
| Southeast Asia | 3.6 | 9.1 | 24.9 | 18.6 | 7.0 |
| Eastern Asia | 29.6 | 26.8 | 17.3 | 16.4 | 14.2 |
| Western Asia | 16.9 | 11.8 | 6.6 | 6.6 | 7.4 |
| Other regions | 1.0 | 0.5 | 0.4 | 0.7 | 1.8 |
| United States | 0.4 | 0.4 | 0.4 | 1.2 | 4.8 |
| months | |||||
| Months attending postsecondary schools in the first two years after immigration | 3.2 | 4.2 | 2.0 | 1.0 | 0.5 |
| Source: 2020 Longitudinal Immigration Database. | |||||
Did those with poor initial outcomes close the earnings gap with those who had early success?
Unadjusted results
Do economic principal applicants with initially poor economic outcomes experience a partial or complete closing of the earnings gap with those who had been relatively more successful? To answer this question, median earnings for three different landing cohorts of principal applicants—the 1990s, 2000s and early 2010s cohorts—were tracked longitudinally to 2019. For university-educated economic principal applicants, early success status was determined by entry earnings during the first two years after immigration. Five categories of entry earnings, from no earnings to the highest earnings (see the Measures section for more details) were used. In addition, median earnings were tracked for two other groups: economic principal applicants entering with a non-university postsecondary certification, and those with a high school education or less.
The analysis first examined all economic principal applicants immigrating to Canada from 1990 to 2014. By the third year after immigration, median earnings were lowest among university-educated principal applicants who had no earnings or the lowest earnings (up to one-half of the national median earnings) during the first two years.Note The average earnings for this group were also lower than those of entering principal applicants with a high school education or less, or a non-university postsecondary certification (Chart 1). However, the earnings trajectory of university-educated principal applicants with no initial earnings or the lowest initial earnings was steeper than that of principal applicants with less than a university education. Even university-educated immigrants with the poorest initial outcomes appeared to adapt better to labour market conditions in the longer run than immigrants with less education. By roughly the eighth year after immigration, the median earnings of university-educated immigrants with poor initial earnings surpassed those of immigrants with a high school education or less.

Data table for Chart 1
| Years since immigration | Highest earnings | High earnings | Low earnings | Lowest earnings | No earnings | Non-university diploma | High school or less |
|---|---|---|---|---|---|---|---|
| 2019 dollars | |||||||
| 3 | 104,939 | 56,720 | 31,974 | 16,174 | 11,811 | 32,969 | 28,747 |
| 4 | 108,081 | 59,785 | 35,073 | 21,608 | 18,886 | 35,224 | 30,723 |
| 5 | 111,001 | 62,686 | 37,968 | 26,531 | 23,515 | 37,445 | 32,418 |
| 6 | 113,182 | 65,232 | 40,551 | 30,645 | 27,773 | 39,082 | 33,524 |
| 7 | 115,179 | 67,694 | 42,938 | 34,273 | 30,642 | 40,537 | 34,546 |
| 8 | 117,068 | 70,128 | 44,775 | 37,008 | 33,278 | 41,743 | 35,341 |
| 9 | 119,021 | 72,168 | 46,589 | 39,344 | 35,362 | 42,739 | 35,787 |
| 10 | 120,122 | 74,034 | 48,301 | 41,450 | 37,291 | 43,597 | 36,234 |
| 11 | 120,899 | 75,687 | 49,935 | 43,294 | 38,327 | 44,280 | 36,611 |
| 12 | 121,144 | 77,532 | 51,525 | 44,883 | 39,753 | 44,697 | 37,014 |
| 13 | 121,729 | 78,905 | 52,693 | 46,518 | 40,603 | 45,299 | 37,285 |
| 14 | 122,470 | 80,315 | 54,159 | 48,242 | 41,213 | 45,787 | 37,718 |
| 15 | 123,184 | 81,376 | 55,255 | 49,912 | 41,961 | 46,263 | 38,215 |
| 16 | 123,200 | 82,210 | 56,102 | 50,681 | 42,123 | 46,701 | 38,272 |
| 17 | 123,722 | 82,631 | 56,612 | 50,878 | 42,035 | 46,922 | 38,443 |
| 18 | 123,234 | 82,576 | 56,192 | 50,798 | 41,490 | 47,027 | 38,574 |
| 19 | 123,276 | 82,905 | 55,520 | 50,368 | 40,002 | 46,993 | 38,587 |
| 20 | 124,178 | 83,424 | 55,692 | 50,229 | 39,922 | 46,721 | 38,878 |
| Source: 2020 Longitudinal Immigration Database. | |||||||
This paper primarily focuses on the gap between university-educated principal applicants without initial earnings or the lowest initial earnings outcomes and those with high initial earnings outcomes. The median earnings gap (in ratio) between these groups narrowed significantly between year 3 and year 7 after immigration and then remained more or less stable (Table 4).
| Landing cohort and years since landing | Median earnings by initial earnings status | Difference in ratio | Difference in level | ||||||
|---|---|---|---|---|---|---|---|---|---|
| No earnings | Lowest earnings | Low earnings | High earnings | Highest earnings | High to no earnings | High to lowest earnings | High minus no earnings | High minus lowest earnings | |
| 2019 dollars | percent | 2019 dollars | |||||||
| 1990 to 2014 | |||||||||
| 3 | 11,800 | 16,200 | 32,000 | 56,700 | 104,900 | 4.8 | 3.5 | 44,900 | 40,500 |
| 7 | 30,600 | 34,300 | 42,900 | 67,700 | 115,200 | 2.2 | 2.0 | 37,100 | 33,400 |
| 15 | 42,000 | 49,900 | 55,300 | 81,400 | 123,200 | 1.9 | 1.6 | 39,400 | 31,500 |
| 20 | 39,900 | 50,200 | 55,700 | 83,400 | 124,200 | 2.1 | 1.7 | 43,500 | 33,200 |
| 1990 to 1999 | |||||||||
| 3 | 12,000 | 15,200 | 29,900 | 56,200 | 99,000 | 4.7 | 3.7 | 44,200 | 41,000 |
| 7 | 26,000 | 32,500 | 42,200 | 67,100 | 109,900 | 2.6 | 2.1 | 41,100 | 34,600 |
| 15 | 35,900 | 46,400 | 52,800 | 79,600 | 121,700 | 2.2 | 1.7 | 43,700 | 33,200 |
| 20 | 39,900 | 50,200 | 55,700 | 83,400 | 124,200 | 2.1 | 1.7 | 43,500 | 33,200 |
| 2000 to 2009 | |||||||||
| 3 | 11,700 | 15,900 | 31,900 | 56,000 | 105,400 | 4.8 | 3.5 | 44,300 | 40,100 |
| 7 | 31,500 | 34,400 | 43,100 | 67,900 | 117,200 | 2.2 | 2.0 | 36,400 | 33,500 |
| 15 | 47,400 | 51,900 | 57,000 | 82,700 | 124,800 | 1.7 | 1.6 | 35,300 | 30,800 |
| 2010 to 2014 | |||||||||
| 3 | 11,800 | 17,400 | 33,100 | 58,300 | 110,400 | 4.9 | 3.4 | 46,500 | 40,900 |
| 7 | 33,600 | 35,200 | 43,000 | 67,900 | 119,300 | 2.0 | 1.9 | 34,300 | 32,700 |
| Source: 2020 Longitudinal Immigration Database. | |||||||||
By the third year after immigration, the median earnings of those with initially high earnings were 4.8 times the earnings of those with no earnings initially (during the first two years). By the seventh year, the gap had declined significantly; this ratio fell to 2.2 and remained around 2.0 by year 15 and year 20 (Table 4). A similar pattern was observed for those with the lowest earnings initially. The earnings of those with initially higher earnings were 3.5 times the earnings of those with the lowest initial earnings, falling to 2.0 times higher by year 7, and then to around 1.7 times higher by year 20.
This pattern can also be examined using the difference in earnings levels rather than in the ratios. In this case, a significant decline in the gap was observed between years 3 and 7, as before, but then the gap remained constant or, in the case of those with no earnings, increased between years 7 and 20 (Table 4).
There is some evidence to suggest that there was a marginally greater decline in the gap among later cohorts than earlier cohorts. For example, among the 1990s cohort, by the seventh year after immigration, those with high initial earnings earned 2.6 times more than those with no initial earnings. Among the 2000s cohort, this ratio fell to 2.2, and to 2.0 among the 2010-to-2014 cohort. A similar pattern was observed for those with the lowest earnings (Table 4).
The overall finding based on the unadjusted (actual) results is that university-educated economic principal applicants who initially had no earnings or the lowest earnings substantially reduced the earnings gap with other principal applicants during the first seven or eight years after immigration. After that time, there was relatively little change in the earnings gaps, which remained considerable. By the 15th year after immigration, those with high initial earnings continued to earn from 1.6 to 2.0 times (or $31,000 to $44,000 in 2019 constant dollars) more than those with no initial earnings or the lowest initial earnings (Table 4). There was also some evidence to suggest that the gap was reduced marginally more among more recent cohorts.
Multivariate analysis
The difference in earnings trajectories between groups could be partly because of differences in their characteristics and place of residence. To account for such differences, an OLS regression was run with the log of earnings as a dependent variable. The primary independent variable has seven categories indicating the main groups of interest.Note The earnings trajectories were assessed for each of the seven groups. Control variables included landing cohort, sex, age at landing, official language knowledge at landing, levels of pre-landing Canadian earnings, years of pre-landing Canadian study experience, source region, school attendance after landing and province of residence. The model also included years since migration and the interaction between years since migration and initial earnings status. This model produces the adjusted earnings trajectories. For any given year, the difference between the unadjusted and adjusted log earnings indicates the extent to which the control variables account for the earnings gaps between groups. Regression models were run for the entire group of immigrants who arrived from 1990 to 2014, as well as those landing during the 1990s, the 2000s and from 2010 to 2014.
The coefficients in the model using all economic principal applicants who immigrated from 1990 to 2014 are shown in Appendix Table A.1. The sign and significance of coefficientsNote were as expected, except perhaps for the source region variable coefficients.Note
The adjusted log earnings of university-educated principal applicants with no initial earnings or the lowest initial earnings were initially below the adjusted log earnings of those with a high school education. However, the earnings trajectory was steeper for those with a university education. By the eighth or ninth year after immigration, the earnings of university-educated principal applicants with the poorest initial outcomes surpassed the average earnings of those with a high school education or less (Chart 2) and eventually reached the average log earnings of those with a non-university postsecondary certification (except those without initial earnings).
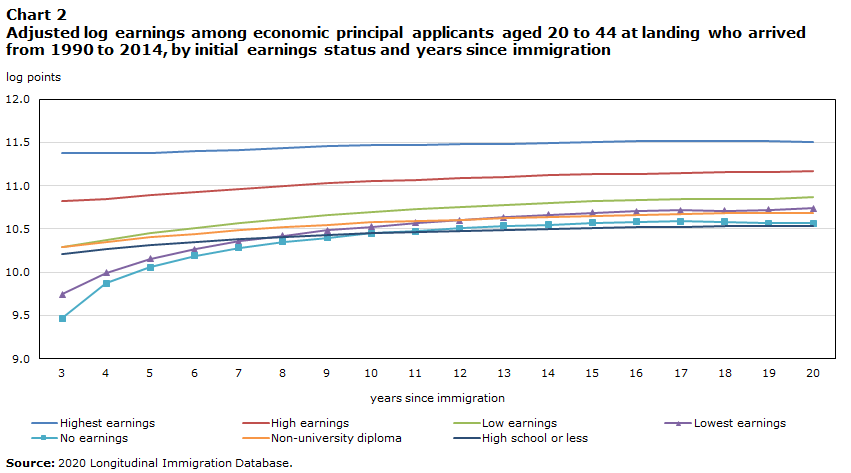
Data table for Chart 2
| Years since immigration | Highest earnings | High earnings | Low earnings | Lowest earnings | No earnings | Non-university diploma | High school or less |
|---|---|---|---|---|---|---|---|
| log points | |||||||
| 3 | 11.38 | 10.82 | 10.29 | 9.75 | 9.47 | 10.29 | 10.21 |
| 4 | 11.37 | 10.85 | 10.37 | 9.99 | 9.87 | 10.35 | 10.27 |
| 5 | 11.37 | 10.89 | 10.45 | 10.16 | 10.06 | 10.40 | 10.31 |
| 6 | 11.40 | 10.92 | 10.51 | 10.27 | 10.19 | 10.45 | 10.35 |
| 7 | 11.41 | 10.96 | 10.57 | 10.36 | 10.28 | 10.49 | 10.38 |
| 8 | 11.43 | 10.99 | 10.61 | 10.42 | 10.35 | 10.52 | 10.41 |
| 9 | 11.45 | 11.02 | 10.66 | 10.48 | 10.40 | 10.55 | 10.43 |
| 10 | 11.47 | 11.05 | 10.69 | 10.53 | 10.45 | 10.58 | 10.45 |
| 11 | 11.47 | 11.07 | 10.73 | 10.57 | 10.47 | 10.60 | 10.46 |
| 12 | 11.48 | 11.09 | 10.76 | 10.60 | 10.51 | 10.61 | 10.47 |
| 13 | 11.48 | 11.10 | 10.78 | 10.63 | 10.53 | 10.62 | 10.48 |
| 14 | 11.50 | 11.12 | 10.80 | 10.67 | 10.55 | 10.64 | 10.50 |
| 15 | 11.51 | 11.13 | 10.82 | 10.69 | 10.57 | 10.65 | 10.51 |
| 16 | 11.51 | 11.14 | 10.83 | 10.71 | 10.58 | 10.66 | 10.52 |
| 17 | 11.52 | 11.15 | 10.84 | 10.72 | 10.59 | 10.67 | 10.52 |
| 18 | 11.51 | 11.15 | 10.85 | 10.71 | 10.58 | 10.68 | 10.53 |
| 19 | 11.51 | 11.16 | 10.84 | 10.72 | 10.57 | 10.68 | 10.53 |
| 20 | 11.51 | 11.17 | 10.87 | 10.74 | 10.57 | 10.68 | 10.54 |
| Source: 2020 Longitudinal Immigration Database. | |||||||
Regarding changes over time in the earnings gap between university-educated economic principal applicants with poor and very good initial earnings outcomes, the adjusted results based on all principal applicants who immigrated over the 1990-to-2014 period show that, in year 3, those with high initial earnings earned 1.08 log points (or 194%) more than those with the lowest initial earnings (Table 5). By year 7, the gap had reduced significantly to 0.60 log points (or 83%), and it continued to decline to 0.45 log points (56%) by year 15 and to 0.43 (54%) by year 20.
| Landing cohort and years since landing | Log earnings by initial earnings status | Difference in log earnings | |||||
|---|---|---|---|---|---|---|---|
| No earnings | Lowest earnings | Low earnings | High earnings | Highest earnings | High minus no earnings | High minus lowest earnings | |
| log points | |||||||
| 1990 to 2014 | |||||||
| 3 | 9.47 | 9.75 | 10.29 | 10.82 | 11.38 | 1.36 | 1.08 |
| 7 | 10.28 | 10.36 | 10.57 | 10.96 | 11.41 | 0.68 | 0.60 |
| 15 | 10.57 | 10.69 | 10.82 | 11.13 | 11.51 | 0.56 | 0.45 |
| 20 | 10.57 | 10.74 | 10.87 | 11.17 | 11.51 | 0.60 | 0.43 |
| 1990 to 1999 | |||||||
| 3 | 9.42 | 9.66 | 10.21 | 10.77 | 11.33 | 1.35 | 1.11 |
| 7 | 10.11 | 10.25 | 10.50 | 10.89 | 11.36 | 0.79 | 0.64 |
| 15 | 10.39 | 10.56 | 10.72 | 11.03 | 11.40 | 0.64 | 0.47 |
| 20 | 10.46 | 10.63 | 10.76 | 11.05 | 11.38 | 0.58 | 0.42 |
| 2000 to 2009 | |||||||
| 3 | 9.44 | 9.71 | 10.27 | 10.81 | 11.38 | 1.36 | 1.09 |
| 7 | 10.27 | 10.33 | 10.55 | 10.94 | 11.40 | 0.67 | 0.61 |
| 15 | 10.61 | 10.67 | 10.80 | 11.11 | 11.47 | 0.50 | 0.44 |
| 2010 to 2014 | |||||||
| 3 | 9.44 | 9.79 | 10.33 | 10.82 | 11.30 | 1.39 | 1.04 |
| 7 | 10.36 | 10.40 | 10.60 | 10.96 | 11.32 | 0.60 | 0.55 |
| Source: 2020 Longitudinal Immigration Database. | |||||||
The adjusted results for the three separate cohorts—the 1990s, 2000s and 2010-to-2014 cohorts—were similar (Table 5).
It is quite plausible that some economic principal applicants experience initially poor outcomes and a continued large earnings gap with other principal applicants because of differences between them and others regarding official language ability at landing, pre-landing Canadian work experience, location of residence and other characteristics. The difference in any earnings gap between the adjusted and unadjusted results indicates the extent to which the control variables account for the initial observed gap (Table 6).
| Landing cohort and years since landing | Observed gap in log earnings | Adjusted gap in log earnings | Difference between observed and adjusted gaps | Difference as percentage of unadjusted gap | ||||
|---|---|---|---|---|---|---|---|---|
| High minus no earnings | High minus lowest earnings | High minus no earnings | High minus lowest earnings | High minus no earnings | High minus lowest earnings | High minus no earnings | High minus lowest earnings | |
| log points | percent | |||||||
| 1990 to 2014 | ||||||||
| 3 | 1.57 | 1.28 | 1.36 | 1.08 | 0.21 | 0.20 | 13 | 16 |
| 7 | 0.83 | 0.72 | 0.68 | 0.60 | 0.15 | 0.12 | 18 | 16 |
| 15 | 0.67 | 0.53 | 0.56 | 0.45 | 0.11 | 0.08 | 17 | 15 |
| 20 | 0.71 | 0.51 | 0.60 | 0.43 | 0.11 | 0.08 | 15 | 15 |
| 1990 to 1999 | ||||||||
| 3 | 1.52 | 1.28 | 1.35 | 1.11 | 0.17 | 0.17 | 11 | 13 |
| 7 | 0.92 | 0.74 | 0.79 | 0.64 | 0.13 | 0.10 | 15 | 14 |
| 15 | 0.77 | 0.56 | 0.64 | 0.47 | 0.13 | 0.09 | 17 | 16 |
| 20 | 0.71 | 0.51 | 0.58 | 0.42 | 0.13 | 0.09 | 18 | 17 |
| 2000 to 2009 | ||||||||
| 3 | 1.56 | 1.28 | 1.36 | 1.09 | 0.19 | 0.19 | 12 | 15 |
| 7 | 0.80 | 0.72 | 0.67 | 0.61 | 0.13 | 0.11 | 16 | 15 |
| 15 | 0.60 | 0.51 | 0.50 | 0.44 | 0.10 | 0.08 | 17 | 15 |
| 2010 to 2014 | ||||||||
| 3 | 1.63 | 1.27 | 1.39 | 1.04 | 0.25 | 0.24 | 15 | 19 |
| 7 | 0.79 | 0.72 | 0.60 | 0.55 | 0.19 | 0.17 | 24 | 23 |
| Source: 2020 Longitudinal Immigration Database. | ||||||||
To demonstrate this calculation, note that the university-educated economic principal applicants with the lowest earnings during the first two years had unadjusted earnings in year 3 that were 1.28 log points lower than the earnings of the high initial earners (Table 6). The adjusted results for this same comparison indicated a gap of 1.08 log points. Hence, the difference between the adjusted and unadjusted earnings gaps (0.20 log points) indicates that 16% of the earnings gap was accounted for by the control variables (i.e., 0.20/1.28). The remainder of the gap is attributable to unknown factors not included in the regression.
Regarding the gap between those with no initial earnings and high initial earnings, the proportion of the gap accounted for by the control variables was evaluated for selected years since landing (Table 6). The share of the observed gap accounted for by the control variables ranged from 11% to 24%. The same calculations were carried out for the gap between those with low initial earnings and high initial earnings. In this case, the share of the observed gap accounted for by the control variables ranged from 13% to 23%. In no case did the control variables account for a large proportion of the gap in any given year since immigration in any given cohort; other unknown factors accounted for most of the earnings gaps.
In terms of change over time in the gap, results were similar for the observed and adjusted earnings gapsNote (Table 6). This indicates that differences in characteristics between those with low and high initial earnings outcomes had little effect on the closing of the gaps. The partial closing of the gaps was primarily related to other unknown factors.
Furthermore, the adjusted results indicated that a significant earnings gap continued to exist, even after controlling for differences in the background variables noted earlier.
The above analyses were also done separately for male and female economic principal applicants who landed from 1990 to 2014, and the general patterns for both sexes were similar, with some minor differences. The gap in observed log earnings between those without earnings in the initial two years after immigration and those with high initial earnings was larger but narrowed more quickly over time among women than among men. Among women, the selected control variables accounted for 10% to 13% of the observed earnings gaps between those with no earnings or the lowest earnings and those with high earnings, depending on years since immigration. Among men, the corresponding shares were somewhat higher, from 13% to 19%.
Differences in the earnings gaps by admission class
Earnings trajectories vary by economic class. Earlier research found that federal skilled workers tended to have lower earnings outcomes initially than provincial nominees but surpassed them a few years after immigration. Members of the CEC had higher earnings initially than the other two classes, and this advantage tended to persist (Hou, Crossman & Picot, 2020). This section considers whether the tendency of immigrants who had no earnings or low earnings to catch up to those with initially high earnings varied by economic class, and whether the control variables played a different role across economic classes in explaining the earnings gap.
Overall, among the 2010-to-2014 cohort of economic principal applicants aged 20 to 44 at immigration, the earnings trajectories for the three economic classes resembled those reported earlier. In all three classes, principal applicants with no earnings or the lowest earnings did not catch up to the average earnings of those with a high school education or less and those with a non-university postsecondary education during the first seven years after immigration (Table 7), the longest period that can be reliably tracked for this cohort. However, for all three classes, the earnings difference between those with a university education with no or low initial earnings and high initial earnings decreased considerably with years since immigration. For example, among FSWP principal applicants, the unadjusted (actual) earnings of those with high initial earnings were 1.28 log points (260%) higher than the earnings of those with the lowest initial earnings at the third year after immigration. By the seventh year, this gap was reduced to a difference of 0.71 log points (103%, or roughly double). A similar pattern was observed for the other two classes, provincial programs and the CEC (Table 7). For all three programs, a significant gap remained by the seventh year after immigration. There were some differences by class. The early earnings gap (at year 3) between the more and less successful university-educated principal applicants was greatest in the provincial programs, followed by the FSWP. The CEC had the smallest early earnings gap between these groups (Table 7).
| Class/year since landing | Log earnings by initial earnings status | Difference in log earnings | |||||||
|---|---|---|---|---|---|---|---|---|---|
| No earnings | Lowest earnings | Low earnings | High earnings | Highest earnings | Non-university diploma | High school or less | High minus no earnings | High minus lowest earnings | |
| log points | |||||||||
| Federal Skilled Worker Program | |||||||||
| Observed | |||||||||
| 3 | 9.35 | 9.64 | 10.28 | 10.92 | 11.61 | 10.43 | 10.52 | 1.57 | 1.28 |
| 5 | 9.98 | 10.11 | 10.48 | 10.99 | 11.58 | 10.59 | 10.70 | 1.01 | 0.89 |
| 7 | 10.25 | 10.35 | 10.63 | 11.06 | 11.60 | 10.70 | 10.82 | 0.81 | 0.71 |
| Adjusted | |||||||||
| 3 | 9.46 | 9.76 | 10.32 | 10.89 | 11.45 | 10.43 | 10.47 | 1.43 | 1.12 |
| 5 | 10.08 | 10.20 | 10.51 | 10.95 | 11.42 | 10.58 | 10.64 | 0.87 | 0.75 |
| 7 | 10.35 | 10.42 | 10.65 | 11.02 | 11.44 | 10.69 | 10.75 | 0.67 | 0.60 |
| Provincial programs | |||||||||
| Observed | |||||||||
| 3 | 9.16 | 9.57 | 10.25 | 10.87 | 11.58 | 10.32 | 10.39 | 1.72 | 1.30 |
| 5 | 9.90 | 10.05 | 10.42 | 10.93 | 11.57 | 10.44 | 10.51 | 1.03 | 0.89 |
| 7 | 10.19 | 10.27 | 10.52 | 10.98 | 11.57 | 10.53 | 10.56 | 0.80 | 0.71 |
| Adjusted | |||||||||
| 3 | 9.43 | 9.80 | 10.33 | 10.79 | 11.20 | 10.33 | 10.35 | 1.36 | 1.00 |
| 5 | 10.09 | 10.21 | 10.48 | 10.85 | 11.19 | 10.43 | 10.46 | 0.76 | 0.65 |
| 7 | 10.37 | 10.42 | 10.60 | 10.93 | 11.22 | 10.54 | 10.53 | 0.56 | 0.51 |
| Canadian Experience Class | |||||||||
| Observed | |||||||||
| 3 | 9.68 | 9.74 | 10.29 | 10.91 | 11.65 | 10.61 | 10.74 | 1.23 | 1.17 |
| 5 | 10.13 | 10.18 | 10.45 | 10.98 | 11.64 | 10.70 | 10.82 | 0.86 | 0.80 |
| 7 | 10.38 | 10.38 | 10.51 | 11.03 | 11.71 | 10.76 | 10.87 | 0.65 | 0.65 |
| Adjusted | |||||||||
| 3 | 9.85 | 9.98 | 10.50 | 10.96 | 11.40 | 10.66 | 10.74 | 1.11 | 0.97 |
| 5 | 10.30 | 10.37 | 10.65 | 11.02 | 11.40 | 10.75 | 10.82 | 0.72 | 0.65 |
| 7 | 10.54 | 10.57 | 10.72 | 11.07 | 11.46 | 10.81 | 10.86 | 0.54 | 0.50 |
| Source: 2020 Longitudinal Immigration Database. | |||||||||
Perhaps more interestingly, the proportion of the earnings gap explained by the control variables was greatest in provincial programs (Table 7). For that class, 21% to 30% of the observed log earnings gap was accounted for by the control variables. For the FSWP, the control variables accounted for 9% to 18% of the observed gap and, for the CEC, 10% to 23%. The provincial programs had larger observed earnings gaps, but a higher percentage of the gap was explained by the control variables. Hence, the adjusted gaps (with control variables for background characteristics) were similar among the three classes. The difference among classes in the size and trajectories of the earnings gaps was primarily related to disparities in the observed characteristics of the immigrants selected in each of the classes. In particular, the larger earnings gaps between the more and less initially successful in the provincial programs were primarily related to greater differences in characteristics such as official language ability at landing, source region and pre-landing Canadian work experience. This greater variability in the characteristics of immigrants landing via the provincial programs resulted in greater gaps in earnings between the more and less successful.
Conclusion
Roughly one-third of university-educated economic principal applicants had no or low earnings during the first two years after immigration. This paper examined whether this group could close the earnings gap with both the university-educated economic principal applicants who experienced higher initial earnings outcomes and the less-educated economic principal applicants.
Results showed that the earnings trajectory of the university-educated principal applicants who had no or low initial earnings was steeper than that of less-educated principal applicants, suggesting better labour market adaptability, even among the university-educated immigrants with the poorest initial outcomes. The earnings of the university-educated principal applicants with the poorest initial outcomes surpassed the average earnings of those with a high school education within a few years. When only university-educated economic principal applicants are considered, those with the poorest initial outcomes reduced the initial earnings gap with the more successful by at least one-half within seven or eight years. However, significant earnings gaps between the initially less and more successful persisted in the longer run. These general findings held for immigrants entering via the FSWP, provincial programs and the CEC. However, the initial earnings gap between the more and less successful university-educated immigrants was greater among the provincial programs than the FSWP or CEC.
The analysis further demonstrated that the observed characteristics of economic principal applicants that were available in the data at time of landing explained only a small proportion of earnings gaps or the associated tendency of these gaps to converge.Note The persistence of earnings gaps may be related to a number of unknown factors affecting university-educated principal applicants with no or low initial earnings, including (1) unobserved characteristics such as motivation, interpersonal skills, and the quality of their university education or job experience; (2) the inability to sufficiently improve their human capital for a host of possible reasons; or (3) the possibility of scarring, whereby a poor initial employment experience causes poorer economic outcomes in the longer run. It is likely that all these possibilities play some role in the persistent gap. Overall, the results suggest that initial outcomes were associated with relative longer-term outcomes for university-educated economic principal applicants, since although the gap between the more and less economically successful was substantially reduced, it persisted.
Appendix
| 1990 to 2014 | 1990 to 1999 | 2000 to 2009 | 2010 to 2014 | |||||
|---|---|---|---|---|---|---|---|---|
| Coefficient | Standard error | Coefficient | Standard error | Coefficient | Standard error | Coefficient | Standard error | |
| Age at landing (reference 40 to 44) | ||||||||
| 20 to 24 | 0.168Note *** | 0.002 | 0.199Note *** | 0.002 | 0.152Note *** | 0.003 | 0.019Note *** | 0.005 |
| 25 to 29 | 0.195Note *** | 0.001 | 0.225Note *** | 0.001 | 0.188Note *** | 0.001 | 0.035Note *** | 0.003 |
| 30 to 34 | 0.161Note *** | 0.001 | 0.184Note *** | 0.001 | 0.151Note *** | 0.001 | 0.032Note *** | 0.002 |
| 35 to 39 | 0.102Note *** | 0.001 | 0.115Note *** | 0.001 | 0.092Note *** | 0.001 | 0.038Note *** | 0.003 |
| Official language (reference: mother tongue English) | ||||||||
| Not speaking English or French | -0.340Note *** | 0.001 | -0.433Note *** | 0.002 | -0.252Note *** | 0.003 | -0.244Note *** | 0.005 |
| Other mother tongue, speaking English and French | -0.160Note *** | 0.002 | -0.147Note *** | 0.003 | -0.153Note *** | 0.003 | -0.129Note *** | 0.005 |
| Other mother tongue, speaking French | -0.233Note *** | 0.002 | -0.262Note *** | 0.003 | -0.216Note *** | 0.003 | -0.235Note *** | 0.006 |
| Other mother tongue, speaking English | -0.223Note *** | 0.001 | -0.229Note *** | 0.002 | -0.209Note *** | 0.002 | -0.135Note *** | 0.004 |
| Mother tongue French | -0.054Note *** | 0.002 | -0.009Note * | 0.004 | -0.055Note *** | 0.004 | -0.068Note *** | 0.006 |
| Pre-landing Canadian earnings (reference: no) | ||||||||
| > 0 and <= 50% of national median earnings | -0.078Note *** | 0.001 | -0.087Note *** | 0.002 | -0.070Note *** | 0.002 | -0.058Note *** | 0.003 |
| > 50% national median, <= national median | -0.094Note *** | 0.001 | -0.113Note *** | 0.002 | -0.076Note *** | 0.002 | -0.051Note *** | 0.002 |
| > national median, <= twice national median | 0.109Note *** | 0.001 | 0.132Note *** | 0.002 | 0.097Note *** | 0.002 | 0.135Note *** | 0.003 |
| > twice national median | 0.440Note *** | 0.002 | 0.499Note *** | 0.004 | 0.421Note *** | 0.003 | 0.459Note *** | 0.004 |
| Years of Canadian study (reference: no) | ||||||||
| More than 0 to less than 1 | 0.006Note ** | 0.002 | 0.010Note *** | 0.003 | -0.016Note ** | 0.005 | 0.036Note *** | 0.008 |
| 1 to less than 2 | 0.051Note *** | 0.002 | 0.051Note *** | 0.003 | 0.052Note *** | 0.004 | 0.049Note *** | 0.005 |
| 2 to less than 3 | 0.127Note *** | 0.002 | 0.136Note *** | 0.003 | 0.120Note *** | 0.003 | 0.094Note *** | 0.005 |
| 3 to less than 4 | 0.149Note *** | 0.002 | 0.169Note *** | 0.003 | 0.138Note *** | 0.004 | 0.116Note *** | 0.005 |
| 4 to less than 5 | 0.190Note *** | 0.002 | 0.249Note *** | 0.004 | 0.177Note *** | 0.004 | 0.149Note *** | 0.005 |
| 5 or more | 0.138Note *** | 0.002 | 0.191Note *** | 0.003 | 0.118Note *** | 0.003 | 0.133Note *** | 0.004 |
| Source region (reference: United States) | ||||||||
| Central America | 0.131Note *** | 0.004 | 0.136Note *** | 0.006 | 0.149Note *** | 0.006 | 0.064Note *** | 0.011 |
| Caribbean | 0.098Note *** | 0.003 | 0.060Note *** | 0.005 | 0.164Note *** | 0.006 | 0.023Note * | 0.010 |
| South America | 0.226Note *** | 0.003 | 0.184Note *** | 0.005 | 0.268Note *** | 0.006 | 0.148Note *** | 0.010 |
| Western Europe | 0.117Note *** | 0.004 | 0.092Note *** | 0.005 | 0.120Note *** | 0.006 | 0.115Note *** | 0.010 |
| Northern Europe | 0.121Note *** | 0.003 | 0.118Note *** | 0.005 | 0.174Note *** | 0.005 | 0.059Note *** | 0.009 |
| Southern Europe | 0.281Note *** | 0.004 | 0.353Note *** | 0.005 | 0.202Note *** | 0.007 | 0.140Note *** | 0.012 |
| Eastern Europe | 0.198Note *** | 0.003 | 0.276Note *** | 0.005 | 0.155Note *** | 0.005 | 0.044Note *** | 0.010 |
| Africa | 0.134Note *** | 0.003 | 0.195Note *** | 0.005 | 0.117Note *** | 0.005 | 0.012 | 0.009 |
| Southern Asia | 0.047Note *** | 0.003 | 0.076Note *** | 0.005 | 0.052Note *** | 0.005 | -0.041Note *** | 0.009 |
| Southeast Asia | 0.169Note *** | 0.003 | 0.202Note *** | 0.005 | 0.147Note *** | 0.005 | 0.042Note *** | 0.009 |
| Eastern Asia | 0.062Note *** | 0.003 | 0.077Note *** | 0.005 | 0.053Note *** | 0.005 | -0.144Note *** | 0.009 |
| Western Asia | 0.054Note *** | 0.003 | 0.034Note *** | 0.005 | 0.074Note *** | 0.005 | 0.067Note *** | 0.009 |
| Other regions | -0.006 | 0.004 | 0.022Note *** | 0.005 | 0.053Note *** | 0.007 | 0.029Note * | 0.012 |
| Region of residence (reference: British Columbia) | ||||||||
| Territories | 0.330Note *** | 0.007 | 0.325Note *** | 0.012 | 0.357Note *** | 0.012 | 0.224Note *** | 0.015 |
| Atlantic region | 0.065Note *** | 0.003 | 0.042Note *** | 0.005 | 0.077Note *** | 0.004 | -0.005 | 0.006 |
| Quebec | -0.088Note *** | 0.001 | -0.089Note *** | 0.002 | -0.079Note *** | 0.002 | -0.114Note *** | 0.003 |
| Ontario | 0.071Note *** | 0.001 | 0.097Note *** | 0.001 | 0.053Note *** | 0.001 | 0.008Note ** | 0.002 |
| Manitoba | 0.077Note *** | 0.002 | 0.072Note *** | 0.004 | 0.094Note *** | 0.003 | -0.035Note *** | 0.004 |
| Saskatchewan | 0.166Note *** | 0.002 | 0.170Note *** | 0.006 | 0.197Note *** | 0.004 | 0.048Note *** | 0.004 |
| Alberta | 0.237Note *** | 0.001 | 0.214Note *** | 0.002 | 0.293Note *** | 0.002 | 0.084Note *** | 0.003 |
| Female | -0.205Note *** | 0.001 | -0.200Note *** | 0.001 | -0.193Note *** | 0.001 | -0.253Note *** | 0.002 |
| Months of attending full-time school | -0.071Note *** | 0.000 | -0.064Note *** | 0.000 | -0.074Note *** | 0.000 | -0.078Note *** | 0.000 |
Source: 2020 Longitudinal Immigration Database. |
||||||||
References
Baláž, V., & Williams, A. M. (2007). Path dependency and path creation perspectives on migration trajectories: The economic experiences of Vietnamese migrants in Slovakia. International Migration, 45(2), 37-67.
Banerjee, R., Hou, F., Reitz, J. G., & Zhang, T. (2021). Evaluating foreign skills: Effects of credential assessment on skilled immigrants’ labour market performance in Canada. Canadian Public Policy, 47(3), 358-372.
Belfi, B., Allen, J., Jacobs, B., Levels, M., & van Oosterhout, K. (2021). Early career trajectories of first- and second-generation migrant graduates of professional university. Journal of Ethnic and Migration Studies.
Bonikowska, A., Hou, F., & Picot, G. (2015). Which human capital characteristics best predict the earnings of economic immigrants? Statistics Canada, Analytical Studies Branch Research Paper Series. Catalogue no. 11F0019M - No. 368.
Crossman, E., & Hou, F. (2022). International students as a source of labour supply: Pre-immigration study in Canada and post-immigration earnings. Statistics Canada, Economic and Social Reports 2(2).
Crossman, E., Hou, F., & Picot, G. (2021). Are the gaps in labour market outcomes between immigrants and their Canadian-born counterparts starting to close? Statistics Canada, Economic and Social Reports 1(4).
Ferrer, A., Green, D.A., & Riddell, W.C. (2006). The effect of literacy on immigrant earnings. Journal of Human Resources, 41(2), 380–410.
Goldmann, G., Sweetman, A., & Warman, C. (2011). The portability of new immigrants’ human capital: Language, education and occupational matching. IZA Working Paper 5851.
Hou, F., Crossman, E., & Picot, G. (2020). Two-step immigration selection: Why did immigrant labour market outcomes vary by admission programs? Economic Insights, Statistics Canada. Catalogue no. 11-626-X — 2020015 - No. 117.
Hou, F., Lu, Y., & Schimmele, C. (2020). Recent trends in overeducation by immigration status in Canada: The impact of demographics, supply, and demand. International Migration, 59(3), 192-212.
Li, Q., & Sweetman, A. (2014). The quality of immigrant source country educational outcomes: Do they matter in the receiving country? Labour Economics, 26, 81-93.
OECD. (2019). Recruiting immigrant workers: Canada 2019. OECD Publishing, Paris.
OECD. (2017). In-depth analysis of the labour market relevance and outcomes of higher education systems: Analytical framework and country practices report. OECD Publishing, Paris.
Oreopoulos, P. (2011). Why do skilled immigrants struggle in the labor market? A field experiment with thirteen thousand resumes. American Economic Journal: Economic Policy, 3, 148–171.
Picot, G., Hou, F., & Crossman, E. (2022). Occupational outcomes of immigrants: Lower versus higher skilled jobs. IRCC Research Paper, Research and Evaluation Branch.
Picot, G., Hou, F., & Qiu, T. (2016). The human capital model of selection and long-run economic outcomes of immigrants in Canada. International Migration, 54(3), 73-88.
Reitz, J.G., Curtis, J., & Elrick, J. (2014). Immigrant skill utilization: Trends and policy issues. Journal of International Migration and Integration, 15(1), 1-26.
Statistics Canada. (2021). Longitudinal Immigration Database (IMDB) Technical Report, 2020. Analytical Studies: Methods and References. Catalogue no. 11-633-X — No. 036.
Verbruggen, M., van Emmerik, H., Van Gils, A., Meng, C., & de Grip, A. (2015). Does early-career underemployment impact future career success? A path dependency perspective. Journal of Vocational Behavior, 90, 101–110.
Zhang, T., & Banerjee, R. (2021). Bridges or barriers? The relationship between immigrants’ early labor market adversities and long-term earnings. International Migration Review, 55(4), 1169–1200.
- Date modified: