
Economic Insights
Two-step Immigration Selection: Why Did Immigrant Labour Market Outcomes Vary by Admission Programs?

Archived Content
Information identified as archived is provided for reference, research or recordkeeping purposes. It is not subject to the Government of Canada Web Standards and has not been altered or updated since it was archived. Please "contact us" to request a format other than those available.
Economic immigration in Canada consists of various admission programs, including the Federal Skilled Worker program (FSWP), Provincial Nominee Program (PNP) and Canadian Experience Class (CEC). These programs all select permanent residents based on their potential ability to do well in the labour market, but are administered differently and have different selection criteria and processes. CEC and PNP immigrants have higher employment rates and earnings than FSWP immigrants during the initial years after immigration, although PNP immigrants have lower earnings than CEC or FSWP immigrants five years after immigration. The more positive labour market outcomes of CEC and PNP immigrants are mostly associated with their higher levels of two-step selection—the selection of economic immigrants from among temporary foreign workers.
It is the fourth of five articles on the two-step selection process.
Introduction
The expansion of the Provincial Nominee Program (PNP) and the introduction of the Canadian Experience Class (CEC) have been a driving force for the development of two-step immigration selection—the process of selecting economic immigrants from among former temporary foreign workers. Under this two-step migration process, temporary foreign workers will gain Canadian work experience, and their skills and qualifications are evaluated and tested by Canadian employers. Their work experience increases their chances to qualify for economic immigration through the Federal Skilled Worker program (FSWP), Quebec Skill Worker (QSWP), and particularly PNP and CEC. While the CEC specifically targets temporary foreign workers with skilled work experience in Canada, low-skilled temporary foreign workers often rely on the PNP to transition to permanent residence (Hou and Picot 2016; Lu and Hou 2017). Since the early 2010s, the PNPs have evolved, and now place an emphasis on human capital criteria similar to that of the FSWP (IRCC 2017).
Previous studies show that immigrants who were selected through the PNP and CEC tended to have better initial labour market outcomes relative to other economic immigrants (Hou and Picot 2016; Lu and Hou 2020; Pandey and Townsend 2013). One possible explanation for the variation in economic outcomes across admission programs is their different use of the two-step selection approach. Virtually all CEC immigrants are skilled temporary foreign workers, because at least one year of skilled Canadian work experience is required for this program.Note Starting from the mid-2000s, the PNP has selected relatively much more immigrants from temporary foreign workers than the FSWP and QSWP (Hou, Crossman and Picot 2020a). Since immigrants who were former temporary foreign workers have higher employment rates and earnings than immigrants who were admitted directly from abroad (Hou and Bonikowska 2018; Hou and Picot 2016; Sweetman and Warman 2014), an admission program with a higher share of former temporary foreign workers would have better average labour market outcomes. Differences in human capital and source region composition could also result in different outcomes across admission programs.
This article examines the role of two-step selection in explaining differences in the short-term and medium-term outcomes of economic immigrants in four major admission programs: FSWP, PNP, QSWP, and CEC. These programs are devised to meet various national, regional and sectoral economic needs. The labour market outcomes of economic immigrants in these admission programs are of policy interest because they are often used as indicators of a program’s success. More importantly, the knowledge of which factors underlie the success of one program can help inform the improvement of other programs.
This is the fourth article of a series that provides a broad overview of the increasing importance of temporary foreign workers in the selection and labour market outcomes of immigrants. The first article provides an overview of the international and Canadian literature on the advantages and potential risks of two-step immigration selection (Crossman, Hou and Picot 2020). The second article documents the recent expansion of two-step immigration selection in Canada (Hou, Crossman and Picot 2020a). The third article examines whether the expansion of two-step selection accounts for most of the recent improvement in immigrants’ employment rates and entry earnings (Hou, Crossman and Picot 2020b). This article starts with a review of previous studies on immigrant economic outcomes by admission program. It further provides an updated analysis of how the level of two-step selection affects the labour market outcomes by admission class of economic immigrants.
Admission categories and immigrant labour market outcomes
Until the late 1990s, the Canadian Federal Skilled Worker Program (FSWP) was the primary stream of economic immigration, along with the smaller Québec Skilled Workers Program (QSWP). In an effort to improve the responsiveness of the immigration system to regional and sectoral skill shortages, the Canadian government created the Provincial Nominee Program (PNP) in 1998, and the Canadian Experience Class (CEC) in 2008 (Ferrer, Picot and Riddell 2014; IRCC 2015, 2017b). The PNPs are jointly administered by the federal and provincial governments. Provinces and territories nominate immigrants destined to their jurisdictions to meet their economic and population growth needs. Once nominated by a province, nominees are assessed by the federal immigration department following federal admissibility criteria (IRCC 2017). The CEC aims to increase Canada’s global competitiveness by attracting and retaining highly skilled workers and international graduates who have demonstrated their ability to integrate into the Canadian labour market (IRCC 2015). The CEC provides a direct pathway and fast tract to permanent residence for highly skilled workers and international graduates who have at least one year of skilled Canadian work experience (IRCC 2015; Alboim and Cohl 2012).
In 2015, Canada introduced the Express Entry (EE) system to manage the selection of four economic immigration programs: the FSWP, Federal Skilled Trades Program (FSTP), CEC and PNP (Government of Canada 2014). The EE system is designed “to speed up the processing of applications, improve the ability of the selection system to address labour-market needs, reduce the inventory (backlog) of applications, and enable selection of the best applicants” (Hiebert 2019, p4). Compared with the previous points system, the Comprehensive Ranking System used by the EE system to screen applicants puts much more weights on Canadian work experience and pre-arranged jobs. With the implementation of the EE, there have been some changes in the composition of admission class of economic immigrants. The share of immigrants admitted through the FSWP decreased from an average of 29% over the 2010 to 2014 period to 22% over the 2015 to 2018 period, the share of those admitted within provincial program (PNP and QSWP together) decreased from 50% to 46%, the share of those landing via CEC increased from 8% to 19%, while the share of those in other federal programs (e.g., FSTP, investors, entrepreneurs, and live-in caregivers) remained at 13% (Hou, Crossman and Picot 2020a).
Some previous studies have found immigrants entering through the PNP and CEC programs have better labour market outcomes than other economic immigrants, at least during the early years after landing in Canada. In an analysis of immigrants who landed between 1999 and 2009, Pandey and Townsend (2013) showed PNP immigrants had higher entry earnings than economic immigrants in the federal programs, although the gap disappeared in a few years after which the FSWP immigrants had higher earnings. Furthermore, in Alberta and British Columbia, where PNP immigrants were found to have the largest initial earnings advantages, applicants in these programs were required to have job offers. Hence, Pandey and Townsend (2013) speculated the initial earnings advantage of PNP immigrants was likely related to the job offers.
Focusing on immigrants landed in 1999 and 2010, Hou and Picot (2016) also found provincial nominees had much higher entry earnings (in the first full year after immigration) than FSWP immigrants, but this advantage was entirely accounted for by provincial nominees’ higher share with high pre-landing Canadian earnings.
An IRCC evaluation report compared the labour market outcomes of FSWP, PNP and CEC immigrant principal applicants arrived over the 2002 to 2014 period. In the initial years after immigration, the employment incidence was the highest among CEC immigrants, and the lowest among FSWP immigrants. The difference between PNP and CEC immigrants was generally small and disappeared five years after arrival. Similar ranking in earnings existed for the three admission programs, although the gaps were more substantial.Note
Lu and Hou (2020) found recent CEC immigrants with a university degree had a greater tendency to work in jobs requiring a university degree than FSWP immigrants with the same level of education in 2016. These authors suggested CEC immigrants resemble employer-sponsored immigrants in the United States in terms of employer involvement in selecting skilled temporary foreign workers. However, university educated PNP immigrants had a lower education-occupation match rate than FSWP immigrants, possibly because many PNP immigrants were former temporary foreign workers with low or medium skill jobs.Note
More specifically, Picot and Hou (2020) examined differences by admission program in skill utilization of recent economic immigrant principal applicants with a university degree in science, technology, engineering and mathematics (STEM) fields. Of the four programs (CEC, PNP, FSWP, QSWP), CEC immigrants had the highest share working in STEM occupations and the highest average earnings. PNP immigrants had the lowest share working in STEM occupations but the second highest average earnings. FSWP and QSWP immigrants had similar shares working in STEM occupations, falling between the CEC and PN programs.
Two-step immigration selection and economic outcomes by admission program
Using the Longitudinal Immigration Database (IMDB), this article provides an updated analysis of the extent to which differences in the use of two-step immigration selection explains the variation in labour market outcomes among economic immigrants in four main admission programs (CEC, PNP, FSWP, and QSWP). The analysis focuses on economic immigrant principal applicants aged 20 to 54 years at landing and who landed between 2009 (the first full year after the CEC was implemented) and 2016.Note The maximum level of pre-immigration Canadian earningsNote is used to capture the effect of two-step selection. Some previous studies used years of Canadian work experience or holding temporary work permits to indicate two-step selection. However, recent findings suggest that the actual pre-landing earnings (“realized market value of skills in Canada) are a better predictor of post landing earnings than simply using an indicator of previous work experience (Hou and Picot 2016 p320).
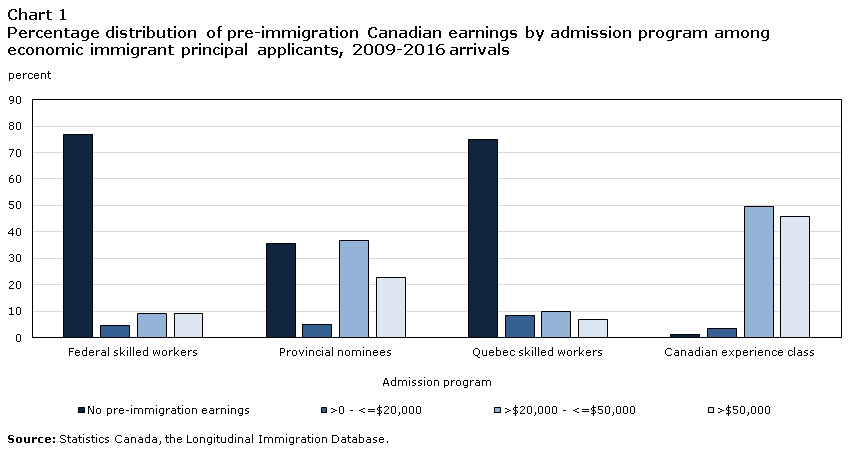
There are large differences in the levels of pre-immigration Canadian earnings among economic immigrant principal applicants in the four admission programs (Table 1). Over the 2009 to 2016 period, about three-quarters of FSWP and QSWP immigrants did not have pre-immigration Canadian earnings. In comparison, about two-thirds of PNP immigrants and essentially all CEC immigrants had pre-immigration Canadian earnings. Not surprisingly, nearly half of CEC immigrants had high earnings (over $50,000 in 2017 constant dollars) in Canada before obtaining permanent residence.
Data table for Chart 1
| Federal skilled workers | Provincial nominees | Quebec skilled workers | Canadian experience class | |
|---|---|---|---|---|
| percent | ||||
| No pre-immigration earnings | 77.0 | 35.6 | 74.9 | 1.1 |
| >0 - <=$20,000 | 4.7 | 4.9 | 8.3 | 3.5 |
| >$20,000 - <=$50,000 | 9.3 | 36.9 | 9.9 | 49.6 |
| >$50,000 | 9.0 | 22.6 | 6.9 | 45.8 |
| Source: Statistics Canada, the Longitudinal Immigration Database. | ||||
Table 1 presents the annual employment incidenceNote among economic immigrant principal applicants by admission program in the first full year (for the 2009 to 2016 arrivals) and fifth year (2009 to 2012 arrivals) after immigration. CEC and PNP immigrants had much higher observed employment incidences than FSWP immigrants, particularly in the first year, but also in the fifth year after immigration (2009 to 2012 cohort). For instance, the employment incidence for CEC immigrants was 15 percentage points higher in the first year, and 6 percentage points higher in the fifth year, than those of FSWP immigrants, respectively. However, differences in the employment incidence within each level of pre-immigration Canadian earnings, particularly in the medium and high earnings levels, were much smaller. This suggests that differences in the distribution of economic immigrants by pre-landing earnings play a significant role in explaining the differences among admission programs in the aggregate employment rates.
| Federal skilled workers | Provincial nominees | Quebec skilled workers | Canadian experience class | |
|---|---|---|---|---|
| percent | ||||
| First full year after immigration (2009-2016 arrivals) | ||||
| All | 80.1 | 92.5 | 76.7 | 95.0 |
| No pre-landing Canadian earnings | 76.2 | 85.3 | 71.1 | Table 1 Note ‡ |
| Low pre-landing Canadian earnings | 86.0 | 91.0 | 87.1 | 82.9 |
| Medium pre-landing Canadian earnings | 93.4 | 96.6 | 95.6 | 94.1 |
| High pre-landing Canadian earnings | 96.8 | 97.5 | 97.2 | 97.4 |
| Fifth year after immigration (2009-2012 arrivals) | ||||
| All | 85.6 | 91.5 | 87.4 | 91.9 |
| No pre-landing Canadian earnings | 84.4 | 87.5 | 86.5 | Table 1 Note ‡ |
| Low pre-landing Canadian earnings | 84.9 | 91.0 | 89.6 | 81.7 |
| Medium pre-landing Canadian earnings | 90.8 | 94.7 | 93.3 | 91.6 |
| High pre-landing Canadian earnings | 93.5 | 95.3 | 93.5 | 94.2 |
|
||||
Similar patterns are observed in annual earnings among employed economic immigrant principal applicants (Table 2). CEC immigrants earned 56% more than FSWP immigrants in the first full year after immigration, and 30% more in the fifth year. PNP immigrants had higher earnings than FSWP immigrants in the first year, but not in the fifth year after immigration. QSWP immigrants had the lowest earnings in both the first year and fifth year after immigration. These large differences by admission program became much smaller or even reversed when comparisons are made within each level of pre-immigration Canadian earnings. Again, this suggests that differences in the distribution of pre-landing earnings accounted for much of the variation in earnings among admission programs.
| Federal skilled workers | Provincial nominees | Quebec skilled workers | Canadian experience class | |
|---|---|---|---|---|
| 2017 constant dollars | ||||
| First full year after immigration (2009-2016 arrivals) | ||||
| All | 42,100 | 47,300 | 31,200 | 65,800 |
| No pre-landing Canadian earnings | 33,800 | 29,400 | 23,200 | Table 2 Note ‡ |
| Low pre-landing Canadian earnings | 30,000 | 33,300 | 27,000 | 30,300 |
| Medium pre-landing Canadian earnings | 40,000 | 37,900 | 39,000 | 38,200 |
| High pre-landing Canadian earnings | 101,200 | 88,800 | 86,100 | 96,500 |
| Fifth year after immigration (2009-2012 arrivals) | ||||
| All | 59,200 | 56,400 | 43,100 | 76,800 |
| No pre-landing Canadian earnings | 53,900 | 40,900 | 39,400 | Table 2 Note ‡ |
| Low pre-landing Canadian earnings | 58,600 | 47,000 | 46,100 | 51,400 |
| Medium pre-landing Canadian earnings | 54,900 | 48,300 | 51,100 | 51,300 |
| High pre-landing Canadian earnings | 113,500 | 99,200 | 102,500 | 110,400 |
Source: Statistics Canada, the Longitudinal Immigration Database. |
||||
To confirm this possibility, multivariate models are constructed with the employment incidence and earnings as the outcome variables. The explanatory variables include admission program, level of pre-immigration Canadian earnings, source region, education level, official language knowledge, whether studied in Canada,Note age at landing, province of residence, and population size of city of residence. A comparison of the observed and adjusted outcomes by admission class reveals the extent to which the observed differences can be accounted for by pre-immigration Canadian earnings and other covariates.
Table 3 presents the adjusted employment incidences and annual earnings. After accounting for differences among programs in the explanatory variables, there was little difference in the employment incidence by admission class in the first year after entry. This indicates that the explanatory variables accounted for the majority of the difference among immigrant classes in the observed rates. A further decomposition analysis shows that differences in the level of pre-immigration Canadian earnings was the single most important variable, accounting for 64% of the difference in the employment incidence between CEC and FSWP principal applicants in the first year after immigration.Note Focusing on the difference in employment rates between PNP and FSWP immigrants, the decomposition indicates the following: 43% of the difference was attributable to pre-immigration Canadian earnings, 19% to differences in source region, and 26% to differences in province of residence. The results of the decomposition analysis based on the fifth year after immigration show patterns similar to those for the first year results.
| First full year after immigration (2009-2016 arrivals) | Fifth year after immigration (2009-2012 arrivals) | |
|---|---|---|
| percent | ||
| Employment incidence | ||
| Federal skilled workers | 84.1 | 87.7 |
| Provincial Nominees | 84.6 | 85.6 |
| Quebec skilled workers | 86.4 | 90.7 |
| Canadian experience class | 83.9 | 87.6 |
| 2017 constant dollars | ||
| Annual earnings | ||
| Federal skilled workers | 45,800 | 59,500 |
| Provincial Nominees | 45,100 | 50,600 |
| Quebec skilled workers | 41,100 | 52,000 |
| Canadian experience class | 46,400 | 57,800 |
Source: Statistics Canada, the Longitudinal Immigration Database. |
||
The observed large differences in earnings by admission class also mostly disappeared after controlling for pre-immigration Canadian earnings and other covariates, indicating the explanatory variables explained most of the differences in actual earnings among immigrant programs. The difference in the share of immigrants with pre-immigration earnings accounted for all the earnings gap in the first year and 94% of the gap in the fifth year between CEC and FSWP immigrants. The story for the PNP-FSWP earnings gap is somewhat different. PNP immigrants’ did not have an advantage in adjusted earnings in the first year, and had lower adjusted earnings than FSWP immigrants in the fifth year. The observed initial advantage of PNP over FSWP immigrants in actual earnings was entirely due to a higher share with medium- and high-level pre-immigration Canadian earnings among PNP immigrants. It is not clear why five years after immigration PNP immigrants earned significantly less (about 15%) than FSWP immigrants with similar socio-demographic characteristics and pre-immigration Canadian work experience. One possibility is that many PNP immigrants were former temporary foreign workers who held low or medium-skilled jobs that typically have low wage growth. This possibility is supported by descriptive analysis of the occupational distribution among immigrants who arrived between 2010 and 2015 and reported an occupation in the 2016 census. Based on this analysis, the top 30 occupations of PNP immigrants included 12 sales and services occupations, and 9 senior managerial or professional occupations. In comparison, among the top 30 occupations for FSWP immigrants, 7 were sales or services occupations, while 15 were senior managerial or professional occupations.Note
The lower actual earnings and employment rates among QSWP immigrants were mostly due to province of residence. Most QSWP immigrants (85% in the first full year, and 81% in the fifth year) lived in Quebec where the employment incidence and earnings were generally lower for all economic immigrants than in other major immigrant destination provinces in the study period.Note
Summary
Over the 2009 to 2016 period, economic principal applicants selected through both the PNP and CEC programs had higher levels of entry (in the first full year) earnings and higher entry employment incidences than their counterparts selected via the FSWP. Much of this difference (between 43% and 100%) was due to a higher proportion of PNP and CEC immigrants having medium or high levels of pre-immigration Canadian earnings.
Five years after immigration, PNP and CEC immigrants continued to have employment incidences superior to those of FSWP immigrants. Again, these employment rate gaps were mostly accounted for by differences among admission programs in the share with pre-immigration Canadian earnings. When differences in the share with pre-immigration Canadian earnings were taken into consideration, CEC and FSWP immigrants had similar earnings five years after immigration. Put differently, FSWP immigrants would likely approach the success of CEC immigrants if they had the same level of pre-immigration Canadian earnings, even though they went through different selection processes. However, PNP immigrants had significantly lower earnings than FSWP immigrants five years after immigration. One possible explanation is that PNP immigrants may be more likely to be selected into low- or medium skilled jobs that tend to have slow earnings growth. These results support the argument of some previous research that it is not simply having pre-immigration Canadian work experience, but having high-skilled pre-immigration Canadian work experience that is a key indicator for post-immigration superior labour market outcomes (Hou and Picot 1996; Hou and Lu 2017).
References
Alboim, N., and K. A. Cohl. 2012.“Shaping the future: Canada's rapidly changing immigration policies”. Maytree Foundation.
Crossman, E., F. Hou and G. Picot. 2020. “Two-step immigration selection: A review of advantages and potential risks. Statistics Canada, to be released.
Ferrer, A. M., G. Picot and W. C. Riddell, 2014. “New directions in immigration policy: Canada's evolving approach to the selection of economic immigrants”.International Migration Review 48 (3): 846–867.
Government of Canada. 2014. Ministerial Instructions for the Express Entry Application Management System. Accessed March 18 2020.
Hiebert, D. 2019. The Canadian Express Entry System for Selecting Economic Immigrants: Progress and Persistent Challenges. Washington, DC: Migration Policy Institute.
Hou, F., and E. Crossman, and G. Picot. 2020a. “Two-step immigration selection: Recent development in Canada.” Statistics Canada, to be released.
Hou, F., and E. Crossman, and G. Picot. 2020b. “Two-step immigration selection: Recent trends in immigrant labour market outcomes.” Statistics Canada, to be released.
Hou, F., and A. Bonikowska. 2018. “Selections before the selection: the earnings advantage of host-country work experience before permanent residence.” International Migration Review 52 (3): 695-723.
Hou, F. and G. Picot. 2016. “Changing immigrant characteristics and pre-landing Canadian earnings: Their effect on entry earnings over the 1990s and 2000s.” Canadian Public Policy 42 (3): 308-232.
Hou, F. and Y. Lu. 2017. “International students, immigration and earnings growth: the effect of a pre-immigration host-country university education.” IZA Journal of Development and Migration 7 (5): 1-24. DOI: 10.1186/s40176-017-0091-5.
IRCC 2015. Evaluation of the Canadian Experience Class. Evaluation Division, Reference Number: E1-2013.
IRCC 2017. Evaluation of the Provincial Nominee Program. Evaluation Division, Reference Number: E1-2015.
Lu, Y., and F. Hou. 2017. Transition from Temporary Foreign Workers to Permanent Residents, 1990 to 2014. Analytical Studies Branch Research Paper Series, no. 389. Statistics Canada Catalogue no. 11F0019M. Ottawa: Statistics Canada.
Lu, Y. and F. Hou. 2020. “Immigration system, labor market structures, and overeducation of high-skilled immigrants in the United States and Canada.” International Migration Review DOI: 10.1177/0197918319901263.
Morissette, R. 2008. “Earnings in the last decade.” Perspectives. Statistics Canada — Catalogue no. 75-001-X. Ottawa: Statistics Canada.
Pandey, M., and J. Townsend. 2013. ‘‘Provincial nominee programs: An evaluation of earnings and settlement rates of nominees.’’ Canadian Public Policy 39 (4): 603–618.
Picot, G. and F. Hou. 2020. A Canada–US comparison of the economic outcomes of STEM Immigrants. Statistics Canada: to be released.
Statistics Canada. 2017. “Household income in Canada: Key results from the 2016 Census.” The Daily, September 13, 2017.
Sweetman, A., and C. Warman. 2014 “Former temporary foreign workers and international students as sources of permanent immigration.” Canadian Public Policy 40 (4): 392–407.
- Date modified: