
Economic and Social Reports
Recent developments in the Canadian economy: Fall 2022
DOI: https://doi.org/10.25318/36280001202201000001-eng
Skip to text
Text begins
This article provides an integrated summary of recent changes in output, consumer prices, employment and household finances. It highlights changes in the economic data during the first half of 2022 and into the summer months. The article also examines how economic conditions have changed as borrowing costs have risen.
The report is based on data that are publicly available as of October 3, 2022. Monthly information on government, business and financial market developments, including public health measures related to the pandemic, is available at Canadian Economic News (Statistics Canada n.d.). Monthly commentary on economic developments related to COVID-19 can be found at Canadian Economic Dashboard and COVID-19 (Statistics Canada n.d.).
Overview
Economic activity rose during the first two quarters of 2022 as consumer spending and business stockpiling contributed to growth. Export volumes rebounded in the second quarter as import volumes rose at their fastest pace since early in the pandemic. Investment in housing contracted sharply in the second quarter, while business outlays on structures and machinery and equipment continued to advance. Labour productivity remained below pre-pandemic levels while improvements in the terms of trade bolstered real income growth
Output and employment growth slowed during the spring months. Rising input costs and labour shortages continued to cloud the outlook as businesses and households adjust to higher borrowing costs. Headline consumer inflation reached a forty year high in June as inflationary pressures remained widespread. Household wealth posted a record decline in the second quarter as wealth inequality rose for the first time since the start of the pandemic.
Authors
Guy Gellatly and Carter McCormack work with the Strategic Analysis, Publications and Training division, Analytical Studies and Modelling Branch, Statistics Canada
Household spending and business stockpiling support economic growth
Real gross domestic product rose 0.8% in the second quarter, matching the gain in the first. Economic activity has expanded for four consecutive quarters, increasing by 4.6% over this period. Overall activity in the second quarter was 1.7% above pre-pandemic levels in late 2019.
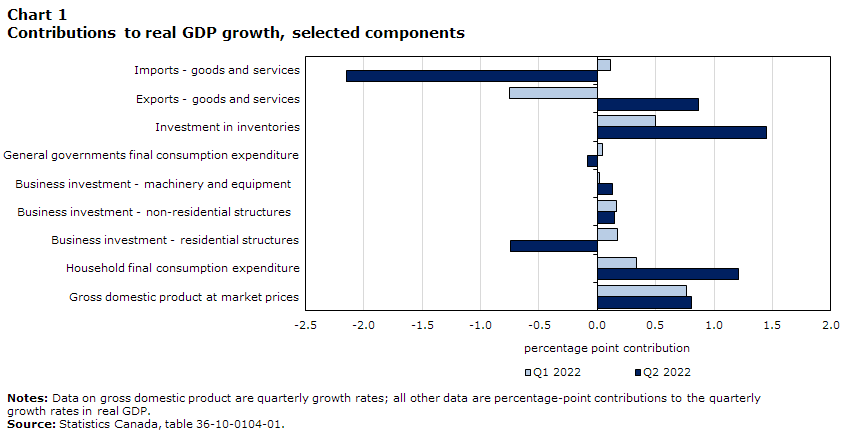
Data table for Chart 1
| Q1 2022 | Q2 2022 | |
|---|---|---|
| Gross domestic product at market prices | 0.765 | 0.807 |
| Household final consumption expenditure | 0.337 | 1.213 |
| Business investment - residential structures | 0.171 | -0.746 |
| Business investment - non-residential structures | 0.161 | 0.144 |
| Business investment - machinery and equipment |
0.018 | 0.129 |
| General governments final consumption expenditure | 0.044 | -0.08 |
| Investment in inventories | 0.495 | 1.45 |
| Exports - goods and services | -0.754 | 0.864 |
| Imports - goods and services | 0.113 | -2.15 |
|
Notes: Data on gross domestic product are quarterly growth rates; all other data are percentage-point contributions to the quarterly growth rates in real GDP. Source: Statistics Canada table 36-10-0104-01. |
||
Household spending and inventory accumulation supported economic growth during the first half of 2022 (Chart 1). After a modest increase in the first quarter, household outlays rose 2.3% in the second, led by higher spending on services and semi-durables, including clothing and footwear. Outlays on durables fell as price increases for big ticket items weighed on household purchases. Total household spending in the second quarter was 3.2% above pre-pandemic levels.
Business stockpiles rose sharply in the first half of 2022. Inventory accumulation contributed markedly to growth in the second quarter, supported by increases in machinery and building supplies and fertilizers. Farm inventories, bolstered by higher production of wheat and canola, posted their largest quarterly increase in over sixty years.
Non-residential business investment continues to recover during the first half of year (Chart 2). Combined business outlays on structures and machinery and equipment (M&E) have risen for five consecutive quarters as volumes approached pre-pandemic levels. Outlays on non-residential structures, buoyed by higher spending on energy projects, rose 2.7%, but remained about 4% below levels observed in late 2019. Investment in M&E, led by higher spending on transportation equipment, rose 4.5%, and was nearly 5% above its pre-pandemic baseline. Spending on intellectual property products increased after three consecutive quarterly declines.
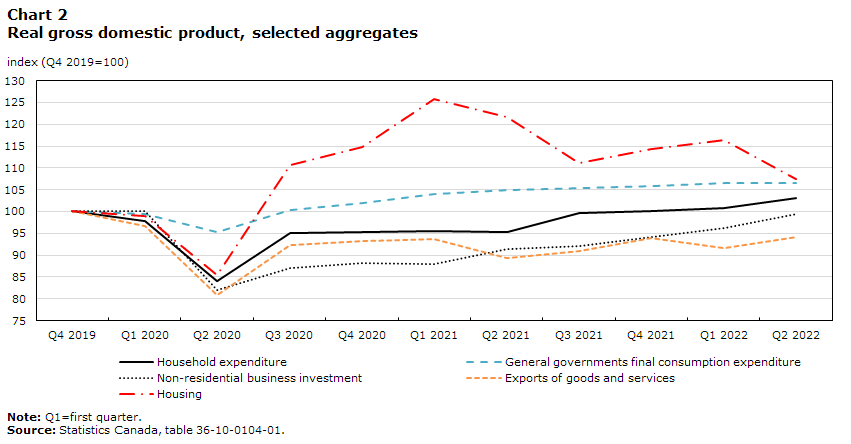
Data table for Chart 2
| Household expenditure | General governments final consumption expenditure | Non-residential business investment | Exports of goods and services | Housing | |
|---|---|---|---|---|---|
| 2019 | |||||
| Q4 | 100 | 100 | 100 | 100 | 100 |
| 2020 | |||||
| Q1 | 97.8 | 99.5 | 100.2 | 96.7 | 98.9 |
| Q2 | 84.2 | 95.3 | 81.9 | 80.8 | 85.5 |
| Q3 | 95.0 | 100.3 | 87.1 | 92.3 | 110.6 |
| Q4 | 95.3 | 102.1 | 88.1 | 93.1 | 114.8 |
| 2021 | |||||
| Q1 | 95.5 | 104.1 | 88.0 | 93.7 | 125.7 |
| Q2 | 95.3 | 104.9 | 91.5 | 89.5 | 121.6 |
| Q3 | 99.7 | 105.3 | 92.0 | 90.9 | 111.1 |
| Q4 | 100.2 | 105.9 | 94.2 | 93.8 | 114.3 |
| 2022 | |||||
| Q1 | 100.8 | 106.6 | 96.3 | 91.7 | 116.4 |
| Q2 | 103.2 | 106.6 | 99.5 | 94.1 | 107.3 |
|
Note: Q1=first quarter. Source: Statistics Canada, table 36-10-0104-01. |
|||||
After advancing in the first quarter, residential investment detracted from growth in the second as the housing market adjusted to rising borrowing costs. Investment in housing fell 7.8% as lower resale activity led to a 24.7% decrease in ownership transfer costs. Renovation activity also pulled back, while new homebuilding increased for the first time in four quarters. Despite the pullback, total residential investment remained 7% above pre-COVID levels.
Export volumes rebounded in the second quarter (+2.6%) after weighing on growth in the first. Higher shipments of metal products and increases in travel services supported export volumes in the second quarter. Import volumes, bolstered by increases in transportation equipment, posted their largest quarterly increase (+6.9%) since trade activity ramped up after the initial COVID-lockdowns. Total export volumes in the second quarter remained 6% below pre-pandemic levels,Note while import volumes were 6% higher than in late 2019.
Productivity below pre-pandemic levels as trading gains bolster real income growth
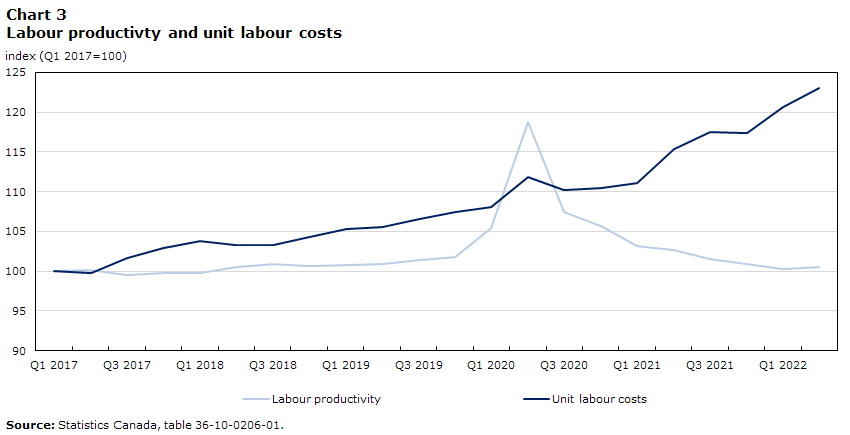
Business labour productivity, a measure of the volume of goods and services produced per hour worked, edged up in the second quarter following seven consecutive quarterly declines. Labour productivity in the quarter was 1.3% below pre-pandemic levels. In contrast, unit labour costs, which measure the payments to labour required to produce a unit of output, continued to trend higher and were 14.5% above levels observed in late 2019 (Chart 3).Note
Improvements in Canada’s terms of trade bolstered real income growth during the first half of 2022. Real gross domestic income, a measure of the purchasing power of domestic production which incorporates relative changes in export and import prices, grew by 2.2% in the first quarter and 2.5% in the second (roughly three times the cumulative pace of real GDP growth during the first two quarters). About two thirds of this real income growth reflected improvements in the terms of trade.
Data table for Chart 3
| Labour productivity | Unit labour costs | |
|---|---|---|
| 2017 | ||
| Q1 | 100 | 100 |
| Q2 | 100.2 | 99.7 |
| Q3 | 99.5 | 101.6 |
| Q4 | 99.7 | 102.9 |
| 2018 | ||
| Q1 | 99.7 | 103.8 |
| Q2 | 100.5 | 103.3 |
| Q3 | 100.9 | 103.3 |
| Q4 | 100.6 | 104.2 |
| 2019 | ||
| Q1 | 100.8 | 105.3 |
| Q2 | 100.8 | 105.5 |
| Q3 | 101.3 | 106.6 |
| Q4 | 101.8 | 107.5 |
| 2020 | ||
| Q1 | 105.5 | 108.1 |
| Q2 | 118.8 | 111.8 |
| Q3 | 107.4 | 110.2 |
| Q4 | 105.7 | 110.4 |
| 2021 | ||
| Q1 | 103.1 | 111.1 |
| Q2 | 102.6 | 115.4 |
| Q3 | 101.5 | 117.5 |
| Q4 | 100.9 | 117.4 |
| 2022 | ||
| Q1 | 100.3 | 120.7 |
| Q2 | 100.5 | 123.0 |
| Sources: Statistics Canada table 36-10-0206-01 | ||
Slower growth in economy-wide output as borrowing costs rise
Both goods and service industries posted steady gains during the first half.Note Higher output in construction and manufacturing contributed to output growth in the first quarter, while increases in accommodation and food services, mining and oil and gas extraction, and transportation and warehousing supported growth in the second. Crop production continued to post steady gains throughout the first half of the year.
The pace of economic activity, measured month-over-month, moderated during the spring months. Output growth slowed in April (+0.2%), remained essentially unchanged in May, and then edged up 0.1% in both June and July. While activity in many client-facing services continued to ramp up towards mid-year,Note output scaled back in industries that are sensitive to interest rate changes (Chart 4).

Data table for Chart 4
| Oil sands extraction | Residential building construction | Motor vehicle manufacturing | Real estate agents and brokers | Computer systems design | |
|---|---|---|---|---|---|
| 2021 | |||||
| June | 100 | 100 | 100 | 100 | 100 |
| July | 101.9 | 96.2 | 94.3 | 97.8 | 101.2 |
| Aug. | 101.3 | 96.0 | 90.2 | 98.1 | 102.3 |
| Sept. | 105.4 | 94.7 | 65.8 | 98.4 | 104.3 |
| Oct. | 109.3 | 95.5 | 96.0 | 106.1 | 105.4 |
| Nov. | 104.2 | 95.2 | 105.2 | 104.8 | 106.9 |
| Dec. | 100.1 | 93.1 | 113.7 | 103.7 | 108.7 |
| Jan. | 98.5 | 96.5 | 94.4 | 102.7 | 110.4 |
| Feb. | 100.8 | 97.2 | 112.3 | 104.6 | 111.9 |
| Mar. | 103.3 | 98.6 | 120.6 | 94.0 | 113.5 |
| Apr. | 109.1 | 97.5 | 130.4 | 84.2 | 114.4 |
| May | 104.8 | 95.0 | 101.1 | 79.5 | 115.3 |
| 2022 | |||||
| June | 102.0 | 94.1 | 105.3 | 75.1 | 116.5 |
| July | 107.2 | 94.2 | 109.3 | 72.5 | 117.1 |
| Source: Statistics Canada, table 36-10-0434-01. | |||||
Real estate agents and brokers posted five consecutive declines from March to July as homebuyers adjusted to higher borrowing costs. After peaking at nearly 50% above pre-pandemic levels in March 2021, activity at agents and brokers in July was 11% below its pre-COVID baseline, the lowest level since activity began to recover from the initial lockdowns. Legal services, which are strongly impacted by housing market activity, also fell steadily from March to July.
Construction posted four consecutive declines from April to July, but remained slightly above pre-pandemic levels. Residential, non-residential and repair construction all edged down in the spring months.
Businesses anticipate continued challenges related to inflation and supply chains
Data for the third quarter from the Canadian Survey on Business Conditions continue to underscore the cost pressures and logistical challenges facing many companies. Three in five businesses expect rising inflation to be an obstacle over the next three months, while almost half expect challenges related to higher input costs. About one-third of businesses expect to raise prices over the coming months.
Supply chain disruptions continue to be widely anticipated. Over one-quarter of businesses expect challenges acquiring inputs, products or supplies domestically over the next three months, with over half of these businesses anticipating that supply challenges will continue for six months or more.
Inflationary pressures remain widespread as gas prices ease
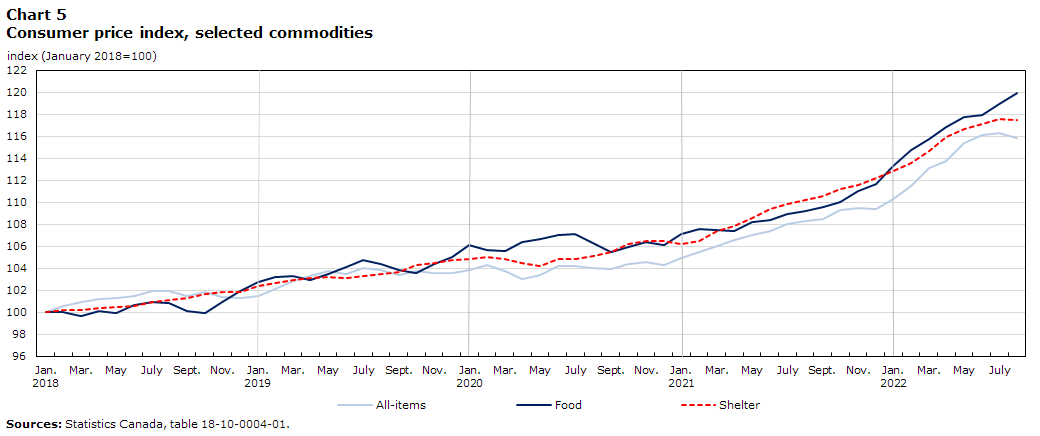
Headline consumer inflation rose steadily during the first half of 2022, reaching a forty year high of 8.1% in June. During this period, higher prices for gasoline, shelter, food and durables have all put upward pressure on consumer inflation, as supply disruptions coupled with strong demand have continued to fuel price growth. Excluding gasoline, annual price growth accelerated steadily to 6.5% in June as inflationary pressures remained widespread.Note
Headline consumer inflation eased during the summer months on lower gasoline prices. August marked the seventeenth consecutive month that the headline rate (+7.0%) has been above three percent, and the sixth consecutive month above six percent.
Data table for Chart 5
| All-items | Food | Shelter | |
|---|---|---|---|
| 2018 | |||
| Jan. | 100 | 100 | 100 |
| Feb. | 100.6074412 | 100 | 100.2147459 |
| Mar. | 100.9111617 | 99.6544575 | 100.2147459 |
| Apr. | 101.2148823 | 100.0691085 | 100.4294918 |
| May | 101.2908125 | 99.9308915 | 100.5010737 |
| June | 101.4426727 | 100.6219765 | 100.5726557 |
| July | 101.9741838 | 100.967519 | 100.9305655 |
| Aug. | 101.8982536 | 100.829302 | 101.0737294 |
| Sept. | 101.5186029 | 100.138217 | 101.2884753 |
| Oct. | 101.8223235 | 99.9308915 | 101.6463851 |
| Nov. | 101.3667426 | 100.967519 | 101.861131 |
| Dec. | 101.2908125 | 101.935038 | 101.861131 |
| 2019 | |||
| Jan. | 101.4426727 | 102.76434 | 102.3622047 |
| Feb. | 102.126044 | 103.178991 | 102.6485326 |
| Mar. | 102.8094153 | 103.2480995 | 102.9348604 |
| Apr. | 103.2649962 | 102.9716655 | 103.1496063 |
| May | 103.7205771 | 103.455425 | 103.2211883 |
| June | 103.4927866 | 104.14651 | 103.0780243 |
| July | 104.0242976 | 104.7684865 | 103.2927702 |
| Aug. | 103.8724374 | 104.422944 | 103.5075161 |
| Sept. | 103.4168565 | 103.8009675 | 103.65068 |
| Oct. | 103.7205771 | 103.593642 | 104.2949177 |
| Nov. | 103.5687168 | 104.422944 | 104.4380816 |
| Dec. | 103.5687168 | 104.975812 | 104.7244094 |
| 2020 | |||
| Jan. | 103.8724374 | 106.081548 | 104.7959914 |
| Feb. | 104.3280182 | 105.666897 | 105.0107373 |
| Mar. | 103.7205771 | 105.5977885 | 104.8675734 |
| Apr. | 103.0372058 | 106.4270905 | 104.5096636 |
| May | 103.3409263 | 106.634416 | 104.2233357 |
| June | 104.1761579 | 106.9799585 | 104.7959914 |
| July | 104.1761579 | 107.1181755 | 104.7959914 |
| Aug. | 104.0242976 | 106.2888735 | 105.0823193 |
| Sept. | 103.9483675 | 105.4595715 | 105.4402291 |
| Oct. | 104.4039484 | 105.943331 | 106.1560487 |
| Nov. | 104.5558087 | 106.357982 | 106.4423765 |
| Dec. | 104.3280182 | 106.1506565 | 106.4423765 |
| 2021 | |||
| Jan. | 104.9354594 | 107.1181755 | 106.2276306 |
| Feb. | 105.4669704 | 107.5328265 | 106.5139585 |
| Mar. | 105.9984814 | 107.463718 | 107.372942 |
| Apr. | 106.5299924 | 107.3946095 | 107.8740157 |
| May | 107.0615034 | 108.2239115 | 108.5898354 |
| June | 107.365224 | 108.3621285 | 109.3772369 |
| July | 108.0485953 | 108.9149965 | 109.8783107 |
| Aug. | 108.2763857 | 109.1914305 | 110.1646385 |
| Sept. | 108.5041762 | 109.536973 | 110.5225483 |
| Oct. | 109.2634776 | 110.0207326 | 111.2383679 |
| Nov. | 109.491268 | 111.0573601 | 111.5962777 |
| Dec. | 109.3394077 | 111.6793366 | 112.2405154 |
| 2022 | |||
| Jan. | 110.3264996 | 113.2688321 | 112.8131711 |
| Feb. | 111.4654518 | 114.7201106 | 113.5289907 |
| Mar. | 113.0599848 | 115.7567381 | 114.6743021 |
| Apr. | 113.7433561 | 116.7933656 | 115.8911954 |
| May | 115.3378891 | 117.7608846 | 116.678597 |
| June | 116.0971906 | 117.8991016 | 117.1080888 |
| July | 116.2490509 | 118.9357291 | 117.5375805 |
| Aug. | 115.8694002 | 119.9032481 | 117.4659986 |
| Source: Statistics Canada table, 18-10-0004-01. | |||
Food prices continued to edge higher during July and August (Chart 5). Grocery prices, measured year-over-year, were up 10.8% in August, the largest yearly increase since 1981. Annual price increases for meat edged up to 6.5%, while yearly increases for fresh fruit remained at or above the 10 percent mark for the fifth consecutive month. Prices for pasta products were up 20.7% in the twelve months to August. Annual price increases at restaurants topped the seven percent mark for the third consecutive month.
Shelter costs, measured year-over-year, continued to ease during the summer months but remained elevated. Annual price increases for owned accommodation slowed to 6.2% in August after peaking at 7.6% in April. Yearly increases in the homeowners’ replacement cost index fell below the ten percent mark for the second consecutive month after 14 consecutive months in double-digit territory. At the same time, mortgage interest costs, measured year-over-year, remained in positive territory for the second consecutive month (+4.8%), reflecting recent upward pressure on lending rates.Note Annual price increases for rented accommodation remained above the four percent mark for the seventh consecutive month as the demand for rental units continues to rise.
Consumer inflation has outpaced the growth in average hourly wages since the headline rate topped the three percent mark in April 2021. The pace of wage growth, measured year-over-year, edged higher in the first half, rising above the five percent mark from June to August.Note
Rising prices have affected the ability of three in four households to meet day-to-day expenses.Note In April 2022 (when headline inflation was at 6.8%), three in ten Canadians reported that they were very concerned about whether they could afford housing or rent, while one in four indicated that they had to borrow money from friends or relatives, take on additional debt, or use credit to meet day-to-day expenses. Lower income earners, young Canadians, households with children, persons with disabilities and Canadians belonging to racialized groups were more likely to borrow money.
While inflationary pressures have been broad-based, their impacts have been felt most deeply in higher prices for products that directly impact living costs. Over four in ten Canadians in April reported that they were most affected by rising food prices, while one in three indicated that they were most affected by higher transportation costs (Chart 6).
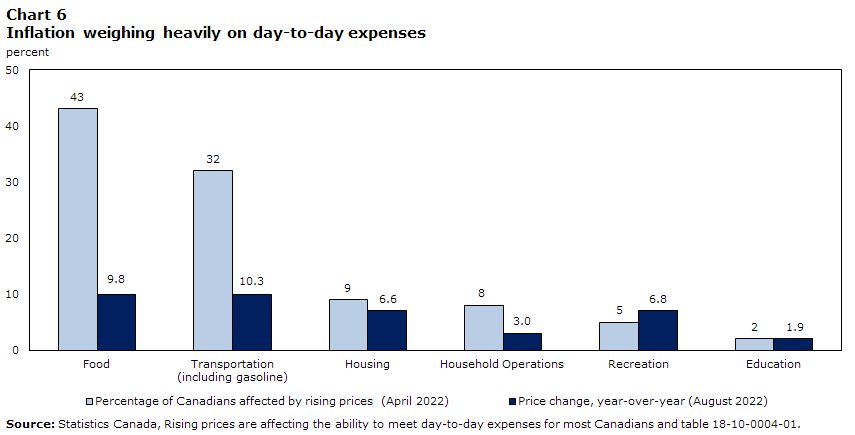
Data table for Chart 6
| Percentage of Canadians affected by rising prices (April 2022) | Price change, year-over-year (August 2022) | |
|---|---|---|
| Food | 43 | 10 |
| Transportation (including gasoline) | 32 | 10 |
| Housing | 9 | 7 |
| Household Operations | 8 | 3 |
| Recreation | 5 | 7 |
| Education | 2 | 2 |
| Source: Statistics Canada, “Rising prices are affecting the ability to meet day-to-day expenses for most Canadians.” The Daily. June 2022; Portrait of Canadian Society – Impacts of Rising, April 19 to May 1, 2022. | ||
Slower employment growth as the demand for workers remains elevated
Employment growth slowed following large Omicron-related movements in early 2022. Headline employment rose by nearly 340,000 in February, more than offsetting losses under tighter health restrictions at the start the year. Employment then edged higher in the three months to May, before pulling back during the late spring and summer months. Total employment in August was little changed from levels reported in February, with net gains in full-time work offsetting declines in part-time.
Despite the recent slowdown, labour market conditions remained exceptionally tight during the spring and summer months. More Canadians in their prime working years are currently working now than before the pandemic. The employment rate among 25 to 54 year-olds edged down from a record 84.7% in June to 84.1% in August, but remained 0.9 percentage points above its pre-pandemic benchmark. The national unemployment rate fell to a record low of 4.9% in June and July, while the rate among core-age workers has remained below the five percent mark since February. During this period, unemployment rates among youth and older workers have also generally remained below pre-pandemic benchmarks.
Many employers continue to navigate labour shortages as the job vacancy rate rose to a record-high 5.7% in the second quarter. Nearly four in ten businesses reported that labour-related obstacles would limit growth, with a similar percentage anticipating that they would hire less suitable candidates. The ratio of unemployed persons to job vacancies edged down to a record low of 1.0 in June.Note Businesses also report challenges retaining workers. In August, the proportion of permanent employees who were planning to leave their job within the next 12 months was 11.9%, almost double the level recorded at the start of the year (6.4%).Note
Population aging is now having a measurable impact on medium-term changes in the age structure of the workforce. Since the onset of the pandemic, the working age population has increased by about 900,000 persons. About two thirds of this increase is accounted for individuals who are now 55 years of age and older, who as a group make up a larger share of the working age population. Indeed, changes in the age structure over the last three years have been driven by more elderly Canadians with much lower rates of labour force participation (Chart 7). As participation rates for specific age groups remain very similar to those reported before the pandemic, the decline in the participation rate among those 55 or over (currently 1.9 percentage points below its pre-pandemic baseline) reflects aging within this group, rather than workers of a specific age working less.Note
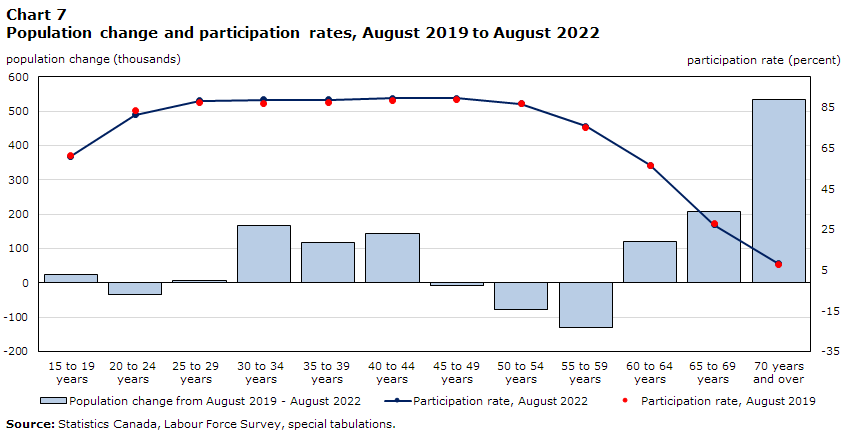
Data table for Chart 7
| Participation rate, August 2019 | Participation rate, August 2022 | Population change from August 2019 - August 2022 | |
|---|---|---|---|
| 15-19 years | 61.4 | 60.8 | 23.1 |
| 20-24 years | 83.6 | 81.2 | -34.1 |
| 25-29 years | 87.4 | 88.1 | 5.2 |
| 30-34 years | 86.9 | 88.7 | 167.7 |
| 35-39 years | 87.1 | 88.7 | 118.1 |
| 40-44 years | 88.4 | 89.3 | 143.5 |
| 45-49 years | 88.9 | 89.4 | -6.6 |
| 50-54 years | 86.7 | 86.7 | -77 |
| 55-59 years | 75.2 | 75.6 | -131.3 |
| 60-64 years | 56.3 | 56.5 | 120.2 |
| 65-69 years | 28 | 27.3 | 206 |
| 70 years and over | 7.8 | 8 | 533.1 |
| Source: Statistics Canada, Labour Force Survey, special tabulations. | |||
The impact of these changes in age structure is consequential. August’s employment report noted that if the age distribution of the working age population had stayed constant over the past three years—rather than older Canadians comprising an increasingly larger share of the population—374,000 more people would be in the labour force in August than was actually observed.Note
Changes in the industrial composition of employment growth, many of which reflect developments early in the pandemic, continue to persist (Chart 8). Net employment gains among public sector employees over the last three years reflect large cumulative increases in health care and social assistance, public administration, and educational services. Among private sector employees, large increases in professional, scientific and technical services, and in finance and real estate industries, have been partly offset by declines in accommodation and food services. Self-employment continues to lag pre-pandemic levels, reflecting broad-based losses across industries. On the whole, net employment gains since the onset of the pandemic has been concentrated entirely in occupations that typically require university education.
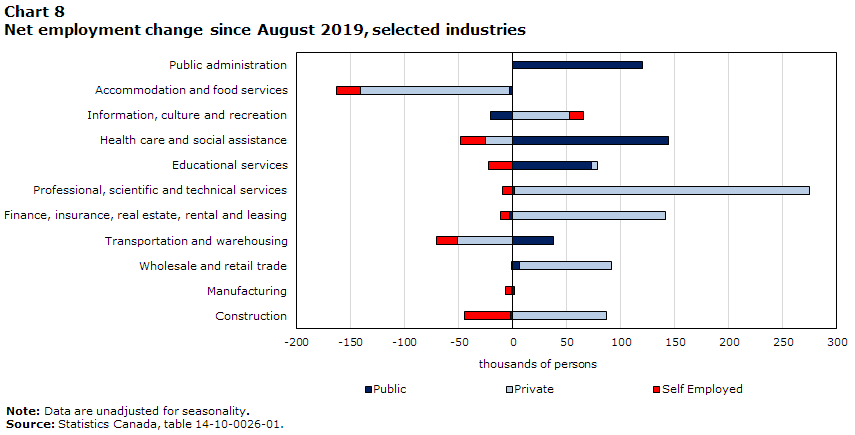
Data table for Chart 8
| Public | Private | Self Employed | Net | |
|---|---|---|---|---|
| Total employed, all industries 4 | 373.7 | 343.6 | -218.8 | 498.5 |
| Agriculture 5 | Note x: suppressed to meet the confidentiality requirements of the Statistics Act | -9.7 | -21.7 | -31.4 |
| Forestry, fishing, mining, quarrying, oil and gas 6 7 | 0.2 | 13.8 | -8.3 | 5.7 |
| Utilities | 12.6 | 2.3 | Note x: suppressed to meet the confidentiality requirements of the Statistics Act | 14.9 |
| Construction | -1.9 | 86.9 | -43.4 | 41.6 |
| Manufacturing | 1.2 | -1.7 | -5.6 | -6.1 |
| Wholesale and retail trade | 5.7 | 85.2 | -1.3 | 89.6 |
| Transportation and warehousing | 37.8 | -51.5 | -19.4 | -33.1 |
| Finance, insurance, real estate, rental and leasing | -2.7 | 141.3 | -8.5 | 130.1 |
| Professional, scientific and technical services | 1.3 | 273.4 | -9.2 | 265.5 |
| Business, building and other support services 8 | 5.8 | -54.5 | -3 | -51.7 |
| Educational services | 72.7 | 5.4 | -22.4 | 55.7 |
| Health care and social assistance | 144.4 | -25.5 | -23 | 95.9 |
| Information, culture and recreation | -20.4 | 52.7 | 12.6 | 44.9 |
| Accommodation and food services | -3 | -138.5 | -21.9 | -163.4 |
| Other services (except public administration) | Note x: suppressed to meet the confidentiality requirements of the Statistics Act | -37.2 | -44.2 | -81.4 |
| Public administration | 119.7 | Note x: suppressed to meet the confidentiality requirements of the Statistics Act | Note x: suppressed to meet the confidentiality requirements of the Statistics Act | 119.7 |
|
x suppressed to meet the confidentiality requirements of the Statistics Act Source: Statistics Canada, table 14-10-0026-01 |
||||
Household wealth falls by nearly one trillion
While household incomes continued to expand in the second quarter, balance sheets contracted sharply as asset markets plunged into correction territory. Household wealth contracted by 6.1% but remained 23.9% higher than before the pandemic.
After expanding by 5.0% in the first quarter, household disposable income edged up 1.0% in the second as higher wages and salaries offset lower government transfers. Stronger spending pushed the savings rate down to 6.2%. Household income and saving in the quarter remained well above pre-pandemic levels. Disposable income was 16% above levels reported in late 2019, while the savings rate was over twice its pre-COVID baseline.
Household net worth—the value of all household assets minus liabilities—fell by $990 billion in in the second quarter, the largest quarterly decline on record. Household financial assets were hit by weaker equity markets, while the value of residential properties fell sharply as borrowing costs rose. Households took on more debt as both mortgage and non-mortgage borrowing increased, the former advancing at a near record pace.
Household wealth inequality increased in the second quarter for the first time since the onset of the pandemic. The net worth of households in the bottom 40 percent of the wealth distribution fell by 12.0% (representing an average decrease of $8,828), more than twice the rate of decline of 5.9% among households in the top wealth quintile (an average decrease of $199,118). While wealth fell across all age groups, younger households were most impacted. The average net worth of households in the youngest age group (less than 35 years) fell by 8.2%, reflecting the sharp decline in real estate values.
References
Statistics Canada. n.d. Canadian Economic News. Last updated March 10, 2022. Available at: https://www.statcan.gc.ca/eng/dai/btd/cen/index#census (accessed October 5th, 2022).
Statistics Canada. n.d. Canadian Economic Dashboard and COVID-19. Last updated October 12, 2022. Available at: https://www150.statcan.gc.ca/n1/pub/71-607-x/71-607-x2020009-eng.htm?HPA=1 (accessed October 12, 2022).
Statistics Canada. 2022. Disaggregating wage growth: Trends and considerations. Catalogue 11-631-X. Ottawa: Statistics Canada. Released August 8, 2022.
Statistics Canada. 2022. Investment, Productivity and Living Standards. Catalogue 11-631-X. Ottawa: Statistics Canada. Released September 1, 2022.
Research to Insights: Investment, Productivity and Living Standards.
- Date modified: