
Economic and Social Reports
Recent trends in Registered Education Savings Plan holdings by income, immigrant status, Indigenous identity and province
DOI: https://doi.org/10.25318/36280001202200500003-eng
Abstract
Registered Education Savings Plans (RESPs) are part of the suite of government programs designed to encourage youth from traditionally low-enrolment groups to consider postsecondary studies as a viable option. Since the mid-2000s, lower- and middle-income parents of children younger than 18 have had strong financial incentives from the government to open an RESP and make contributions. A previous study based on 2012 data showed that RESP holdings were most prevalent among high-income, high-wealth and highly educated parents. The purpose of the current study is to update these findings and to expand the analysis to include results by immigrant status, Indigenous identity and province of residence.
To do so, the study uses the Survey of Financial Security. Focusing on married couples and lone parents with at least one child younger than 18, the study highlights several key takeaways. First, the absolute and relative gaps in RESP investments between families from the top and the bottom of the income distribution began to decrease in recent years, reversing a longstanding trend of increases throughout the 2000s and early 2010s. Despite this, families in the top of the income distribution were still considerably more likely to hold RESPs and had far more invested in them in 2019 than their counterparts in the bottom of the income distribution. Second, although immigrant parents place a high value on postsecondary education, they invested more or less equally in RESPs compared with non-immigrant families. Third, Indigenous families living off-reserve invested considerably less in RESPs than non-Indigenous families, and a large share of this difference was related to lower incomes, wealth, parental education, etc., among Indigenous families living off-reserve. Thus, Indigenous families living off-reserve were using RESPs to save for postsecondary education in a more or less similar way to equally disadvantaged non-Indigenous families. Fourth, average RESP investments varied considerably by province, but again, much of this was because of differences in factors that determined RESP investment patterns. After differences in RESP determinants were accounted for, families in Newfoundland and Labrador and those in British Columbia tended to invest the most in RESPs, while no differences remained among the other provinces.
Author
Marc Frenette is with the Social Analysis and Modelling Division, Analytical Studies and Modelling Branch, at Statistics Canada.
Introduction
The relationship between postsecondary educational credentials and labour market success is well established (e.g., Frenette, 2014; Frenette, 2019a), and this trend may continue or even become stronger as the world becomes more digitized. Indeed, businesses may increasingly automate their routine, non-cognitive processes to specialize in non-routine, cognitive work, and the workplace may globalize through telework opportunities—two factors that could disproportionately benefit higher-educated workers (Frank et al., 2021; and Messacar et al., 2020 ; respectively). However, previous studies have clearly demonstrated that postsecondary enrolment is considerably lower among youth from lower-income families (Frenette, 2007; Frenette, 2017a), as well as among those from certain populations, including Indigenous people living off-reserve (Frenette, 2011a). Research has also demonstrated that the estimated earnings premium associated with a postsecondary education is at least as high for youth from lower-income families compared with those from higher-income families (Frenette, 2019b) and for Indigenous people living off-reserve compared with non-Indigenous people (Frenette, 2011b). Acquiring a Canadian postsecondary education is also key to the success of many second-generation immigrant groups (Chen and Hou, 2019).
There are many tools put in place by governments to assist youth, particularly those from disadvantaged backgrounds, in pursuing a postsecondary education. These include student loans with more favourable repayment conditions than private loans, non-refundable grants, tax credits and postsecondary savings incentives. The postsecondary savings option is quite important, as incentives have become substantial and highly targeted. From the inception of Registered Education Savings Plans (RESPs) in 1974 by the federal government, returns on investments made within established contribution limits were tax-sheltered. The contribution limits were increased in 1996 and again in 1997, and the program was made more flexible at that time by allowing unused portions to be transferred to a Registered Retirement Savings Plan (RRSP) in the event that the beneficiary did not pursue postsecondary education. However, the most significant incentive came in 1998, when the federal government introduced the Canada Education Savings Grant (CESG), a 20% grant to complement private contributions up to a set limit. Additional contribution incentives were implemented in 2004 for low- and middle-income families in the form of an additional 20% and 10% matching grant. At that time, the Canada Learning Bond (CLB) was introduced to help low-income families open an RESP account without having to make any contributions. Under the CLB, eligible families would receive an initial $500 contribution from the government, followed by an additional $100 per year for the first 15 years of the beneficiary’s life. Additional, but more minor, incentives have been implemented at the federal level since then, and several provinces (Quebec, Saskatchewan, Alberta and British Columbia) have also initiated incentives for their residents to contribute to RESPs.Note
Previous research based on data covering the 1999-to-2012 period demonstrated that RESPs were most prevalent among high-income, high-wealth and highly educated parents (Frenette, 2017b). However, having an RESP account at age 15 was associated with a greater propensity to enrol in university or college in subsequent years (Frenette, 2017b) among lower- and higher-income families alike, and the association between having an RESP account and future enrolment patterns persisted, even after accounting for well-documented differences in the determinants of postsecondary enrolment (e.g., academic performance and parental education).
The purpose of the current study is to update the information on patterns of RESP holdings with more recent data. To do so, the study uses the Survey of Financial Security (SFS) of 1999, 2005, 2012, 2016, and 2019. The SFS is designed to measure the net worth (wealth) of Canadian families, including detailed components (e.g., the total value of all existing RESP investments at a point in time). Focusing on married couples and lone-parents with at least one child younger than 18, the study documents patterns over time and disaggregated by income, immigrant status, Indigenous identityNote and province of residence. While many factors may influence the decision to invest in RESPs, the purpose of the current study is simply to establish the trends across the aforementioned dimensions.
Registered Education Savings Plan investments among families continued to grow, but at a slower pace
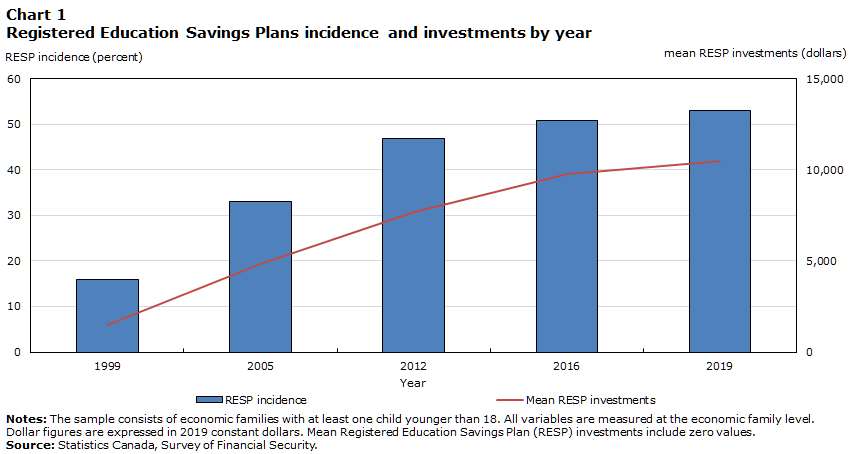
About one in six families (15.9%) with at least one child younger than 18 had an RESP account in 1999, one year after the CESG was implemented (Chart 1). However, this share increased rapidly in the following years, reaching 33.0% in 2005. Several factors may have contributed to the more than doubling of the share of families with an RESP account in such a short period of time. Between the two periods, the CESG was expanded for low- and middle-income families and the CLB was introduced, potentially encouraging disadvantaged families to open an RESP account. This was also a period of rapidly rising tuition fees,Note which could have fostered a more forward-looking approach among families with children. Families may have also become more aware of the original CESG and its benefits over time.
Data table for Chart 1
| Year | RESP incidence | Mean RESP investments |
|---|---|---|
| percent | dollars | |
| 1999 | 15.87 | 1,473.00 |
| 2005 | 32.96 | 4,822.01 |
| 2012 | 46.75 | 7,687.18 |
| 2016 | 50.76 | 9,751.98 |
| 2019 | 53.01 | 10,485.30 |
|
Notes: The sample consists of economic families with at least one child younger than 18. All variables are measured at the economic family level. Dollar figures are expressed in 2019 constant dollars. Mean Registered Education Savings Plan (RESP) investments include zero values. Source: Statistics Canada, Survey of Financial Security. |
||
The share of families with an RESP account continued to grow after 2005, as additional incentives were implemented, and several provinces added incentives of their own. By 2012, almost half (46.8%) of families had an RESP account. However, growth slowed considerably after 2012. By 2016, 50.8% of families had an RESP account, and by 2019, that share was only slightly higher, at 53.0%.
A similar pattern emerged over the entire period when looking at the mean value of total RESP investments (including zeros), which increased from $1,473 in 1999 to $10,485 in 2019. The trends in mean RESP investments generally mirrored the trends in the incidence of RESP investments across each of the years examined.
Among families with an RESP account, mean RESP investments also grew over the period, albeit at a slower pace. Specifically, mean RESP investments went from $9,279 in 1999 to $19,779 in 2019.Note
Although these results paint an interesting picture of RESP investments over the past two decades, perhaps the more important question is, “How prevalent are RESP investments in certain groups in society?” The remainder of this article examines this question across several socioeconomic dimensions.
Families in the top 20% of the income distribution held almost seven times more in Registered Education Savings Plans than families in the bottom 20%
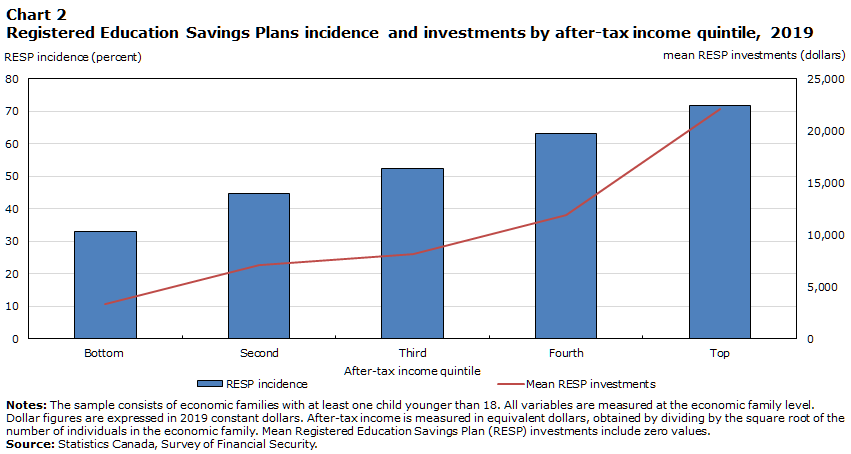
Aside from the CLB program, which is targeted at low-income families, it is not possible to invest in RESPs without having access to funds. Family income provides a flow of funds that could be used to invest in RESPs. Indeed, 71.7% of families in the top 20% of the after-tax income distribution had an RESP account in 2019, more than twice as high as their counterparts in the bottom 20% (33.0%). However, the main difference was in the dollar amounts of RESP investments, bearing in mind that non-contributors were included in the calculations. In this case, families in the top 20% of the after-tax income distribution held 6.7 times more RESP investments than their counterparts in the bottom 20% in 2019 (Chart 1).Note
Data table for Chart 2
| After-tax income quintile |
RESP incidence | Mean RESP investments |
|---|---|---|
| percent | dollars | |
| Bottom | 32.96 | 3,295.37 |
| Second | 44.77 | 7,080.00 |
| Third | 52.39 | 8,135.45 |
| Fourth | 63.16 | 11,848.55 |
| Top | 71.74 | 22,052.21 |
|
Notes: The sample consists of economic families with at least one child younger than 18. All variables are measured at the economic family level. Dollar figures are expressed in 2019 constant dollars. After-tax income is measured in equivalent dollars, obtained by dividing by the square root of the number of individuals in the economic family. Mean Registered Education Savings Plan (RESP) investments include zero values. Source: Statistics Canada, Survey of Financial Security. |
||
The increases in RESP incidence and investments were fairly consistent from one income quintile to the next, as evidenced in Chart 2. The exception was between the fourth and fifth (top) quintiles, where mean RESP investments jumped from $11,849 to $22,052. One possible reason for this is the fact that average after-tax income was substantially higher for families in the top quintile compared with those in the fourth quintile.Note
After increasing in all survey years, both the relative and absolute gaps in mean RESP investments between families in the top and bottom income quintiles decreased in 2019 (Chart 3). In relative terms, families in the top income quintile held 4.1 times more RESP investments than their counterparts in the bottom quintile in 1999. This ratio increased to 4.6 in 2005, 7.4 in 2012 and 8.2 in 2016. In 2019, the relative gap fell back to roughly its 2012 value (6.7).
In absolute terms, the gap also grew consistently through 2016, and decreased slightly in 2019. Specifically, the difference in mean RESP investments between families in the top and bottom income quintiles increased rapidly from $2,556 in 1999 to $10,355 in 2005, followed by smaller increases through 2012 ($15,015) and 2016 ($20,761), and a slight decrease in 2019 ($18,757). Despite the lack of a significant decline in the absolute gap between the two groups, families in the bottom income quintile registered moderate increases in mean RESP investments in recent years (going from $2,349 in 2012 to $2,902 in 2016 and $3,295 in 2019).

Data table for Chart 3
| Year | Bottom income quintile | Top income quintile |
|---|---|---|
| mean RESP investments (dollars) | ||
| 1999 | 833.13 | 3,389.60 |
| 2005 | 2,838.33 | 13,193.40 |
| 2012 | 2,349.37 | 17,364.37 |
| 2016 | 2,901.65 | 23,662.93 |
| 2019 | 3,295.37 | 22,052.21 |
|
Notes: The sample consists of economic families with at least one child younger than 18. All variables are measured at the economic family level. Dollar figures are expressed in 2019 constant dollars. After-tax income is measured in equivalent dollars, obtained by dividing by the square root of the number of individuals in the economic family. Mean Registered Education Savings Plan (RESP) investments include zero values. Source: Statistics Canada, Survey of Financial Security. |
||
Immigrant and non-immigrant families invested equally in Registered Education Savings Plans
Children of immigrants tend to be highly educated compared with children of Canadian-born parents. This might be related to the fact that immigrant parents (many of whom are also highly educated) tend to place a high value on postsecondary education (Childs et al., 2012). In principle, this could translate to greater savings for their children’s postsecondary education.
Despite this, results in Chart 4 suggest that this was not the case. Over the past two decades, mean RESP investments have been roughly the same for immigrant and non-immigrant families.Note In fact, RESP investments of immigrant families have fallen somewhat behind those of non-immigrant families. In 1999, the average immigrant family held $1,728 in RESP investments, compared with $1,373 for non-immigrant families. Non-immigrant families gradually caught up to immigrant families over the next two decades. In fact, by 2019, mean RESP investments were greater among non-immigrant families ($11,191) than among immigrant families ($9,584). However, in all years, immigrant and non-immigrant families held the same amount of RESP investments after accounting for differences in key determinants of RESP investments.Note Note Note

Data table for Chart 4
| Year | Immigrant | Canadian-born |
|---|---|---|
| mean RESP investments (dollars) | ||
| 1999 | 1,728.25 | 1,373.48 |
| 2005 | 5,447.16 | 4,555.64 |
| 2012 | 7,869.44 | 7,583.01 |
| 2016 | 9,700.76 | 9,788.58 |
| 2019 | 9,583.81 | 11,191.20 |
|
Notes: The sample consists of economic families with at least one child younger than 18. All variables are measured at the economic family level. Dollar figures are expressed in 2019 constant dollars. Mean Registered Education Savings Plan (RESP) investments include zero values. Source: Statistics Canada, Survey of Financial Security. |
||
Indigenous families living off-reserve held two to three times less in Registered Education Savings Plan investments than non-Indigenous families
Although it is well documented that youth from Indigenous families living off-reserve are less likely to enrol in postsecondary studies (e.g., Frenette, 2011a), little, if anything, is known about their RESP investments—an important factor in helping youth pay for their studies.
Indigenous families living off-reserve held between two and three times less in mean RESP investments than non-Indigenous families between 2012 and 2019 (Chart 5). The difference between the two groups increased considerably in the seven-year period (going from $3,884 in 2012 to $7,657 in 2019).Note A substantial portion of the difference in each year was related to the fact that Indigenous families living off-reserve had lower income, wealth, parental education, etc., than non-Indigenous families.Note Note

Data table for Chart 5
| Year | Indigenous people living off-reserve | Non-Indigenous people |
|---|---|---|
| mean RESP investments (dollars) | ||
| 2012 | 4,000.75 | 7,885.20 |
| 2016 | 5,437.22 | 10,002.69 |
| 2019 | 3,228.79 | 10,885.73 |
|
Notes: The sample consists of economic families with at least one child younger than 18. Indigenous people living off-reserve include First Nations people living off-reserve, Métis and Inuit. All variables are measured at the economic family level. Dollar figures are expressed in 2019 constant dollars. Mean Registered Education Savings Plan (RESP) investments include zero values. Source: Statistics Canada, Survey of Financial Security. |
||
Registered Education Savings Plan investments varied considerably by province
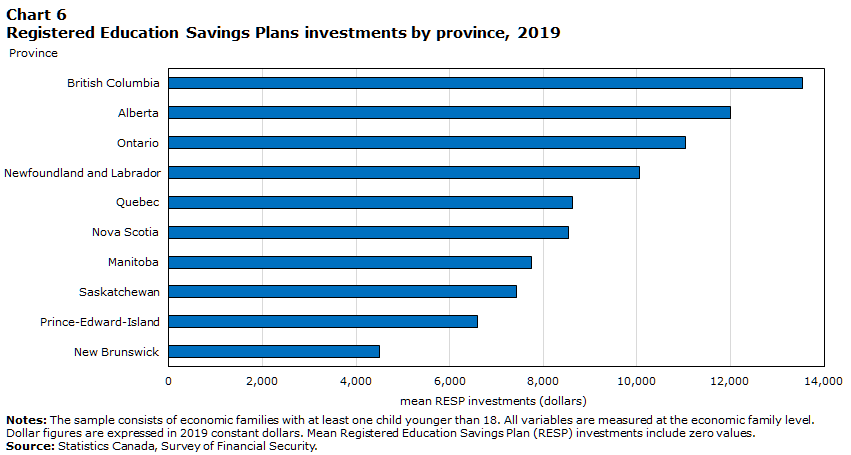
There was also considerable variation in RESP investments by province of residence. Specifically, mean RESP investments were three times higher among families in British Columbia ($13,539) than among their counterparts in New Brunswick ($4,498) in 2019. Families in Alberta, Ontario, and Newfoundland and Labrador also held more than $10,000 in RESPs, on average. There was a substantial difference in RESP investments between New Brunswick families ($4,498) and their closest counterparts in Prince Edward Island ($6,594).
To what extent were these differences expected, given that families in different provinces may have very different socioeconomic characteristics, and consequently, propensities to invest in RESPs? After differences in several key determinants of RESP investments were adjusted for, the provincial differences narrowed substantially.Note Specifically, families in Newfoundland and Labrador, Alberta, and British Columbia registered the highest adjusted RESP investments, with no significant differences among them. Families in all other provinces registered about $2,500 to $4,500 less in mean RESP investments.
Data table for Chart 6
| Province | Mean RESP investments |
|---|---|
| British Columbia | 13,538.98 |
| Alberta | 12,010.90 |
| Ontario | 11,041.50 |
| Newfoundland and Labrador | 10,060.09 |
| Quebec | 8,624.93 |
| Nova Scotia | 8,546.43 |
| Manitoba | 7,739.32 |
| Saskatchewan | 7,427.39 |
| Prince-Edward-Island | 6,593.72 |
| New Brunswick | 4,497.64 |
|
Notes: The sample consists of economic families with at least one child younger than 18. All variables are measured at the economic family level. Dollar figures are expressed in 2019 constant dollars. Mean Registered Education Savings Plan (RESP) investments include zero values. Source: Statistics Canada, Survey of Financial Security. |
|
Conclusion
Registered Education Savings Plans are a useful tool to help parents save for their children’s postsecondary education. Previous research has shown that RESP investments are most prevalent among high-income, high-wealth and highly educated families. The purpose of this article was to update what is known about the RESP holdings of Canadian families and to further explore trends across a broader variety of socioeconomic dimensions.
The study found that the overall proportion of families with an RESP account has continued to rise since 2012, but at a much slower pace than previously. In 1999, 15.9% of families with children younger than 18 had an RESP account. The share almost doubled soon thereafter, reaching 33.0% in 2005 and 46.8% in 2012. The subsequent increases were more moderate, with the share reaching 50.8% in 2016 and 53.0% in 2019. A similar pattern emerged for average RESP investments, which increased from $1,473 in 1999 to $10,485 in 2019. RESP investments continued to be most prevalent among well-to-do families in recent years, as average investments among the top 20% of families by income were almost seven times higher than the investments of the bottom 20% of families in 2019. This resulted in a gap of $18,757 in total RESP investments between the two groups. In all years examined, immigrant and non-immigrant families invested equally in RESPs. Meanwhile, Indigenous families living off-reserve held two to three times less in RESPs than non-Indigenous families, but a large share of this was explained by the differences in socioeconomic characteristics. Finally, average RESP investments varied considerably by province in 2019, but again, differences in socioeconomic characteristics explained most of this variation. After these differences were accounted for, families in Newfoundland and Labrador and British Columbia tended to invest the most in RESPs, with no differences among the other provinces.
Appendix
| RESP incidence | Mean RESP investments among families with investments | Mean RESP investments | |
|---|---|---|---|
| percent | dollars | ||
| Overall | |||
| 1999 | 15.9 | 9,279 | 1,473 |
| 2005 | 33.0 | 14,630 | 4,822 |
| 2012 | 46.8 | 16,443 | 7,687 |
| 2016 | 50.8 | 19,213 | 9,752 |
| 2019 | 53.0 | 19,779 | 10,485 |
| Bottom income quintile | |||
| 1999 | 10.6 | 7,848 | 833 |
| 2005 | 23.4 | 12,142 | 2,838 |
| 2012 | 27.5 | 8,530 | 2,349 |
| 2016 | 31.4 | 9,245 | 2,902 |
| 2019 | 33.0 | 9,999 | 3,295 |
| Second income quintile | |||
| 1999 | 14.3 | 7,402 | 1,060 |
| 2005 | 27.9 | 8,604 | 2,403 |
| 2012 | 36.2 | 13,008 | 4,710 |
| 2016 | 46.6 | 13,572 | 6,326 |
| 2019 | 44.8 | 15,814 | 7,080 |
| Third income quintile | |||
| 1999 | 18.4 | 11,569 | 2,124 |
| 2005 | 33.9 | 13,581 | 4,607 |
| 2012 | 54.2 | 13,184 | 7,150 |
| 2016 | 49.3 | 14,736 | 7,268 |
| 2019 | 52.4 | 15,528 | 8,135 |
| Fourth income quintile | |||
| 1999 | 31.2 | 9,493 | 2,963 |
| 2005 | 45.6 | 16,876 | 7,695 |
| 2012 | 63.9 | 18,979 | 12,126 |
| 2016 | 61.3 | 21,453 | 13,155 |
| 2019 | 63.2 | 18,760 | 11,849 |
| Top income quintile | |||
| 1999 | 28.8 | 11,776 | 3,390 |
| 2005 | 59.4 | 22,206 | 13,193 |
| 2012 | 67.2 | 25,842 | 17,364 |
| 2016 | 75.5 | 31,328 | 23,663 |
| 2019 | 71.7 | 30,739 | 22,052 |
| Immigrants | |||
| 1999 | 21.0 | 8,216 | 1,728 |
| 2005 | 38.6 | 14,111 | 5,447 |
| 2012 | 49.4 | 15,918 | 7,869 |
| 2016 | 53.1 | 18,282 | 9,701 |
| 2019 | 50.9 | 18,816 | 9,584 |
| Canadian-born | |||
| 1999 | 13.9 | 9,908 | 1,373 |
| 2005 | 30.6 | 14,910 | 4,556 |
| 2012 | 45.2 | 16,771 | 7,583 |
| 2016 | 49.1 | 19,932 | 9,789 |
| 2019 | 54.6 | 20,482 | 11,191 |
| Indigenous living off-reserve | |||
| 2012 | 30.3 | 13,203 | 4,001 |
| 2016 | 31.2 | 17,428 | 5,437 |
| 2019 | 26.8 | 12,068 | 3,229 |
| Non-Indigenous people | |||
| 2012 | 47.6 | 16,554 | 7,885 |
| 2016 | 51.9 | 19,275 | 10,003 |
| 2019 | 54.5 | 19,988 | 10,886 |
|
Notes: The sample consists of economic families with at least one child younger than 18. All variables are measured at the economic family level. Dollar figures are expressed in 2019 constant dollars. RESP stands for Registered Education Savings Plan. Source: Statistics Canada, Survey of Financial Security. |
|||
References
Chen, W. H., & Hou, F. (2019). Intergenerational education mobility and labour market outcomes: variation among the second generation of immigrants in Canada (Analytical Studies Branch Research Paper Series, No. 418). Statistics Canada. https://www150.statcan.gc.ca/n1/pub/11f0019m/11f0019m2019006-eng.htm
Childs, S., Finnie, R., & Mueller, R. E. (2012). University attendance and the children of immigrants: Patterns of participation and the role of background factors (Education Policy Research Initiative Working Paper No. 2012 – 04). University of Ottawa. https://ruor.uottawa.ca/bitstream/10393/33199/1/EPRI%20Working%20Paper%202012-04.pdf
Fleury, S., & Martineau, P. (2016). Registered Education Savings Plans: Then and now (Library of Parliament Background Papers, Publication No. 2016-110-E). Library of Parliament.
Frank, K., Yang, Z., & Frenette, M. (2021). The changing nature of work in Canada amid recent advances in automation technology. Economic and Social Reports 1(1). https://www150.statcan.gc.ca/n1/pub/36-28-0001/2021001/article/00004-eng.htm
Frenette, M. (2005). The impact of tuition fees on university access: Evidence from a large-scale price deregulation in professional programs (Analytical Studies Branch Research Paper Series, No. 263). Statistics Canada. https://www150.statcan.gc.ca/n1/pub/11f0019m/11f0019m2005263-eng.pdf
Frenette, M. (2007). Why are lower-income youth less likely to attend university? Evidence from academic abilities, parental influences, and financial constraints (Analytical Studies Branch Research Paper Series, No. 295). Statistics Canada. https://www150.statcan.gc.ca/n1/pub/11f0019m/11f0019m2007295-eng.htm
Frenette, M. (2011a). What explains the educational attainment gap between Aboriginal and non-Aboriginal youth? (Canadian Labour Market and Skills Researcher Network, Working Paper No. 78). University of British Columbia.
Frenette, M. (2011b). Are the labour market benefits to schooling different for Aboriginal and non-Aboriginal youth? (Canadian Labour Market and Skills Researcher Network, Working Paper No. 79). University of British Columbia.
Frenette, M. (2014). An investment of a lifetime? The long-term labour market premiums associated with a postsecondary education (Analytical Studies Branch Research Paper Series, No. 359). Statistics Canada. https://www150.statcan.gc.ca/n1/pub/11f0019m/11f0019m2014359-eng.htm
Frenette, M. (2017a). Postsecondary enrolment by parental income: Recent national and provincial trends (Economic Insights, No. 70). Statistics Canada. https://www150.statcan.gc.ca/n1/pub/11-626-x/11-626-x2017070-eng.htm
Frenette, M. (2017b). Which families invest in registered education savings plans and does it matter for postsecondary enrolment? (Analytical Studies Branch Research Paper Series, No. 392). Statistics Canada. https://www150.statcan.gc.ca/n1/pub/11f0019m/11f0019m2017392-eng.htm
Frenette, M. (2019a). Are the career prospects of postsecondary graduates improving? (Analytical Studies Branch Research Paper Series, No. 415). Statistics Canada. https://www150.statcan.gc.ca/n1/en/catalogue/11F0019M2019003
Frenette, M. (2019b). Do youth from lower- and higher-income families benefit equally from postsecondary education? (Analytical Studies Branch Research Paper Series, No. 424). Statistics Canada. https://www150.statcan.gc.ca/n1/pub/11f0019m/11f0019m2019012-eng.htm
Messacar, D., Morissette, R., & Deng, Z. (2020). Inequality in the feasibility of working from home during and after COVID-19. StatCan COVID-19: Data to Insights for a Better Canada. Statistics Canada. https://www150.statcan.gc.ca/n1/pub/45-28-0001/2020001/article/00029-eng.htm
- Date modified: