
Economic and Social Reports
The changing nature of work in Canada amid recent advances in automation technology

Archived Content
Information identified as archived is provided for reference, research or recordkeeping purposes. It is not subject to the Government of Canada Web Standards and has not been altered or updated since it was archived. Please "contact us" to request a format other than those available.
DOI: https://doi.org/10.25318/36280001202100100004-eng
Skip to text
Text begins
Abstract
Rapid developments in artificial intelligence and machine learning have raised questions about the future of work in recent years. Debates have focused primarily on the possibility of job loss resulting from automation technology, with less attention given to how automation may change the nature of workers’ jobs. This study investigates the changing nature of work in Canada by employing a task-based approach. First, changes in the importance of 16 work tasks between 2011 and 2018 were examined, providing an indication of which tasks may be more susceptible to change because of the increased integration of automation technology into the workplace. Statistics Canada’s Labour Force Survey (LFS) and Occupational Information Network (O*NET) data from the U.S. Department of Labor were used for this part of the analysis. The results indicate that work tasks that are complementary to automation, such as non-routine cognitive analytical and interpersonal tasks, were increasingly important in Canadians’ jobs between 2011 and 2018. However, the evidence is less clear on routine and non-routine manual tasks, which automation technology may be able to replace in certain cases depending on technological feasibility and other factors. The increased importance of routine cognitive tasks, such as task repetition, precision and accuracy, was also observed. However, these increases were smaller than those for non-routine cognitive tasks. There were also small decreases in the importance of some non-routine manual and physical tasks, such as manual dexterity and spending time using hands to handle, control or feed objects. Changes in the share of workers employed in four different occupational task groups were also examined between 1987 and 2018 with the LFS data, with a focus on the degree of routine or non-routine and cognitive or manual tasks required of workers’ occupations. These results reveal clearer—but more gradual—shifts over the longer term, including those well before the recent advances in artificial intelligence and its practical applications. In particular, there was a gradual shift from occupations involving routine tasks to occupations involving non-routine tasks over the past three decades. The share of Canadians working in managerial, professional and technical occupations (non-routine, cognitive tasks) and service occupations (non-routine, manual tasks) increased, while the share of workers employed in production, craft, repair and operative occupations (routine, manual tasks) and sales, clerical and administrative support occupations (routine, cognitive tasks) decreased over this period. Although some service jobs may be replaceable by automation technology, increased relative employment in this occupation was explained in large part by changes in the industrial structure between 1987 and 2018.
Authors
Kristyn Frank, Zhe Yang and Marc Frenette are with the Social Analysis and Modelling Division, Analytical Studies Branch at Statistics Canada.
Introduction
In recent years, rapid technological advancements have raised questions about the future of work. Debates have focused primarily on the risk of job loss attributable to automation, fuelled in part by recent work that estimated the percentage of jobs facing a high risk of automation (e.g., Frey and Osborne 2013; Arntz, Gregory and Zierahn 2016; Frenette and Frank 2020). However, jobs may not necessarily be at risk of being cut simply because it is technologically feasible to automate the tasks associated with those jobs. First—and perhaps foremost—firms require the funds to invest in the technology. In addition, labour laws and union rules may prevent or delay job losses in many cases. Moreover, society may not be ready to consume the goods and services made available by robots (e.g., medical patients may always prefer a human doctor). However, events such as the COVID-19 pandemic may prompt employers to adopt automation technology more quickly in an effort to limit the risks associated with workers’ vulnerability to the virus (Leduc and Liu 2020). While it is too early to determine how the pandemic may affect the work activities of Canadians, it may play a role in the workplace moving forward.
Some researchers have also argued that new technologies will not necessarily result in significant job losses for economic reasons (e.g., Autor 2015; Lee, Shao and Vinze 2018). Because automation has historically substituted tasks performed by humans with the objective of increasing worker productivity and improving the quality and quantity of products (Muro, Maxim and Whiton 2019), technological advances may be more likely to change the types of tasks that workers do in their jobs rather than replace the occupation completely (Autor and Handel 2013).
It is for these reasons that Frenette and Frank (2020) preferred to interpret the automation risk measures developed by Frey and Osborne (2013) and Arntz, Gregory and Zierahn (2016) as a risk of automation-related job transformation. The purpose of the current study is to shed light on the changing nature of work amid recent advances in artificial intelligence and machine learning.
Shifting the focus of the implications of automation from job replacement to changes in the nature of work requires occupations to be treated as a set of tasks. This approach allows researchers to consider how automation affects the nature of workers’ jobs by examining changes in their work activities (Acemoglu and Autor 2010; Autor 2013; Muro, Maxim and Whiton 2019) and also recognizes the complementarity between new technology and workers’ job tasks (Autor 2015; Autor, Levy and Murnane 2003; Acemoglu and Restrepo 2018).
Generally, routine tasks are considered the most vulnerable to automation, as the repetition of a precise task is easier to automate than non-routine tasks that require flexibility or complex problem solving (Autor 2015; Brandes and Wattenhofer 2016; Muro, Maxim and Whiton 2019; OECD 2016; Spitz-Oener 2006). Because many occupations involve routine tasks, automation may change the nature of work for a broad range of workers. Technological advancements may also increase the demand for workers who are adept at completing non-routine tasks, resulting in workers shifting away from occupations that primarily involve routine tasks toward those that primarily involve non-routine tasks (Acemoglu and Autor 2010).
Studies from Europe and the United States that employed the task-based approach have confirmed increases in the share of workers employed in occupations with a high intensity of non-routine cognitive and non-routine manual and physical tasks, as well as decreases in the share of workers employed in occupations that involve primarily routine cognitive or routine manual and physical tasks (Autor, Levy and Murnane 2003; Hardy, Keister and Lewandowski 2015; Levy and Murnane 2013; Spitz-Oener 2006).Note
Researchers examining changes in occupational task groups have noted the important role of the educational structure of the workforce. Hardy, Keister and Lewandowski (2018) concluded that increases in Europeans’ educational attainment played a central role in shifts from occupations involving routine manual tasks toward occupations involving more non-routine cognitive tasks. Furthermore, Spitz-Oener (2006) argued that increases in the need for workers proficient in non-routine analytical and interactive tasks resulted in greater demand for highly educated workers, thereby increasing the proportion of workers with a postsecondary education.
While discussions on the effects of automation technology have focused primarily on routine work, recent progress in artificial intelligence has facilitated the automation of more complex tasks. In particular, advances in deep machine learningNote indicate that technology may become proficient in more complex cognitive tasks. The effects of this technology have become apparent over the past decade with the introduction of products that use deep learning methods.Note Some have suggested that these advancements may affect high-skilled, knowledge-based jobs (Brandes and Wattenhofer 2016; OECD 2016; Susskind and Susskind 2015). However, the automation of many of the cognitive tasks that machine learning could theoretically accomplish is still not yet possible because the learning methods are based largely on incomplete and inconsistent information (Shestakofsky 2017). Further, non-routine manual and physical tasks are generally not regarded as automatable at this time, as they require a high degree of adaptability in different situations (Autor 2013; Autor, Levy and Murnane 2003).
This study examines two aspects of the changing nature of work in Canada.
First, changes in the specific work tasks of Canadians are investigated. Overall, 16 work tasks are examined, representing non-routine cognitive analytical tasks, non-routine cognitive interpersonal tasks, routine cognitive tasks, routine manual tasks, and non-routine manual and physical tasks. The data required for this part of the analysis are available only for the 2011-to-2018 period. However, this period coincides with major developments in artificial intelligence. Although technological advancements in artificial intelligence are still largely in the development stage, the results presented in this study will provide insight into which work tasks are more likely to change as these technologies become more integrated into the workplace.
The second part of the analysis examines changes in the share of workers employed in different occupational task groups over a 31-year period, with a focus on the degree of routine or non-routine and cognitive or manual tasks required in workers’ occupations. The introduction of automation technology and labour-saving software in past decades has contributed to several changes in the workplace. For example, the development of automated teller machines (ATMs) in the 1970s and rapid growth in the use of these machines in subsequent decades resulted in a decreased number of tellers within bank branchesNote (Autor 2015). The introduction of ATMs also changed the work tasks of tellers, as their jobs became more focused on financial advising and sales tasks, such as introducing customers to new banking services (e.g., credit cards and investment products).
Advancements in computerization and robotics also changed workers’ tasks across other industries. The use of electronic spreadsheet software became increasingly common in the early 1980s (Power 2000), facilitating data entry activities for office workers. Many job tasks of workers in the manufacturing industry, such as welding, painting and assembling, have also been automated since the 1980s (Acemoglu and Restrepo 2019).
This study will address the following research questions:
- In light of recent advances in automation technology, how has the importance of specific job tasks of Canadian workers changed between 2011 and 2018?
- How has the share of Canadian workers employed in four occupational task groups—non-routine cognitive, non-routine manual, routine cognitive, routine manual—evolved over the past 31 years?
- Do the trends in the share of Canadian workers employed in the four occupational task groups differ by sex, age and education level?
The remainder of this article discusses the data and methods in the next section, presents the results next, and then concludes in the final section.
Data and methods
Data
Two data sources were used in this study: Statistics Canada’s Labour Force Survey (LFS) and Occupational Information Network (O*NET) data from the U.S. Department of Labor.
The LFS is a monthly household survey that covers individuals aged 15 and older. Excluded from the LFS are those living on reserves and other Indigenous settlements in the provinces, full-time members of the Canadian Armed Forces, the institutionalized population, and households in remote areas with low population density. These exclusions account for about 2% of the target population (Statistics Canada 2017a).
The LFS has a rotating panel sample design, which retains households in the sample for six consecutive months. For the purposes of this study, individuals were included in the sample only during their first month of participation in the survey. Furthermore, only individuals who reported having an occupation and who worked as an employee in the private or public sector were included in the sample. Self-employed individuals were excluded from this analysis.Note
The first set of results examines changes in the work tasks of Canadians between 2011 and 2018. Work task data were obtained from O*NETNote and combined with the LFS data. O*NET is a database that provides information on the requirements of occupations, such as abilities and work activities, as well as information on the work context of occupations (e.g., structured versus unstructured work, importance of task repetition). For the purposes of this study, the occupational measures examined are generally referred to as work tasks throughout the paper. Sample sizes ranged from 126,696 (in 2018) to 135,384 (in 2011).
The analysis of work tasks examines changes between 2011 and 2018. This time range was chosen primarily because of the need for an occupational concordance to link O*NET and LFS occupational data. Because the LFS uses 2011 National Occupational Classification (NOC) codes and O*NET uses 2010 Standard Occupational Classification (SOC) codes from 2011 onward, a SOC 2010–NOC 2011 concordance based on the similarity of occupational titles was employed.Note Of the 500 NOC 2011 codes, five occupations (representing 0.2% of the Canadian workforce) had to be dropped because they did not have a U.S. equivalent. Of the remaining 495 codes, 235 were matched with only one SOC 2010 code (i.e., only one six-digit SOC 2010 code was matched with one or more four-digit NOC 2011 codes). In these cases, the work tasks associated with the SOC 2010 code were assigned to the corresponding NOC 2011 code. The remaining 260 NOC 2011 codes were matched with more than one SOC 2010 code, so an unweighted average of the work task values across the associated SOC 2010 codes was taken.Note
The second set of results focuses on changes in the share of workers in different occupational task groups. This part of the analysis used LFS data from 1987 to 2018 only. The broad analytical sample sizes vary by year, from a low of 125,231 (in 1999) to a high of 164,315 (in 1991).Note More detailed analyses were also conducted to examine changes in the share of workers across three sociodemographic factors: sex, age and education level. Results for educational differences are reported from 1990 to 2018 only because the educational categories in the LFS before and after 1990 are not comparable. In particular, the data for 1990 and beyond refer to the highest level of education completed, while the data prior to 1990 are based on the number of years of schooling.
Methods
This study examines two aspects of changes in the nature of work among Canadian workers.
The first part of the analysis focuses on specific work tasks. While previous research grouped several O*NET work tasks together to create composite measures of task-based groups (Acemoglu and Autor 2010; Górka et al. 2017; Hardy, Keister and Lewandowski 2018), some concerns have been raised regarding the risk of misclassifying tasks as routine or non-routine (Green 2012).Note To address this issue, this study used the same set of O*NET work tasks as previous studies that used composite measures, but instead examined each item independently. This approach provides a more detailed account of how specific work tasks have changed in Canada.
Although O*NET provides data on many work activities, this study used a subset of 16 work tasks considered to be representative of five distinct task groups, as established by previous studies (e.g., Autor and Handel 2013; Hardy, Keister and Lewandowski 2018): non-routine cognitive analytical, non-routine cognitive interpersonal, routine cognitive, routine manual, and non-routine manual and physical.
The work tasks selected are identified below:
- non-routine cognitive analytical tasks: analyzing data or information, thinking creatively, and interpreting the meaning of information for others
- non-routine cognitive interpersonal tasks: establishing and maintaining interpersonal relationships; guiding, directing and motivating subordinates; and coaching and developing others
- routine cognitive tasks: repeating the same tasks, being exact or accurate, and structured versus unstructured workNote
- routine manual tasks: pace determined by speed of equipment, controlling machines and processes, and time spent making repetitive motions
- non-routine manual and physical tasks: operating vehicles, mechanized devices or equipment; time spent using hands to handle, control or feed objects, tools or controls; spatial orientation; and manual dexterity.
Most of the work tasks are measured on an importance scale ranging from 1 (not important) to 5 (extremely important).Note However, three items—structured versus unstructured work; time spent making repetitive motions; and time spent using hands to handle, control or feed objects, tools or controls—are based on different scales. Structured versus unstructured work represents the extent to which a job is structured for the worker versus allowing the worker to determine their tasks, priorities and goals. This measure is based on a scale of 1 (no freedom) to 5 (a lot of freedom) that represents a worker’s degree of autonomy in their job. The latter two tasks are based on a frequency scale ranging from 1 (never) to 5 (continually or almost continually).Note
Second, changes in the relative share of workers employed in four broad occupational task groups were examined over a 31-year period. These groups are based on a conceptual framework introduced by Autor, Levy and Murnane (2003) and employed in subsequent studies (e.g., Acemoglu and Autor 2010; Autor and Handel 2013; Hardy, Keister and Lewandowski 2018; Spitz-Oener 2006). This task-based framework distinguishes between occupations along two dimensions: the extent to which tasks are routine or non-routine, and the extent to which tasks are cognitive or manual. The four groups are categorized as follows:
- managerial, professional and technical occupations—specialized in non-routine cognitive tasks
- service occupations—specialized in non-routine manual tasks
- sales, clerical and administrative support occupations—specialized in routine cognitive tasks
- production, craft, repair and operative occupations—specialized in routine manual tasks.
The occupations of Canadian workers were assigned to one of these four groups for each year of the LFS through a multi-stage process. First, the 10 broad occupational groups used by Acemoglu and Autor (2010) were aligned with similar occupational groups in the NOC 2011.Note Second, the appropriateness of each NOC major group to the assigned occupational task group was assessed. This step resulted in the movement of two major groups.Note Appendix Charts 1-1 and 1-2 illustrate how NOC 2011 major groups were assigned to the four task-based categories.Note
The first set of results indicate the percentage change in the average importanceNote score of each work activity between 2011 and 2018.Note Next, the relative shares of workers employed in each occupational task group from 1987 to 2018 are shown, as well as the percentage change in the share of workers in each task group relative to 1987. This is followed by the percentage-point change between 1987 and 2018 in the share of workers employed in the four occupational task groups by sex, age group and education level.
Lastly, regression analyses examining the extent to which changes observed in the employment shares of Canadians in each occupational task group can be explained by industrial shifts over time are presented. Regression models for the occupational task groups were based on pooled data from the 1987 and 2018 LFS. Four regressions were run for each occupational task group. The dependent variables were binary variables indicating whether individuals were employed in (a) management, professional and technical occupations; (b) service occupations; (c) sales, clerical and administrative support occupations; or (d) production, craft, repair and operative occupations. Two independent variables were included in each regression model: year (reference group=1987) and industry fixed effects (five-digit industries based on the 2012 North American Industry Classification System [NAICS]).Note
Results
Changes in Canadians’ work tasks, 2011 to 2018
This section presents the percentage change in the average importance score of work tasks between 2011 and 2018. Although this is a relatively short time period in which to measure changes in occupational tasks, it coincides with advancements in artificial intelligence, particularly in machine learning. While these new technologies are still largely in development, some have been introduced in Canadian workplaces. For example, the density of industrial robots in Canada increased by almost 50% between 2010 and 2015, and this may affect the tasks of workers employed in the manufacturing industry.Note
Therefore, the results presented in this section indicate how workers’ tasks may have been affected in recent years by the introduction of new automation technologies, providing insight into which work tasks may increase in importance with greater integration of these technologies into the workplace. Changes in the importance of work tasks could be the result of changes over time in the importance of different work tasks within occupationsNote or of compositional shifts across occupations, i.e., changes in the proportion of workers employed in different occupations.Note
Overall, the average importance scores of all non-routine cognitive analytical tasks and non-routine cognitive interpersonal tasks increased between 2011 and 2018 (Chart 1).Note The largest increases were observed for non-routine cognitive tasks: analyzing data or information (3.7%); coaching and developing others (3.6%); and guiding, directing and motivating subordinates (3.5%). Increases were also observed across other non-routine cognitive analytical tasks and non-routine cognitive interpersonal tasks. For example, the importance of interpreting the meaning of information for others increased by 3.2%, and the importance of thinking creatively increased by 2.8%. The importance of establishing and maintaining interpersonal relationships increased by a smaller magnitude (1.5%).
Advances in automation-related technology do not appear to have affected the importance of routine cognitive tasks in Canadian workers’ jobs on a large scale. There were small increases in the importance of being exact or accurate (1.5%) and in the importance of repeating the same tasks (0.6%), which measures cognitive-based tasks such as data entry and checking entries in a ledger. The degree of autonomy that workers had in determining their tasks also increased by 1.6% (structured versus unstructured work).

Data table for Chart 1
| Percentage change | ||
|---|---|---|
| Non-routine cognitive analytical |
Analyzing data or information | 3.7Note *** |
| Thinking creatively | 2.8Note *** | |
| Interpreting the meaning of information for others | 3.2Note *** | |
| Non-routine cognitive interpersonal |
Establishing and maintaining interpersonal relationships | 1.5Note *** |
| Guiding, directing and motivating subordinates | 3.5Note *** | |
| Coaching and developing others | 3.6Note *** | |
| Routine cognitive | Repeating the same tasks | 0.6Note *** |
| Being exact or accurate | 1.5Note *** | |
| Structured vs. unstructured work (degree of autonomy in determining tasks) |
1.6Note *** | |
| Routine manual | Pace determined by speed of equipment | -2.9Note *** |
| Controlling machines and processes | 1.2Note *** | |
| Time spent making repetitive motions (frequency) |
0.6Note *** | |
| Non-routine manual and physical |
Operating vehicles, mechanized devices or equipment | -0.3n.s. |
| Time spent using hands to handle, control or feed objects, tools or controls (frequency) |
-0.7Note *** | |
| Spatial orientation | 0.4Note * | |
| Manual dexterity | -0.8Note *** | |
† significantly different than zero (p < 0.10) n.s. not significantly different than zero Notes: For work tasks that are not measured with the importance scale, the scale of measurement is noted in parentheses. The percentage change was estimated by regressing the natural logarithm of the importance of each work task (separately) on a dummy variable for the year 2018, where data from 2011 and 2018 were pooled. Specifically, the percentage change was estimated as e(b) -1, where natural e equals approximately 2.71828, and b is the regression coefficient associated with the dummy year variable. Sources: Statistics Canada, Labour Force Survey, 2011 and 2018; and U.S. Department of Labor, O*NET, 2011 and 2018. |
||
There were varying results with regard to the importance of routine manual tasks between 2011 and 2018. For example, the pace at which workers’ tasks were determined by the speed of equipment decreased by 2.9% between 2011 and 2018, while the importance of controlling machines and processes (not including computers or vehicles) increased by 1.2%. The importance of Canadian workers spending time making repetitive motions in their jobs actually increased between 2011 and 2018, albeit very moderately (0.6%).
Some small decreases were observed across non-routine manual and physical work tasks. Among these tasks, the greatest decrease was in the importance of manual dexterity (0.8%), followed by a reduction in the time workers spent using their hands to handle, control or feed objects, tools or controls (0.7%). However, the importance of spatial orientationNote increased slightly between 2011 and 2018 (0.4%). There was no statistically significant change in the importance of operating vehicles, mechanized devices or equipment between 2011 and 2018.
In summary, there is evidence that the importance of non-routine cognitive analytical and non-routine cognitive interpersonal tasks increased moderately between 2011 and 2018—a period marked by significant advances in the development of artificial intelligence and machine learning. Therefore, with increased integration of these technologies into the workplace, the importance of these types of tasks would be expected to increase. Conversely, the importance of some routine and non-routine manual tasks declined over the same time period. However, some small increases were also observed across routine manual work tasks.
Employment shares of Canadian workers by occupational task group, 1987 to 2018
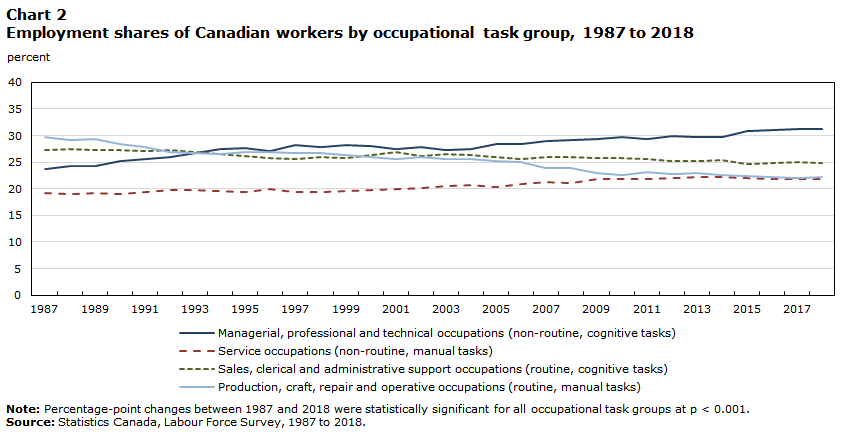
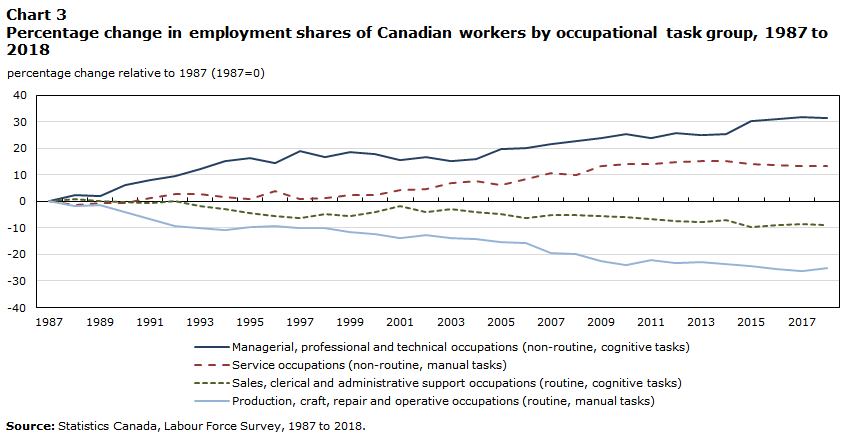
The share of Canadian workers employed in the four occupational task groups changed considerably over the 31-year period studied.Note The proportion of Canadian workers employed in jobs that involving primarily non-routine tasks increased between 1987 and 2018, while there was a decrease in the share of workers employed in jobs involving primarily routine tasks (charts 2 and 3). Interestingly, in all cases, the changes were gradual over the three decades. The changes registered over the last decade—a period of rapid advances in artificial intelligence and machine learning—were no greater than the changes observed in either of the two previous decades.Note
The shift from routine to non-routine jobs is particularly noticeable when comparing the share of workers employed in managerial, professional and technical occupations (non-routine, cognitive tasks) with production, craft, repair and operative occupations (routine, manual tasks). Between 1987 and 2018, there was an increase of 7.5 percentage points in the share of workers in management, professional and technical occupations and a decrease of 7.5 percentage points in the share of Canadians employed in production, craft, repair and operative occupations.Note The results show a steady divergence between these two occupational groups after the mid-1990s (Chart 2).
Data table for Chart 2
| Managerial, professional and technical occupations (non-routine, cognitive tasks) | Service occupations (non-routine, manual tasks) | Sales, clerical and administrative support occupations (routine, cognitive tasks) | Production, craft, repair and operative occupations (routine, manual tasks) | |
|---|---|---|---|---|
| percent | ||||
| 1987 | 23.76 | 19.21 | 27.33 | 29.69 |
| 1988 | 24.32 | 18.95 | 27.53 | 29.19 |
| 1989 | 24.22 | 19.12 | 27.34 | 29.32 |
| 1990 | 25.19 | 19.06 | 27.26 | 28.48 |
| 1991 | 25.64 | 19.43 | 27.17 | 27.76 |
| 1992 | 26.02 | 19.71 | 27.35 | 26.92 |
| 1993 | 26.66 | 19.74 | 26.9 | 26.71 |
| 1994 | 27.38 | 19.55 | 26.57 | 26.5 |
| 1995 | 27.68 | 19.4 | 26.09 | 26.82 |
| 1996 | 27.19 | 19.98 | 25.86 | 26.97 |
| 1997 | 28.27 | 19.41 | 25.58 | 26.74 |
| 1998 | 27.77 | 19.47 | 26.01 | 26.75 |
| 1999 | 28.22 | 19.64 | 25.87 | 26.27 |
| 2000 | 28.04 | 19.68 | 26.27 | 26.01 |
| 2001 | 27.43 | 20.05 | 26.88 | 25.64 |
| 2002 | 27.77 | 20.11 | 26.23 | 25.89 |
| 2003 | 27.33 | 20.53 | 26.53 | 25.62 |
| 2004 | 27.51 | 20.68 | 26.28 | 25.53 |
| 2005 | 28.42 | 20.41 | 26.01 | 25.17 |
| 2006 | 28.49 | 20.86 | 25.61 | 25.04 |
| 2007 | 28.9 | 21.25 | 25.95 | 23.89 |
| 2008 | 29.18 | 21.08 | 25.9 | 23.84 |
| 2009 | 29.44 | 21.75 | 25.8 | 23.01 |
| 2010 | 29.81 | 21.91 | 25.7 | 22.58 |
| 2011 | 29.42 | 21.93 | 25.52 | 23.13 |
| 2012 | 29.88 | 22.03 | 25.28 | 22.81 |
| 2013 | 29.72 | 22.16 | 25.17 | 22.95 |
| 2014 | 29.81 | 22.15 | 25.38 | 22.65 |
| 2015 | 30.92 | 21.94 | 24.7 | 22.44 |
| 2016 | 31.13 | 21.85 | 24.89 | 22.12 |
| 2017 | 31.29 | 21.76 | 25.01 | 21.94 |
| 2018 | 31.22 | 21.75 | 24.85 | 22.18 |
|
Note: Percentage-point changes between 1987 and 2018 were statistically significant for all occupational task groups at p < 0.001. Source: Statistics Canada, Labour Force Survey, 1987 to 2018. |
||||
Data table for Chart 3
| Managerial, professional and technical occupations (non-routine, cognitive tasks) | Service occupations (non-routine, manual tasks) | Sales, clerical and administrative support occupations (routine, cognitive tasks) | Production, craft, repair and operative occupations (routine, manual tasks) | |
|---|---|---|---|---|
| percentage change relative to 1987 (1987=0) | ||||
| 1987 | 0 | 0 | 0 | 0 |
| 1988 | 2.36 | -1.35 | 0.73 | -1.68 |
| 1989 | 1.94 | -0.47 | 0.04 | -1.25 |
| 1990 | 6.02 | -0.78 | -0.26 | -4.08 |
| 1991 | 7.91 | 1.15 | -0.59 | -6.50 |
| 1992 | 9.51 | 2.60 | 0.07 | -9.33 |
| 1993 | 12.21 | 2.76 | -1.57 | -10.04 |
| 1994 | 15.24 | 1.77 | -2.78 | -10.74 |
| 1995 | 16.50 | 0.99 | -4.54 | -9.67 |
| 1996 | 14.44 | 4.01 | -5.38 | -9.16 |
| 1997 | 18.98 | 1.04 | -6.40 | -9.94 |
| 1998 | 16.88 | 1.35 | -4.83 | -9.90 |
| 1999 | 18.77 | 2.24 | -5.34 | -11.52 |
| 2000 | 18.01 | 2.45 | -3.88 | -12.39 |
| 2001 | 15.45 | 4.37 | -1.65 | -13.64 |
| 2002 | 16.88 | 4.69 | -4.02 | -12.80 |
| 2003 | 15.03 | 6.87 | -2.93 | -13.71 |
| 2004 | 15.78 | 7.65 | -3.84 | -14.01 |
| 2005 | 19.61 | 6.25 | -4.83 | -15.22 |
| 2006 | 19.91 | 8.59 | -6.29 | -15.66 |
| 2007 | 21.63 | 10.62 | -5.05 | -19.54 |
| 2008 | 22.81 | 9.73 | -5.23 | -19.70 |
| 2009 | 23.91 | 13.22 | -5.60 | -22.50 |
| 2010 | 25.46 | 14.06 | -5.96 | -23.95 |
| 2011 | 23.82 | 14.16 | -6.62 | -22.09 |
| 2012 | 25.76 | 14.68 | -7.50 | -23.17 |
| 2013 | 25.08 | 15.36 | -7.90 | -22.70 |
| 2014 | 25.46 | 15.30 | -7.14 | -23.71 |
| 2015 | 30.13 | 14.21 | -9.62 | -24.42 |
| 2016 | 31.02 | 13.74 | -8.93 | -25.50 |
| 2017 | 31.69 | 13.27 | -8.49 | -26.10 |
| 2018 | 31.40 | 13.22 | -9.07 | -25.29 |
| Source: Statistics Canada, Labour Force Survey, 1987 to 2018. | ||||
Although production, craft, repair and operative occupations accounted for the highest share of Canadian workers in 1987 (29.7%, Chart 2), the proportion of Canadian workers employed in management, professional and technical occupations surpassed this occupational task group around 1994. By 2018, more than 3 in 10 (31.2%, Chart 2) Canadian workers were employed in management, professional and technical occupations—the highest proportion of workers across all occupational task groups. In contrast, 22.2% of workers were employed in production, craft, repair and operative occupations by 2018 (Chart 2).
The share of workers employed in service occupations (non-routine, manual tasks) also increased, although to a lesser extent than that in managerial, professional and technical occupations. The proportion of Canadians working in service occupations increased by 2.5 percentage points between these years—an increase of 13.2% (Chart 3). Although service occupations accounted for the lowest share of Canadian workers throughout the entire 31-year period, the results indicate that there was a convergence between the shares of Canadian workers employed in service occupations and production, craft, repair and operative occupations in recent years. By 2018, 21.8% of Canadians were employed in service occupations (Chart 2).
However, the share of workers in service occupations has more or less ceased to grow since 2010. Chart 1 shows that the importance of non-routine manual and physical tasks declined moderately between 2011 and 2018. Together these results may suggest that technology is now being used to do more complex physical tasks, and this is reducing the importance or frequency of such tasks for service workers. Whether service workers adjust by focusing on more productive tasks that are still out of scope for robots remains to be seen, but, for the moment, employment shares have remained steady in this broad occupational group.
A decline in the proportion of Canadian workers employed in sales, clerical and administrative support occupations (routine, cognitive tasks) was also observed. The employment share in these occupations decreased by 2.5 percentage points between 1987 and 2018 (a 9.1% decrease, Chart 3). However, sales, clerical and administrative support occupations still accounted for the second-highest share of workers in 2018 (24.9%, Chart 2).
Additional analysis was conducted at the NOC major groupNote level to confirm the trends observed (Appendix Charts 1-1 and 1-2). Generally, the majority of occupations associated with non-routine tasks increased their share of workers between 1987 and 2018. In particular, the share of workers employed in assisting occupations in support of health services (service occupations) increased by 140.9% between 1987 and 2018. However, the share of workers in some management occupations and service occupations declined during this same period.Note Decreases were observed across most occupations associated with routine tasks, with a few exceptions among sales, clerical and administrative support occupations.Note
In summary, there was a gradual shift from occupations involving routine tasks to occupations involving non-routine tasks over the past three decades. This trend was not more evident over the last decade, which has been marked by significant advances in automation technology.
Relative employment shares of occupational task groups by sex, age group and education level
The previous section provided a general picture of how the nature of work in Canada has changed over the last three decades. However, differences may exist between different sociodemographic groups. This section examines changes in the relative employment share of workers employed in the occupational task groups by sex, age group and education level over the same period.Note
Changes in the share of workers in the four occupational task groups among men and women are presented in Chart 4. Generally, increases in the proportion of workers in non-routine occupations were observed for both genders. However, women’s growth in management, professional and technical occupations (non-routine, cognitive tasks) was more pronounced than that of men (increases of 9.8 and 5.2 percentage points, respectively). Smaller increases in the shares of service occupations (non-routine, manual tasks) were observed for both men and women.

Data table for Chart 4
| Men | Women | |
|---|---|---|
| percentage-point change | ||
| Managerial, professional and technical occupations | 5.2Note *** | 9.8Note *** |
| Service occupations | 1.9Note *** | 2.2Note *** |
| Sales, clerical and administrative support occupations | 1.3Note *** | -8.4Note *** |
| Production, craft, repair and operative occupations | -8.3Note *** | -3.6Note *** |
** significantly different than zero (p < 0.01) † significantly different than zero (p < 0.10) Source: Statistics Canada, Labour Force Survey, 1987 and 2018. |
||
Among occupations that involve routine tasks, some statistically significant differences were observed by sex. The share of male workers in sales, clerical and administrative support occupations (routine, cognitive tasks) increased by 1.3 percentage points, while women’s share decreased by 8.4 percentage points. Employment shares in production, craft, repair and operative occupations (routine, manual tasks) decreased in general, but more so for men than for women (8.3 and 3.6 percentage points, respectively).
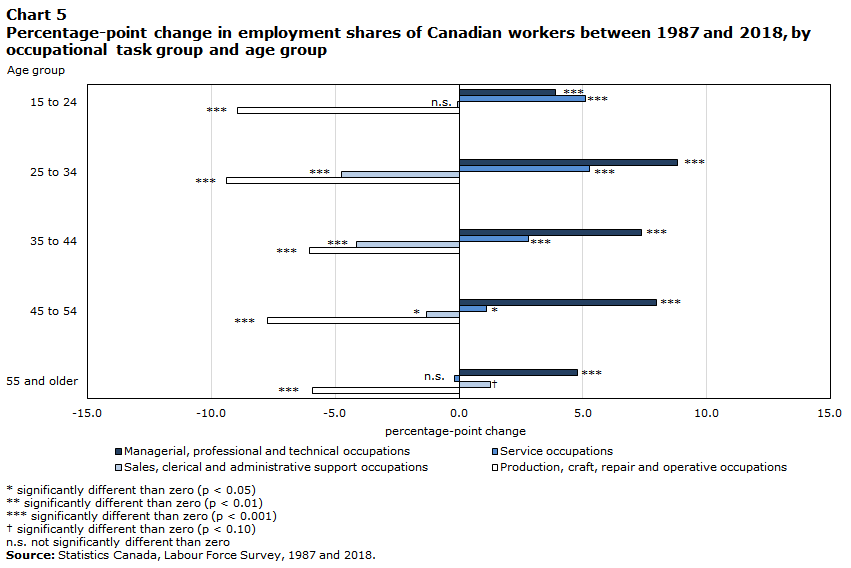
Results by age group show similar trends for occupational task groups that involve non-routine tasks (Chart 5). The proportion of Canadian workers employed in managerial, professional and technical occupations (non-routine, cognitive tasks) increased across all age groups, while the employment shares for service occupations (non-routine, manual tasks) increased for all but the oldest age group (55 years and older).Note The largest increase in employment shares in service occupations was observed among workers aged 25 to 34 and those aged 15 to 24 (5.3 and 5.1 percentage points, respectively).
The shares of workers employed in routine occupational task groups decreased across most age groups. Declines were particularly notable in production, craft, repair and operative occupations (routine, manual tasks). The proportion of workers in sales, clerical and administrative support occupations (routine, cognitive tasks) also decreased for the middle age groups (25 to 54 years old).
Data table for Chart 5
| 15 to 24 | 25 to 34 | 35 to 44 | 45 to 54 | 55 and older | |
|---|---|---|---|---|---|
| percentage-point change | |||||
| Managerial, professional and technical occupations | 3.9Note *** | 8.8Note *** | 7.4Note *** | 8.0Note *** | 4.8Note *** |
| Service occupations | 5.1Note *** | 5.3Note *** | 2.8Note *** | 1.1Note * | -0.2n.s. |
| Sales, clerical and administrative support occupations | -0.1n.s. | -4.7Note *** | -4.2Note *** | -1.3Note * | 1.3Data table Note † |
| Production, craft, repair and operative occupations | -9.0Note *** | -9.4Note *** | -6.0Note *** | -7.7Note *** | -5.9Note *** |
n.s. not significantly different than zero Source: Statistics Canada, Labour Force Survey, 1987 and 2018. |
|||||
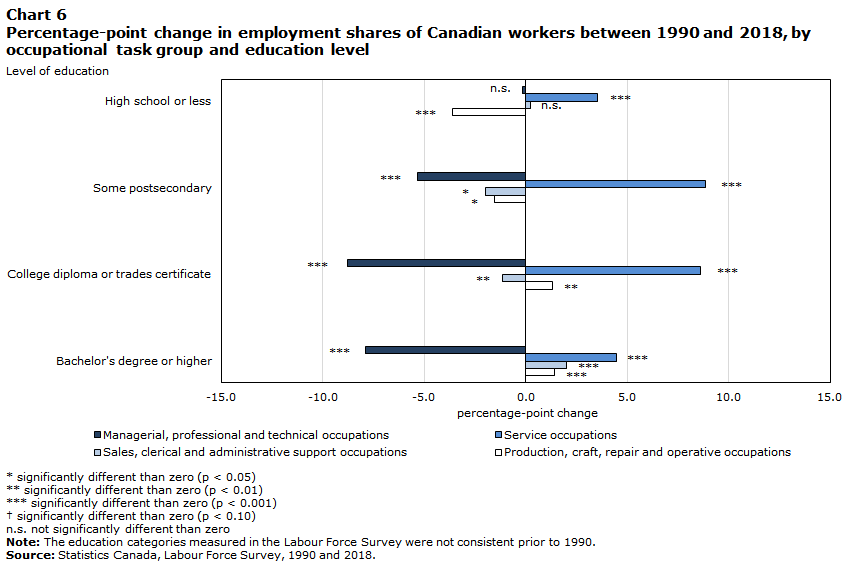
Across all education groups, employment shares of workers in managerial, professional and technical occupations (non-routine, cognitive tasks) decreased between 1990 and 2018, with the exception of those with a high school diploma or less, who registered no significant change (Chart 6). The largest declines in managerial, professional and technical occupations were among workers with a postsecondary education credential, decreasing by 8.8 percentage points for workers with a college or trades certificate or diploma and by 7.9 percentage points for workers with a bachelor’s degree or higher.
Data table for Chart 6
| High school or less | Some postsecondary | College diploma or trades certificate | Bachelor's degree or higher | |
|---|---|---|---|---|
| percentage-point change | ||||
| Managerial, professional and technical occupations | -0.2n.s. | -5.4Note *** | -8.8Note *** | -7.9Note *** |
| Service occupations | 3.5Note *** | 8.9Note *** | 8.6Note *** | 4.5Note *** |
| Sales, clerical and administrative support occupations | 0.2n.s. | -2.0Note * | -1.1Note ** | 2.0Note *** |
| Production, craft, repair and operative occupations | -3.6Note *** | -1.5Note * | 1.3Note ** | 1.4Note *** |
n.s. not significantly different than zero Note: The education categories measured in the Labour Force Survey were not consistent prior to 1990 Source: Statistics Canada, Labour Force Survey, 1990 and 2018. |
||||
The shares of workers employed in service occupations (non-routine, manual tasks) increased across all education groups. The largest percentage-point increases in the employment shares in service occupations were among workers with some postsecondary education (8.9 percentage points) and workers with a college or trades certificate or diploma (8.6 percentage points).Note
The trends for occupations involving routine tasks varied across education groups. While the proportion of sales, clerical and administrative support occupations (routine, cognitive tasks) among those with a bachelor’s degree or higher increased by 2.0 percentage points, the share of these occupations decreased slightly (by 1.1 percentage points) for those with some postsecondary education or a college or trades certificate or diploma. Similarly, the proportion of workers in production, craft, repair and operative occupations (routine, manual tasks) increased by 1.4 percentage points between 1990 and 2018 for the university-educated group, while the share of workers in this occupational task group decreased among those with no completed postsecondary education.Note
Workers with a high school diploma or less generally had the smallest changes in the relative shares of most occupation groups. One notable exception was in the share of these workers in production, craft, repair and operative occupations (routine, manual tasks), which declined by 3.6 percentage points (more than any other education group).
An examination of changes in the share of workers in Canada by education level requires some consideration of the significant increase in the proportion of Canadians who completed a postsecondary education over the past few decades. According to the LFS, while just over 1 in 8 paid workers had a university degree in 1990 (13.1%), nearly 3 in 10 had this level of education in 2018 (29.1%).Note Therefore, while this increase in educational attainment may result in an increase in the absolute number of university-educated workers employed in an occupational task group, it may also contribute to an overall decrease in the share of workers in that group. Acemoglu and Autor (2010) acknowledged that a large increase in the number of workers with higher levels of education inevitably results in a portion of this group entering lower-skilled occupations.
Therefore, while the share of workers holding a university degree increased rapidly over the last three decades, and university graduates were the most likely group to be employed in management, professional and technical operations (non-routine, cognitive tasks), the employment share of these occupations for university graduates, as well as individuals with some postsecondary education or a college or trades certificate or diploma, decreased over the study period.
In summary, a gradual shift from routine to non-routine occupational task groups over the past three decades was generally observed across most sociodemographic groups, albeit with some exceptions. For example, while women were less likely to be employed in jobs associated with routine cognitive tasks, men became more likely to be employed in these jobs over the 31 years studied. Additionally, while increases in non-routine occupations were observed across most age groups, workers aged 55 and older remained equally likely to be employed in jobs associated with non-routine manual tasks and became more likely to be employed in jobs associated with routine cognitive tasks.Note
Lastly, despite an overall increase in the share of workers in jobs associated with non-routine cognitive tasks, decreased employment shares were observed among all groups of workers with at least some postsecondary education for this occupational task group. These trends occurred as the share of Canadian workers with a postsecondary qualification increased substantially over the past three decades. While there is evidence that a university education generally decreases a worker’s risk of automation-related job transformation (Frenette and Frank 2020), the large increase in postsecondary-educated workers during the period of study resulted in some of these workers moving into jobs for which they may be overqualified. Consequently, these workers may be more affected by automation technology than their counterparts working in occupations requiring a university degree. Further investigation of the distribution of postsecondary-educated workers across different occupational groups could provide greater insight into the extent to which these workers will be affected by changes to the nature of work.
Accounting for shifts in Canada’s industrial structure
The previous section provided an overview of changes in the share of Canadians employed in different occupational task groups across a 31-year period. However, these shifts may be the result of changes in the industrial structure rather than in technology-induced task demand. For example, an increase in the share of the population aged 65 and older may prompt industrial shifts, such as a higher demand for health care services (Maestas, Mullen and Powell 2016). This is evident in the increase observed in the share of Canadian workers employed in assisting occupations in support of health services between 1987 and 2018 (see Appendix Charts 1-1 and 1-2)—a period during which the proportion of seniors increased from 10.7% to 17.2% of the population.Note
This section examines how the share of workers in each occupational task group has changed, and also accounts for shifts in the industrial structure. More specifically, separate regression models were run for each occupational task group, which produced estimates of changes in the share of workers in an occupational task group between 1987 and 2018, while also accounting for industrial changes.Note
Shifts in Canada’s industrial structure partially explained changes in the employment shares of workers across all four occupational task groups (Chart 7). Accounting for industrial shifts had a particular influence on the results for service occupations (non-routine, manual tasks). While the results without controls showed an increase in the share of Canadian workers employed in service occupations, accounting for industry resulted in no statistically significant change over the 31-year period studied for this occupational task group. As noted above, this result may be partly the result of industrial changes attributable to the aging population, contributing to an increase in the share of Canadians working in health services.Note
Changes in the industrial structure also accounted—in part—for the changes observed for the other three occupational task groups to varying extents. About two-thirds of the decrease in the share of workers employed in production, craft, repair and operative occupations (routine, manual tasks) between 1987 and 2018 was attributable to a shift away from industrial sectors composed of occupations involving routine manual tasks. This was likely driven by the decline in routine-intensive manufacturing jobs.Note ,Note However, the decrease in the share of workers employed in this occupational task group remained statistically significant even when changes in the industrial structure were taken into account.
Industrial shifts also explained some of the changes in the share of workers employed in occupations with a high intensity of cognitive tasks. Two-fifths of the increase in management, professional and technical occupations (non-routine, cognitive tasks) and just over one-quarter of the decrease in sales, clerical and administrative support occupations (routine, cognitive tasks) were explained by changes in Canada’s industrial structure between 1987 and 2018.
Shifts in industrial composition between 2011 and 2018 did not explain the changes in work tasks during this time periodNote (results available upon request). However, because of the short time period examined, the industrial structure would not have changed to the same extent as the 31-year period studied in the analysis of occupational task groups.Note
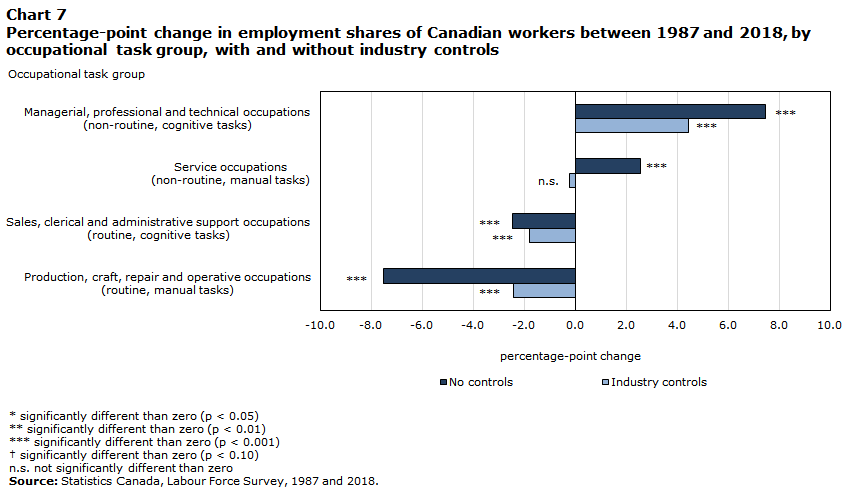
Data table for Chart 7
| No controls | Industry controls | |
|---|---|---|
| percentage-point change, 1987 to 2018 | ||
| Managerial, professional and technical occupations (non-routine, cognitive tasks) |
7.5Note *** | 4.4Note *** |
| Service occupations (non-routine, manual tasks) |
2.5Note *** | -0.2n.s. |
| Sales, clerical and administrative support occupations (routine, cognitive tasks) |
-2.5Note *** | -1.8Note *** |
| Production, craft, repair and operative occupations (routine, manual tasks) |
-7.5Note *** | -2.4Note *** |
** significantly different than zero (p < 0.01) † significantly different than zero (p < 0.10) n.s. not significantly different than zero Source: Statistics Canada, Labour Force Survey, 1987 and 2018. |
||
Conclusion
Discussions on the future of work have focused increasingly on the degree to which automation will affect workers’ jobs. Recent developments in artificial intelligence and machine learning, i.e., the prospect of automating more complex cognitive tasks, have added to these concerns. This study used a task-based approach to examine changes in specific work tasks between 2011 and 2018, providing further insight into how recent technological advancements may have affected the nature of Canadians’ work. In addition, the study established trends in the share of workers employed in various occupational task groups between 1987 and 2018. While less specific than examining changes in work tasks, this occupational approach provides historical context for more recent trends.
The results indicate that work tasks that are complementary to automation, such as non-routine cognitive analytical and interpersonal tasks, were increasingly important in Canadians’ jobs between 2011 and 2018. However, the evidence is less clear on routine and non-routine manual tasks, which automation technology may be able to replace in certain instances, depending on technological feasibility and other factors. Moreover, the magnitude of these changes was generally quite small.
Trends over the 31-year period studied reveal that clearer—but more gradual—shifts have occurred over the longer term, including well before the recent, significant advances in artificial intelligence and its practical applications. In particular, there was a gradual shift from occupations involving routine tasks to occupations involving non-routine tasks over the past three decades. The share of Canadians working in managerial, professional and technical occupations (non-routine, cognitive tasks) and service occupations (non-routine, manual tasks) increased, while the share of workers employed in production, craft, repair and operative occupations (routine, manual tasks) and sales, clerical and administrative support (routine, cognitive tasks) decreased over this period. Although some service jobs may be replaceable by automation technology, the increased relative employment in this occupation was explained in large part by changes in the industrial structure between 1987 and 2018.
Whether automation will result in job losses or changing work tasks in the near future remains to be seen. While gradual changes in the nature of work were observed over the 31-year period studied, events such as the COVID-19 pandemic may prompt employers to adopt automation technology more quickly. How Canadians’ work activities may be altered in response to the pandemic also remains to be seen. Regardless, it is clear that, as technological advances enable more tasks to be automated in the workplace, it will become increasingly important to monitor how Canadian jobs are changing.
Appendix - Chart
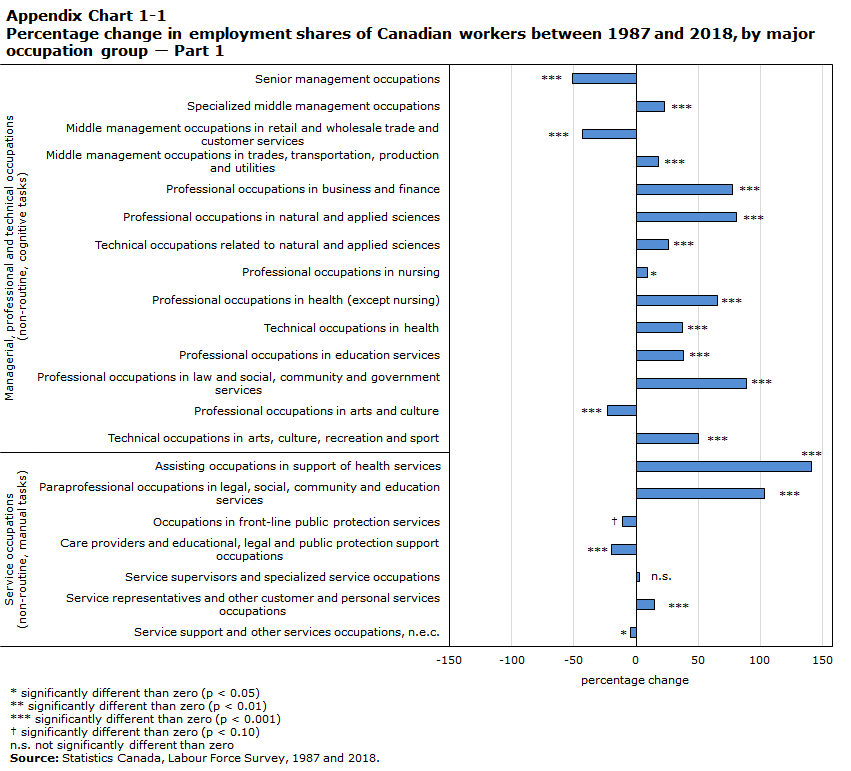
Data table for Chart 1-1
| Percentage change | ||
|---|---|---|
| Managerial, professional and technical occupations (non-routine, cognitive tasks) |
Senior management occupations | -50.85Note *** |
| Specialized middle management occupations | 22.67Note *** | |
| Middle management occupations in retail and wholesale trade and customer services | -43.16Note *** | |
| Middle management occupations in trades, transportation, production and utilities | 17.65Note *** | |
| Professional occupations in business and finance | 77.40Note *** | |
| Professional occupations in natural and applied sciences | 80.79Note *** | |
| Technical occupations related to natural and applied sciences | 26.22Note *** | |
| Professional occupations in nursing | 8.79Note * | |
| Professional occupations in health (except nursing) | 65.38Note *** | |
| Technical occupations in health | 37.06Note *** | |
| Professional occupations in education services | 38.34Note *** | |
| Professional occupations in law and social, community and government services | 88.37Note *** | |
| Professional occupations in arts and culture | -22.67Note *** | |
| Technical occupations in arts, culture, recreation and sport | 50.41Note *** | |
| Service occupations (non-routine, manual tasks) |
Assisting occupations in support of health services | 140.86Note *** |
| Paraprofessional occupations in legal, social, community and education services | 103.45Note *** | |
| Occupations in front-line public protection services | -11.27Data table Note † | |
| Care providers and educational, legal and public protection support occupations | -19.47Note *** | |
| Service supervisors and specialized service occupations | 2.58n.s. | |
| Service representatives and other customer and personal services occupations | 14.85Note *** | |
| Service support and other services occupations, n.e.c. | -4.50Note * | |
n.s. not significantly different than zero Source: Statistics Canada, Labour Force Survey, 1987 and 2018. |
||

Data table for Chart 1-2
| Percentage change | ||
|---|---|---|
| Sales, clerical and administrative support occupations (routine, cognitive tasks) |
Administrative and financial supervisors and administrative occupations | -13.80Note *** |
| Finance, insurance and related business administrative occupations | 12.26Note * | |
| Office support occupations | -39.00Note *** | |
| Distribution, tracking and scheduling co-ordination occupations | -32.45Note *** | |
| Retail sales supervisors and specialized sales occupations | 72.32Note *** | |
| Sales representatives and salespersons - wholesale and retail trade | -3.95Data table Note † | |
| Sales support occupations | 21.39Note *** | |
| Production, craft, repair and operative occupations (routine, manual tasks) |
Industrial, electrical and construction trades | -16.99Note *** |
| Maintenance and equipment operation trades | -24.88Note *** | |
| Other installers, repairers and servicers and material handlers | 2.75n.s. | |
| Transport and heavy equipment operation and related maintenance occupations | -13.30Note *** | |
| Trades helpers, construction labourers and related occupations | -18.71Note *** | |
| Supervisors and technical occupations in natural resources, agricultural and related production | 11.11Note * | |
| Workers in natural resources, agriculture and related production | -45.78Note *** | |
| Harvesting, landscaping and natural resources labourers | -18.00Note *** | |
| Processing, manufacturing and utilities supervisors and central control operators | -17.60Note *** | |
| Processing and manufacturing machine operators and related production workers | -50.38Note *** | |
| Assemblers in manufacturing | -38.66Note *** | |
| Labourers in processing, manufacturing and utilities | -45.00Note *** | |
n.s. not significantly different than zero Source: Statistics Canada, Labour Force Survey, 1987 and 2018. |
||
Appendix – Table
| 2011 | 2018 | |
|---|---|---|
| Mean score | ||
| Non-routine cognitive analytical tasks | ||
| Analyzing data or information | 3.018 | 3.119 |
| Thinking creatively | 3.090 | 3.163 |
| Interpreting the meaning of information for others | 3.014 | 3.098 |
| Non-routine cognitive interpersonal tasks | ||
| Establishing and maintaining interpersonal relationships | 3.651 | 3.701 |
| Guiding, directing and motivating subordinates | 2.700 | 2.792 |
| Coaching and developing others | 2.856 | 2.956 |
| Routine cognitive tasks | ||
| Structured versus unstructured work (degree of autonomy in determining tasks) | 3.924 | 3.944 |
| Repeating the same tasks | 3.290 | 3.331 |
| Being exact or accurate | 4.072 | 4.130 |
| Routine manual tasks | ||
| Pace determined by speed of equipment | 1.920 | 1.881 |
| Controlling machines and processes | 2.520 | 2.552 |
| Time spent making repetitive motions (frequency) | 3.149 | 3.162 |
| Non-routine manual and physical tasks | ||
| Operating vehicles, mechanized devices or equipment | 2.267 | 2.254 |
| Time spent using hands to handle, control or feed objects, tools or controls (frequency) | 3.309 | 3.287 |
| Spatial orientation | 1.495 | 1.499 |
| Manual dexterity | 2.441 | 2.408 |
|
Notes: The importance scale is ordinal and ranges from 1 (not important) to 5 (extremely important). Tasks that were not measured with the importance scale have the scale of measurement indicated in parentheses. These scales also range from 1 to 5. Source: Statistics Canada, Labour Force Survey, 2011 and 2018. |
||
References
Acemoglu, D., and D.H. Autor. 2010. Skills, Tasks and Technologies: Implications for Employment and Earnings. NBER Working Paper Series, no. 16082. Cambridge, Massachusetts: National Bureau of Economic Research.
Acemoglu, D., and P. Restrepo. 2018. Artificial Intelligence, Automation and Work. NBER Working Paper Series, no. 24196. Cambridge, Massachusetts: National Bureau of Economic Research.
Acemoglu, D., and P. Restrepo. 2019. “Automation and new tasks: How technology displaces and reinstates labor.” Journal of Economic Perspectives 33 (2): 3–30.
Arntz, M., T. Gregory, and U. Zierahn. 2016. The Risk of Automation for Jobs in OECD Countries: A Comparative Analysis. OECD Social, Employment and Migration Working Papers, no. 189. Paris: OECD Publishing.
Autor, D.H. 2013. “The ‘task approach’ to labor markets: An overview.” Journal for Labour Market Research 46: 185–199.
Autor, D.H. 2015. “Why are there still so many jobs? The history and future of workplace automation.” Journal of Economic Perspectives 29 (3): 3–30.
Autor, D.H., and M.J. Handel. 2013. “Putting tasks to the test: Human capital, job tasks and wages.” Journal of Labor Economics 31 (2): S59–S96.
Autor, D.G., F. Levy, and R.J. Murnane. 2003. “The skill content of recent technological change: An empirical exploration.” The Quarterly Journal of Economics 118 (4): 1279–1233.
Brandes, P., and R. Wattenhofer. 2016. “Opening the Frey/Osborne box: Which tasks of a job are susceptible to computerization?” arXiv: 1604.08823v2. Available at: https://arxiv.org/pdf/1604.08823.pdf (accessed August 19, 2019).
Cheung, C., J. Rossiter, and Y. Zheng. 2008. “Offshoring and its effects on the labour market and productivity: A survey of recent literature.” Bank of Canada Review Autumn: 15–28.
Frenette, M., and K. Frank. 2020. Automation and Job Transformation in Canada: Who’s at Risk? Analytical Studies Branch Research Paper Series, no. 448. Statistics Canada Catalogue no. 11F0019M. Ottawa: Statistics Canada.
Frey, C.B., and M.A. Osborne. 2013. The Future of Employment: How Susceptible Are Jobs to Computerization? Oxford University, Oxford Martin School, Programme on the Impacts of Future Technology.
Górka, S., W. Hardy, R. Keister, and P. Lewandowski. 2017. Tasks and Skills in European Labour Markets. Background paper for Growing United, IBS Research Report 03/2017. Warsaw: Institute for Structural Research.
Green, F. 2012. “Employee involvement, technology and evolution in job skills: A task-based analysis.” Industrial and Labor Relations Review 65 (1): 35–66.
Handel, M.J. 2016. “The O*NET content model: Strengths and limitations.” Journal for Labour Market Research 49: 157–176.
Hardy, W., R. Keister, and P. Lewandowski. 2015. Redefining vs. Reallocating. Task-driven Job Segmentation in Poland. IBS Working Paper no. 10. Warsaw: Institute for Structural Research.
Hardy, W., R. Keister, and P. Lewandowski. 2018. “Educational upgrading, structural change and the task composition of jobs in Europe.” The Economics of Transition 26 (2): 201–231.
International Federation of Robotics. 2016. World Robotics Report 2016. Available at: https://ifr.org/ifr-press-releases/news/world-robotics-report-2016 (accessed September 28, 2020).
Leduc, S., and Z. Liu. 2020. Can Pandemic-induced Job Uncertainty Stimulate Automation? Federal Reserve Bank of San Francisco Working Paper Series, no. 2020-19. Available at: https://doi.org/10.24148/wp2020-19 (accessed June 10, 2020).
Lee, G., B.B.M. Shao, and A. Vinze. 2018. “The role of ICT as a double-edged sword in fostering societal transformation.” Journal of the Association for Information Systems 19 (3): 209–246.
Levy, F., and R. Murnane. 2013. Dancing with Robots: Human Skills for Computerized Work. Washington, D.C.: Third Way NEXT.
Maestas, N., K.J. Mullen, and D. Powell. 2016. The Effect of Population Aging on Economic Growth, The Labor Force and Productivity. NBER Working Paper Series, no. 22452. Cambridge, Massachusetts: National Bureau of Economic Research.
Marcus, G. 2018. “Deep learning: A critical appraisal.” arXiv:1801.00631. Available at: https://arxiv.org/ftp/arxiv/papers/1801/1801.00631.pdf (accessed August 19, 2019).
Muro, M., R. Maxim, and J. Whiton. 2019. Automation and Artificial Intelligence: How Machines Are Affecting People and Places. Washington, D.C.: Brookings Institution Metropolitan Policy Program.
National Center for O*NET Development. n.d. “Browse by O*NET Data.” O*NET OnLine. Available at: https://www.onetonline.org/find/descriptor/browse (accessed August 8, 2019).
OECD (Organisation for Economic Co-operation and Development). 2016. Automation and Independent Work in a Digital Economy. Policy Brief on the Future of Work. Paris: OECD Publishing.
Oschinski, M., and R. Wyonch. 2017. Future Shock? The Impact of Automation on Canada’s Labour Market. C.D. Howe Commentary no. 472. Paris: OECD Publishing.
Peterson, N.G., M.D. Mumford, W.C. Borman, P.R. Jeanneret, E.A. Fleishman, K.Y. Levin, M.A. Campion, M.S. Mayfield, F.P. Morgensen, K. Pearlman, M.K. Gowing, A.R. Lancaster, M.B. Silver, and D.M. Dye. 2001. “Understanding work using the Occupational Information Network (O*NET): Implications for practice and research.” Personnel Psychology 54 (2): 451–492.
Power, D.J. 2000. “A history of microcomputer spreadsheets.” Communications of the Association for Information Systems 4 (9): 1–16.
Shestakofsky, B. 2017. “Working algorithms: Software automation and the future of work.” Work and Occupations 44 (4): 376–423.
Sorgner, A. 2017. “The automation of jobs: A threat for employment or a source of new entrepreneurial opportunities?” Foresight and STI Governance 11 (3): 37–48.
Spitz-Oener, A. 2006. “Technical change, job tasks, and rising educational demands: Looking outside the wage structure.” Journal of Labor Economics 24 (2): 235–270.
Statistics Canada. 2017a. Guide to the Labour Force Survey. Statistics Canada Catalogue no. 71-543-G. Ottawa: Statistics Canada.
Statistics Canada. 2017b. Variant of NOC 2011 – Highly Aggregated Data. Available at: http://www23.statcan.gc.ca/imdb/p3VD.pl?Function=getVD&TVD=136255.
Susskind, R., and D. Susskind. 2015. The Future of Professions: How Technology Will Transform the Work of Human Experts. New York: Oxford University Press.
- Date modified: