
Economic and Social Reports
Recent developments in the Canadian economy: Winter 2022
DOI: https://doi.org/10.25318/36280001202200300004-eng
Skip to text
Text begins
This article provides an integrated summary of recent changes in output, consumer prices and employment. It highlights changes in the economic data during the second half of 2021 and into early 2022. The article also draws on data sources that inform the economic conditions facing businesses as the COVID-19 pandemic continues to evolve. The report is based on data that are publicly available as of March 11, 2022.
Monthly information on government, business and financial market developments, including public health measures related to the pandemic, is available at Canadian Economic News (Statistics Canada n.d.). For a recent overview of social and economic developments during the pandemic, see COVID-19 in Canada: Year-end Update on Social and Economic Impacts (Statistics Canada 2021) and COVID-19 in Canada: A Two-year Update on Social and Economic Impacts (Statistics Canada 2022). Monthly commentary on economic developments related to COVID-19 can be found at Canadian Economic Dashboard and COVID-19 (Statistics Canada n.d.).
Overview
The economic recovery strengthened during the second half of 2021 as output rebounded to pre-COVID levels in the fourth quarter. Business stockpiling, higher export volumes, and increases in residential and non-residential investment contributed to stronger economic activity late in the year. Employment rose markedly during the second half while unemployment and labour underutilization trended down toward pre-pandemic levels. Labour shortages and rising input costs continue to cloud the business outlook. Headline consumer inflation accelerated in the second half, surpassing the five percent mark in early 2022 for the first time in over thirty years.
Authors
Sean Clarke and Guy Gellatly work with the Strategic Analysis, Publications and Training division, Analytical Studies and Modelling Branch, Statistics Canada.
Economic growth strengthens as exports and investment continue to recover
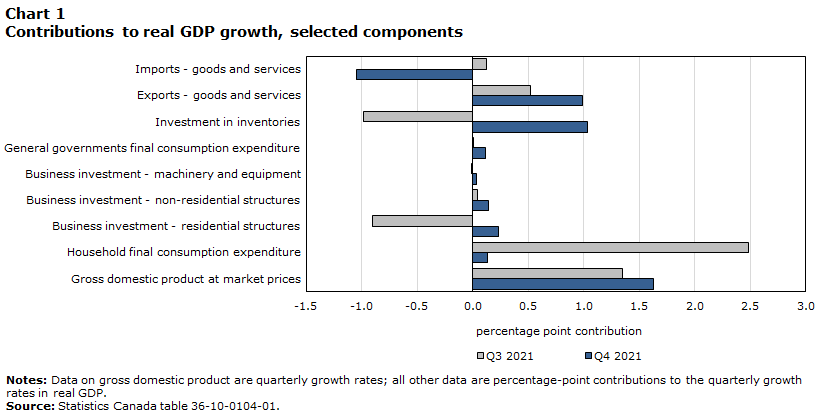
Real gross domestic product rose 1.6% in the fourth quarter, after advancing 1.3% in the third. Inventory buildups contributed substantially to growth in late 2021 as stockpiles rose in manufacturing and wholesaling (Chart 1).
Data table for Chart 1
| Q3 2021 | Q4 2021 | |
|---|---|---|
| percentage point contribution | ||
| Gross domestic product at market prices | 1.345 | 1.627 |
| Household final consumption expenditure | 2.485 | 0.134 |
| Business investment - residential structures | -0.907 | 0.229 |
| Business investment - non-residential structures | 0.042 | 0.140 |
| Business investment - machinery and equipment |
-0.008 | 0.035 |
| General governments final consumption expenditure | 0.004 | 0.116 |
| Investment in inventories | -0.986 | 1.031 |
| Exports - goods and services | 0.523 | 0.992 |
| Imports - goods and services | 0.123 | -1.048 |
|
Notes: Data on gross domestic product are quarterly growth rates; all other data are percentage-point contributions to the quarterly growth rates in real GDP. Source: Statistics Canada table 36-10-0104-01. |
||
Trade volumes ramped up in late 2021 as exports and imports posted their largest quarterly increases since the economy emerged from the initial lockdowns. Total exports rose 3.2% in the fourth quarter, up from 1.7% in the third. Goods exports rose 2.5%, led by higher shipments of motor vehicles and parts. While exports of passenger cars and light trucks strengthened late in the year, their volumes remained one-quarter below pre-pandemic levels as supply disruptions continue to weigh on automakers and parts suppliers. Higher shipments of consumer goods, metal ores and non-metallic minerals, and energy products also contributed to stronger headline exports in the fourth quarter.
Despite gains in five out of the last six quarters, goods exports remained 4% below pre-COVID levels. Service exports, bolstered by higher receipts for travel services as cross-border travel restrictions eased, rose steadily during the second half, but remained 12% below their pre-pandemic baseline.
After edging down in third quarter, total import volumes were up 3.4% in the fourth, led by increases in motor vehicles and parts. Higher imports of consumer products, metal ores, and communications equipment also supported the increase in headline imports.
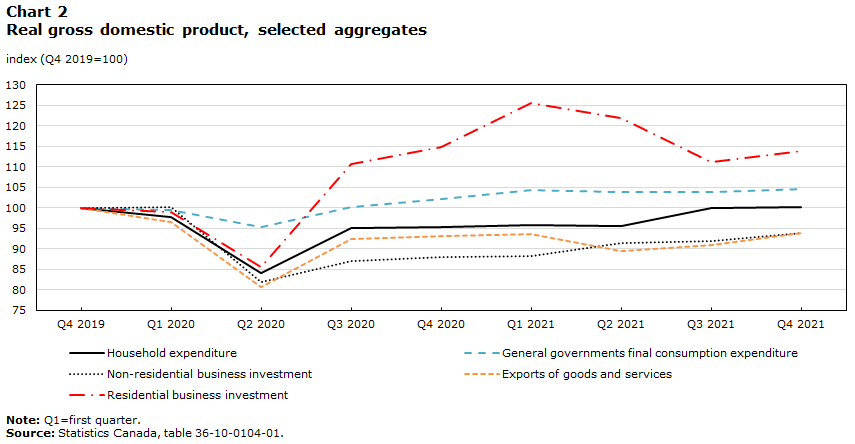
Non-residential business investment continues to recover. Combined outlays on structures and machinery and equipment (M&E) have risen for six consecutive quarters, and, in late 2021, were 6% below pre-pandemic levels (Chart 2). Outlays on non-residential structures rose 2.7% in the fourth quarter, but remain 10% below levels observed in late 2019. Business investment in M&E, supported by higher spending on communications equipment, also rose late in the year, recovering to pre-COVID levels. Spending on intellectual property products fell for the second consecutive quarter.
After scaling back for two quarters, investment in housing ramped up late in the year, led by a double-digit increase in ownership transfer costs as resale activity strengthened. Renovation activity also edged higher after a sharp decline in the third quarter. Total business outlays on housing in late 2021 were 14% above pre-COVID levels.
Data table for Chart 2
| Household expenditure | General governments final consumption expenditure | Non-residential business investment | Exports of goods and services | Residential business investment | |
|---|---|---|---|---|---|
| 2019 | |||||
| Q4 | 100.0 | 100.0 | 100.0 | 100.0 | 100.0 |
| 2020 | |||||
| Q1 | 97.8 | 99.5 | 100.2 | 96.7 | 98.9 |
| Q2 | 84.2 | 95.3 | 81.9 | 80.8 | 85.5 |
| Q3 | 95.0 | 100.3 | 87.1 | 92.3 | 110.6 |
| Q4 | 95.3 | 102.1 | 88.1 | 93.1 | 114.8 |
| 2021 | |||||
| Q1 | 95.7 | 104.2 | 88.3 | 93.6 | 125.6 |
| Q2 | 95.5 | 103.9 | 91.5 | 89.4 | 122.0 |
| Q3 | 100.0 | 103.9 | 91.9 | 91.0 | 111.2 |
| Q4 | 100.2 | 104.5 | 93.8 | 93.9 | 113.9 |
|
Note: Q1=first quarter. Source: Statistics Canada, table 36-10-0104-01. |
|||||
After rising sharply in the third quarter as COVID-19 restrictions eased, household spending moderated in the fourth, edging up 0.2% as higher outlays on services offset lower spending on goods. Canadians increased their spending abroad while outlays on food services declined as restrictions in response to the Omicron variant were introduced late in the year. Total household spending, supported by higher outlays on goods over the course of the pandemic, has rebounded to its pre-COVID baseline.
Nominal GDP rose 3.3% in the fourth quarter, up from 2.5% in the third. Canada’s terms of trade improved late in the year, largely reflecting higher export prices for crude oil. Real gross domestic income, which accounts for changes in the terms of trade and measures the purchasing power of domestic production, rose 2.0% in the fourth quarter, and has outpaced real GDP growth in five of the last six quarters.
For 2021 as a whole, real GDP in Canada rose 4.6% after contracting by 5.2% in 2020. Real GDP in the United States grew 5.7% in 2021, following a 3.4% decline in 2020.
Economy-wide output rebounds to pre-COVID levels
Economic output rose steadily from June to November, recovering to pre-COVID levels nineteen months after the initial lockdowns in March and April 2020. Output was essentially unchanged in December as tighter restrictions related to Omicron weighed on activity at client-facing businesses. Overall, output growth in the fourth quarter was broad based, with 18 of 20 major industrial sectors posting gains.
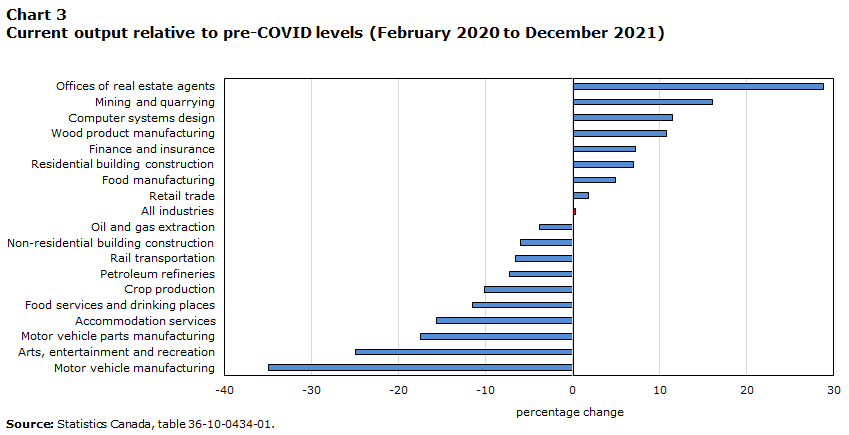
Factory output rallied late in the year, buoyed by higher production at automakers and parts suppliers. Monthly output at assembly plants rose steadily after September as production disruptions eased, but remained almost about one-third below pre-pandemic levels at year end (Chart 3). Total factory output in December was 1.5% below levels observed in February 2020.
Data table for Chart 3
| Percentage change | |
|---|---|
| Motor vehicle manufacturing | -35.0 |
| Arts, entertainment and recreation | -25.0 |
| Motor vehicle parts manufacturing | -17.5 |
| Accommodation services | -15.7 |
| Food services and drinking places | -11.5 |
| Crop production | -10.2 |
| Petroleum refineries | -7.3 |
| Rail transportation | -6.6 |
| Non-residential building construction | -6.0 |
| Oil and gas extraction | -3.8 |
| All industries | 0.4 |
| Retail trade | 1.8 |
| Food manufacturing | 5.0 |
| Residential building construction | 6.9 |
| Finance and insurance | 7.2 |
| Wood product manufacturing | 10.8 |
| Computer systems design | 11.5 |
| Mining and quarrying | 16.0 |
| Offices of real estate agents | 28.8 |
| Source: Statistics Canada, table 36-10-0434-01 | |
While wholesale activity rose steadily from August to December, retail volumes moderated late in the year, with lower activity at brick and mortar stores at year end. Sales at clothing stores and furniture stores were heavily impacted by Omicron-related restrictions, as they were earlier in the pandemic when public health measures tightened in response to the Beta and Gamma variants.
Homebuilding scaled back substantially after surging early in the year. After peaking in April, residential building construction posted six declines over the next eight months, ending the year 7% above pre-COVID levels (activity at April’s peak was one quarter above its pre-pandemic baseline).
While activity at real estate agents and brokers also scaled back after housing markets surged in the spring, activity ramped up in October as resale activity strengthened. With two modest declines to end the year, activity at agents and brokers remained almost 30% above pre-pandemic levels.
Rail transportation declined late in the year after flooding in British Columbia impacted carloadings in western Canada. While air transportation continued to recover steadily as domestic and international travel picked up, volumes remain severely impacted by cross-border travel restrictions. Despite nine consecutive monthly increases, output in the air transportation industry at year end was over one-half below levels observed in February 2020. Accommodation services has risen for seven consecutive months, but remained 16% below pre-pandemic levels.
Activity at restaurants and bars moderated during the fall after surging in the late spring and summer months. From June to August, volumes at these establishments ramped up rapidly as households shifted to out-of-the-home expenditures following lockdowns in the spring.Note Output at food services and drinking places then fell in September and October as restrictions tightened in response to the Delta variant, and then again at year end as Omicron-related measures came into effect. At year end, activity levels at these establishments were 12% below their pre-COVID baseline.
Output in the arts, entertainment and recreation sector remained about 25% below its pre-pandemic level at year end, despite gains in six of the last seven months.
Increases in resource extraction supported output growth during the second half of 2021. Mining, quarrying and oil and gas extraction rose steadily from May to October, before back-to-back declines to end the year. Output at year end was essential unchanged from pre-pandemic levels.
Businesses continue to strengthen their capital plans
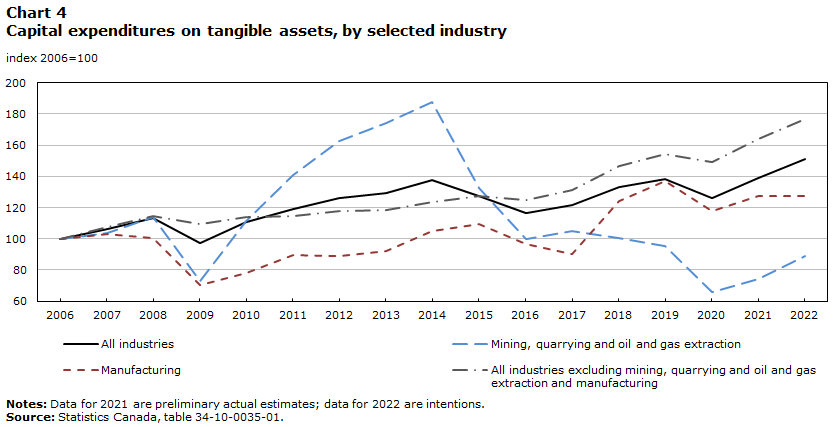
Private sector organizations expect to spend almost 8% more on tangible assets in 2022 as planned capital outlays rebounded to pre-COVID levels. Higher anticipated spending on structures accounts for two thirds of the planned increase in private spending. Capital intentions among public sector organizations are up almost 10% in 2022, and are currently one-quarter above their pre-pandemic baseline.
While public outlays have risen sharply in recent years, private sector spending on structures and M&E has trended lower since oil prices fell sharply in the mid-2010s. Private intentions in 2022 remain nearly 10% below peak levels observed in 2014, when the growth in capital spending was largely driven by higher outlays in Alberta.
Data table for Chart 4
| All industries | Mining, quarrying and oil and gas extraction | Manufacturing | All industries excluding mining, quarrying and oil and gas extraction and manufacturing |
|
|---|---|---|---|---|
| index 2006=100 | ||||
| 2006 | 100.0 | 100.0 | 100.0 | 100.0 |
| 2007 | 106.3 | 103.9 | 103.2 | 107.5 |
| 2008 | 113.1 | 114.1 | 100.6 | 114.4 |
| 2009 | 97.4 | 73.1 | 70.3 | 109.7 |
| 2010 | 110.5 | 111.5 | 78.3 | 114.2 |
| 2011 | 119.0 | 140.8 | 89.7 | 114.9 |
| 2012 | 126.2 | 162.7 | 88.9 | 117.7 |
| 2013 | 129.6 | 174.3 | 92.4 | 118.2 |
| 2014 | 137.7 | 187.9 | 105.0 | 123.7 |
| 2015 | 127.2 | 132.6 | 109.4 | 127.6 |
| 2016 | 116.4 | 100.2 | 96.5 | 124.9 |
| 2017 | 121.4 | 105.1 | 89.9 | 131.5 |
| 2018 | 133.3 | 100.6 | 124.2 | 146.4 |
| 2019 | 138.6 | 95.4 | 137.3 | 154.4 |
| 2020 | 126.0 | 66.1 | 117.5 | 148.9 |
| 2021 | 139.0 | 74.0 | 127.5 | 164.2 |
| 2022 | 151.0 | 89.3 | 127.4 | 176.4 |
|
Notes: Data for 2021 are preliminary actual estimates; data for 2022 are intentions. Source: Statistics Canada, table 34-10-0035-01. |
||||
Despite strong upward pressure on oil and commodity prices, planned 2022 capital spending in mining, quarrying and oil and gas extraction remain below levels observed before the pandemic. At $43 billion, mining, oil and gas intentions are up about 20% from 2021 levels, but still 6% below levels in 2019, and over 50% below peak levels reported in 2014. Capital intentions among manufacturers in 2022 are little changed from 2021 spending levels, with lower planned spending on structures offsetting higher outlays on machinery and equipment. Total 2022 intentions in manufacturing remain 7% below their 2019 pre-pandemic baseline.
Rising input costs and labour shortages cloud the outlook
The most recent data from the Canadian Survey on Business Conditions suggest that obstacles related to input costs and workforce recruitment and retention are becoming more widespread. One half of businesses in the first quarter of 2022 expect rising costs related to labour, capital, energy or materials to be an obstacle in the coming months, up from 43% in late 2021. This includes almost three quarters of manufacturers and two thirds of businesses in accommodation and food services. In addition, over one third of businesses anticipate obstacles related to transportation and insurance costs.

Data table for Chart 5
| Q3 2021 | Q4 2021 | Q1 2022 | |
|---|---|---|---|
| percentage of businesses identifying as an obstacle | |||
| Rising cost of inputs | 38.5 | 42.5 | 50.3 |
| Recruiting skilled employees | 34.6 | 35.4 | 38.5 |
| Shortage of labour force | 30.3 | 32.7 | 37.0 |
| Cost of insurance | 25.3 | 31.9 | 35.6 |
| Retaining skilled employees | 24.5 | 26.1 | 30.4 |
| Transportation costs | 22.8 | 30.9 | 34.6 |
| Fluctuations in consumer demand | 22.6 | 21.2 | 23.6 |
| Source: Survey on Business Conditions, second and third quarters, 2021. See Statistics Canada tables 33-10-0364-01, 33-10-0400-01, and 33-10-0469-01. | |||
Similarly, 37% of businesses in the first quarter expect labour shortages to be an obstacle over the next three months, compared with 33% in late 2021. This includes almost one half of businesses in manufacturing and construction, and nearly two thirds of those in accommodation and food services.Note Nearly four in ten businesses anticipate challenges recruiting skilled employees.
Many businesses are adjusting their wage plans. Over four in ten expect to raise wages for existing employees over the next year, including over 60% of businesses in accommodation and food services.
Headline consumer inflation at a thirty year high
Headline consumer inflation accelerated during the second half of 2021, surpassing the five percent mark in January 2022 for the first time in over three decades. January marked the tenth consecutive month that the headline rate has been above three percent, and its sixth consecutive month above four percent. During this period, higher prices for gasoline, shelter, consumer durables and food have all put upward pressure on headline inflation, as supply disruptions coupled with strong demand have continued to fuel price growth.Note
Higher gasoline prices continue to impact the pace of consumer inflation. Prices at the pump, measured year-over-year, were up 31.7% in January, the eleventh straight month of annual increases above the 30 percent mark.Note Excluding gasoline, consumer prices rose 4.3% in January, the largest yearly increase since this index became available in the late 1990s. Higher prices for food and shelter have contributed to this acceleration, with annual increases for both outpacing the headline rate.
Food prices have risen steadily in recent months, and were up 5.7% on a year-over-year basis in January. Grocery prices, up 6.5%, posted their largest yearly increase since 2009. Annual price increases for beef remained in double-digit territory for the fifth consecutive month, while those for fresh fruit rose above 8% to start the year.
Higher housing-related costs continue to bolster headline inflation. Prices for owned accommodation rose 6.1% in the twelve months to January, as annual increases in the homeowners’ replacement cost index, which partly reflect prices for new homes, remained in double-digit territory for the ninth consecutive month. Annual prices increases for rented accommodation rose above the three percent mark in January for the first time since late 2019.
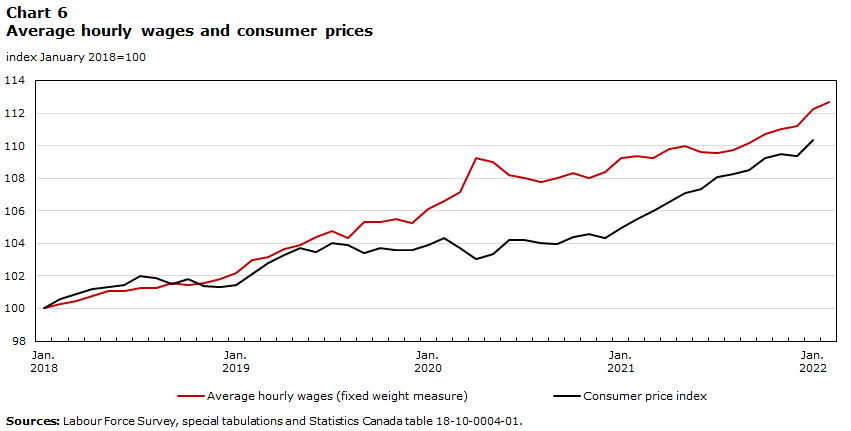
Consumer inflation has outpaced average wage growth since early 2021. In January, average hourly wages, adjusted for changes in the composition of employment due to the pandemic, were up 2.7% on a year-over-year basis. Without adjustment, average wages rose 2.4%, less than half the pace of headline inflation.Note Both measures of annual wage growth rose at a faster pace in February.
Data table for Chart 6
| Average hourly wages (fixed weight measure) | Consumer price index | |
|---|---|---|
| index January 2018=100 | ||
| 2018 | ||
| M1 | 100.00 | 100.00 |
| M2 | 100.26 | 100.61 |
| M3 | 100.49 | 100.91 |
| M4 | 100.79 | 101.21 |
| M5 | 101.05 | 101.29 |
| M6 | 101.09 | 101.44 |
| M7 | 101.28 | 101.97 |
| M8 | 101.24 | 101.90 |
| M9 | 101.54 | 101.52 |
| M10 | 101.46 | 101.82 |
| M11 | 101.54 | 101.37 |
| M12 | 101.84 | 101.29 |
| 2019 | ||
| M1 | 102.18 | 101.44 |
| M2 | 102.97 | 102.13 |
| M3 | 103.19 | 102.81 |
| M4 | 103.68 | 103.26 |
| M5 | 103.90 | 103.72 |
| M6 | 104.39 | 103.49 |
| M7 | 104.73 | 104.02 |
| M8 | 104.32 | 103.87 |
| M9 | 105.29 | 103.42 |
| M10 | 105.33 | 103.72 |
| M11 | 105.52 | 103.57 |
| M12 | 105.26 | 103.57 |
| 2020 | ||
| M1 | 106.08 | 103.87 |
| M2 | 106.57 | 104.33 |
| M3 | 107.13 | 103.72 |
| M4 | 109.23 | 103.04 |
| M5 | 108.97 | 103.34 |
| M6 | 108.18 | 104.18 |
| M7 | 108.03 | 104.18 |
| M8 | 107.77 | 104.02 |
| M9 | 108.03 | 103.95 |
| M10 | 108.30 | 104.40 |
| M11 | 108.00 | 104.56 |
| M12 | 108.41 | 104.33 |
| 2021 | ||
| M1 | 109.23 | 104.94 |
| M2 | 109.35 | 105.47 |
| M3 | 109.23 | 106.00 |
| M4 | 109.80 | 106.53 |
| M5 | 109.95 | 107.06 |
| M6 | 109.61 | 107.37 |
| M7 | 109.57 | 108.05 |
| M8 | 109.72 | 108.28 |
| M9 | 110.17 | 108.50 |
| M10 | 110.70 | 109.26 |
| M11 | 111.00 | 109.49 |
| M12 | 111.22 | 109.34 |
| 2022 | ||
| M1 | 112.24 | 110.33 |
| M2 | 112.65 | Note ...: not applicable |
|
... not applicable Sources: Labour Force Survey, special tabulations and Statistics Canada table 18-10-0004-01. |
||
Strong employment growth as economic activity ramps up
Employment rose markedly during the second half of 2021 as unemployment and labour underutilization trended back toward pre-pandemic levels. Net employment gains from May to December totaled nearly 800,000 as economic activity ramped up in the wake of tighter restrictions related to the Gamma variant in the spring. Total employment rebounded to its pre-COVID baseline in September, and then rose by an additional quarter of a million in the fourth quarter.
Employment among core-age workers and youth rose substantially during the second half of 2021. At year end, the employment rate among core-age workers was 84.2%, one percentage point above its pre-pandemic baseline, reflecting strong cumulative job gains among both core-age men and core-age women (Chart 7). Employment rates among young men and women also fully recovered to pre-pandemic levels.
Sharp differences in the pace of the employment recovery continued to persist across major industrial sectors. At the end of 2021, cumulative employment losses in accommodation and food services remained over 200,000, while employment in retail trade had recovered to its pre-pandemic level, bolstered by gains during the fall. In contrast, employment in professional, scientific and technical services at year end was over 180,000 above levels reported in February 2020.

Data table for Chart 7
| Men | Women | |
|---|---|---|
| percent | ||
| 2020 | ||
| January | 86.5 | 79.8 |
| February | 86.7 | 79.7 |
| March | 84.8 | 75.6 |
| April | 76.1 | 69.2 |
| May | 77.4 | 70.1 |
| June | 81.6 | 73.7 |
| July | 82.6 | 75.0 |
| August | 83.3 | 75.8 |
| September | 84.2 | 77.7 |
| October | 84.5 | 78.2 |
| November | 84.7 | 78.2 |
| December | 84.6 | 78.1 |
| 2021 | ||
| January | 84.2 | 77.1 |
| February | 84.9 | 78.2 |
| March | 85.5 | 78.4 |
| April | 85.3 | 78.0 |
| May | 85.3 | 77.8 |
| June | 85.3 | 78.5 |
| July | 85.3 | 78.7 |
| August | 85.5 | 78.7 |
| September | 86.2 | 79.9 |
| October | 86.6 | 79.9 |
| November | 87.1 | 80.7 |
| December | 87.8 | 80.7 |
| 2022 | ||
| January | 87.5 | 80.0 |
| February | 88.2 | 81.0 |
| Source: Statistics Canada, table 14-10-0287-10. | ||
Employment rebounds as Omicron-related restrictions ease
Total employment fell by 200,000 in January as tighter restrictions in response to the Omicron variant impacted client-facing sectors. Lower employment among youth accounted for over two thirds of the headline decrease, while losses in accommodation and food services totaled 113,000. The unemployment rate increased to 6.5% due to a sharp rise in temporary layoffs, while workplace absences due to illness or disability rose to record levels
Omicron’s impact on the labour market was short-lived. Employment surged in February, more than offsetting January’s headline decrease. Total employment rose by 337,000, led by gains among core-age workers and youth. Gains in accommodation and food services fully offset steep losses in January, while employment in information, culture and recreation services rose above pre-COVID level for the first time. Professional, scientific and technical services and construction also posted notable gains.
The unemployment rate fell to 5.5% in February, edging below its pre-pandemic baseline, while the rate among core-age workers declined to 4.4%. The employment rate among core-age men rose to a 40-year high and was at record levels among core-age women.
Workplace absences declined sharply in February, while total hours worked surpassed its pre-pandemic baseline, also reaching a record high.
References
Statistics Canada. n.d. Canadian Economic News. Last updated March 10, 2022. Available at: https://www.statcan.gc.ca/eng/dai/btd/cen/index#census (accessed March 10, 2022).
Statistics Canada. n.d. Canadian Economic Dashboard and COVID-19. Last updated March 10, 2022. Available at: https://www150.statcan.gc.ca/n1/pub/71-607-x/71-607-x2020009-eng.htm?HPA=1 (accessed March 10, 2022).
Statistics Canada. 2021. COVID-19 in Canada: Year-end Update on Social and Economic Impacts. Catalogue no. 11-631-X, December 22. Ottawa: Statistics Canada. Available at: https://www150.statcan.gc.ca/n1/pub/11-631-x/11-631-x2021003-eng.htm (accessed December 22, 2021).
Statistics Canada. 2022. COVID-19 in Canada: A Two-year Update on Social and Economic Impacts. Catalogue no. 11-631-X, March 11. Ottawa: Statistics Canada. Available at: https://www150.statcan.gc.ca/n1/en/catalogue/11-631-X2022001 (accessed on March 10, 2022)
- Date modified: