
Economic and Social Reports
The oil and gas sector in Canada: A year after the start of the pandemic
DOI: https://doi.org/10.25318/36280001202100700003-eng
Skip to text
Text begins
Abstract
This article provides an update on the performance of Canada’s oil and gas extraction industry after it was hit by the oil price crisis that occurred in March and April 2020. The Canadian oil and gas extraction industry was found to have almost recovered in terms of production, employment and exports after experiencing sharp declines in economic activity as oil prices plummeted early in the COVID-19 pandemic. In April 2021, the industry’s gross domestic product, employment and exports reached 95.4%, 95.7% and 102.5% of their corresponding levels from January 2020, respectively. However, capital expenditures in the industry have been declining since 2014. Capital outlays fell by 55% from 2014 to 2019 and then by another 36% in 2020. Looking ahead, Canada’s oil and gas extraction industry still faces some challenges despite the recovery of oil prices, such as uncertain near-term energy demand because of the potential for new waves of the pandemic, the cancellation of Keystone XL, carbon pricing and increasing demand for clean energy, which may prevent capital spending in the industry from rebounding.
Author
Weimin Wang is with the Economic Analysis Division, Analytical Studies and Modelling Branch at Statistics Canada.
Introduction
The year 2020 was challenging for oil and gas producers all over the world. The crisis in the oil and gas industry started in early March 2020 as a result of the price war between Saudi Arabia and Russia after they failed to reach an agreement on oil supply control. The West Texas Intermediate (WTI), a benchmark crude oil price, immediately fell by around 30%, turning the event into an existential crisis for many oil companies.Note At the same time, the travel and mobility restrictions during the COVID-19 pandemic led to a sharp decline in oil demand.Note A few weeks later, after the collapse, fears among oil traders of a lack of storage capacity led to a deeply negative oil price in April.
Oil and gas extraction is an important contributor to the Canadian economy, especially in Alberta and Newfoundland and Labrador. From the year 2000 onwards, its gross domestic product (GDP) share in the total economy averaged about 5% for Canada, 21% for Alberta, and 25% for Newfoundland and Labrador. The industry was severely hit by the oil price crisis. Many oil and gas companies in Canada substantially scaled back their production and investment plans in response to the crisis.Note One year has passed since the crisis. Oil prices have risen to pre-crisis levels, and the recovering global economy may support a slight rebound in global oil demand.Note This article examines the extent to which the industry has recovered from the crisis and the challenges facing the industry both currently and in the future.
This article finds that the Canadian oil and gas extraction industry has almost recovered from the impact of the oil price crisis and the COVID-19 pandemic in terms of production, employment and export. By April 2021, the industry had reached 95.4% of the GDP level from one year before, as well as 95.7% of the employment and 102.5% of export levels. However, capital expenditures in the industry have been declining since 2014. They fell by 55% over the 2014-to-2019 period and then by a further 36% in 2020. Looking ahead, Canada’s oil and gas extraction industry still faces some challenges despite the recovery of oil prices, such as weak near-term energy demand, the cancellation of Keystone XL, carbon pricing and strong growth of clean energy, which may prevent production and capital spending in the industry from rebounding. Crude oil production and exports started to fall again in February 2021, and their future trends remain to be seen.
Crude oil price
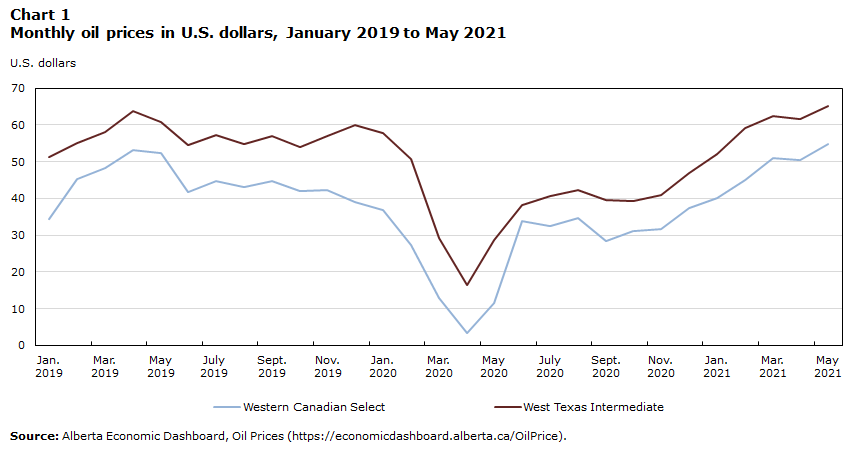
The price of crude oil is the most important factor that drives production and investment in the oil and gas extraction sector. Chart 1 presents movements in two of the most relevant crude oil prices for Canada, the WTI and the Western Canadian Select (WCS)Note from January 2019 to February 2021. As shown, both oil prices declined sharply from January to April 2020 and then recovered quickly in next two months. By February 2021, both the WTI and the WCS had fully recovered to their pre-crisis levels.
The oil price comeback reflected enthusiasm for record-setting production cuts by the Organization of the Petroleum Exporting Countries (OPEC), Russia and their allies. After the oil crisis, OPEC+Note agreed to the following production cuts: a 9.7 million barrels per day production cut in May and June 2020 (2 months), a 7.7 million barrels per day production cut from July to December 2020 (6 months), and a 5.8 million barrels per day production cut from January 2020 to April 2022 (16 months).Note
The recovery of crude oil prices may suggest that the global oil supply has been well managed in response to the decreased oil demand during the pandemic. It does not necessarily imply that the challenges faced in the Canadian oil and gas extraction industry have ended. To understand to what extent the industry has recovered from the disruptions caused by the oil price crisis, production, employment, exports and investment in the industry need to be closely examined.
Data table for Chart 1
| Western Canadian Select | West Texas Intermediate | |
|---|---|---|
| U.S. dollars | ||
| Jan. 2019 | 34.30 | 51.38 |
| Feb. 2019 | 45.33 | 54.95 |
| Mar. 2019 | 48.21 | 58.15 |
| Apr. 2019 | 53.25 | 63.86 |
| May 2019 | 52.44 | 60.83 |
| June 2019 | 41.74 | 54.66 |
| July 2019 | 44.70 | 57.35 |
| Aug. 2019 | 43.10 | 54.81 |
| Sept. 2019 | 44.84 | 56.95 |
| Oct. 2019 | 41.96 | 53.96 |
| Nov. 2019 | 42.32 | 57.03 |
| Dec. 2019 | 39.11 | 59.88 |
| Jan. 2020 | 36.82 | 57.68 |
| Feb. 2020 | 27.28 | 50.62 |
| Mar. 2020 | 12.84 | 29.21 |
| Apr. 2020 | 3.50 | 16.55 |
| May 2020 | 11.67 | 28.56 |
| June 2020 | 33.97 | 38.31 |
| July 2020 | 32.50 | 40.71 |
| Aug. 2020 | 34.60 | 42.34 |
| Sept. 2020 | 28.43 | 39.63 |
| Oct. 2020 | 31.17 | 39.40 |
| Nov. 2020 | 31.57 | 40.94 |
| Dec. 2020 | 37.32 | 47.02 |
| Jan. 2021 | 40.04 | 52.00 |
| Feb. 2021 | 45.13 | 59.04 |
| Mar. 2021 | 50.94 | 62.33 |
| Apr. 2021 | 50.51 | 61.72 |
| May 2021 | 54.78 | 65.17 |
| Source: Alberta Economic Dashboard, Oil Prices (https://economicdashboard.alberta.ca/OilPrice). | ||
Production and employment
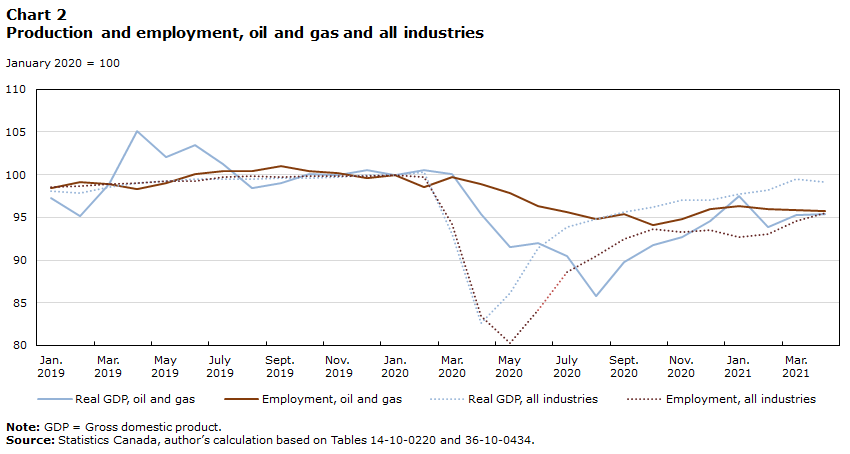
Chart 2 presents monthly production and employmentNote in the oil and gas extraction industry and in all industries as a whole from January 2019 to April 2021. As is shown, both real GDP and employment in the oil and gas extraction industry started to decline when the oil price shock occurred in March 2020. Real GDP in the industry dropped by about 15% from January to August 2020 and has been recovering since then. In April 2021, it reached 95.4% of the level from January 2020. Employment in the oil and gas extraction industry was much less volatile. It dropped by 6% from January to October 2020, and has recovered slowly since then.
The movements of real GDP and employment were quite different in all industries as a whole. Both real GDP and employment in all industries declined substantially in the early months of the pandemic and rebounded strongly in the following two months. By April 2021, real GDP had reached 99.1% and employment had reached 95.5% from January 2020.
A couple of points are noteworthy. First, unlike the quick production and employment adjustments in all industries in response to the pandemic, reactions in the oil and gas extraction industry to the oil price crisis were relatively slow and moderate.Note The real GDP decline in the oil and gas extraction industry lasted six months, compared with the two-month duration of the real GDP decline in all other industries as a whole. For employment, the decline lasted eight months in the oil and gas extraction industries and three months in all industries as a whole. Second, the adjustment in employment was much smaller than that in real GDP for the oil and gas extraction industry; however, for all industries as a whole, the adjustment in employment was greater than that in real GDP. Specifically, in the year 2020, employment in the oil and gas extraction industry dropped by 6% in the eight months from March to October and then recovered by 1.6 percentage points in the next six months, while employment in all industries as a whole dropped by 20% in the four months from February to May and then recovered by 15.3 percentage points since then.
Data table for Chart 2
| Real GDP, oil and gas | Employment, oil and gas | Real GDP, all industries | Employment, all industries | |
|---|---|---|---|---|
| January 2020 = 100 | ||||
| Jan. 2019 | 97.2540 | 98.4225 | 98.1208 | 98.5453 |
| Feb. 2019 | 95.1611 | 99.1524 | 97.9070 | 98.6872 |
| Mar. 2019 | 98.9347 | 98.8829 | 98.5582 | 98.9041 |
| Apr. 2019 | 105.0949 | 98.3708 | 98.9746 | 99.0085 |
| May 2019 | 102.0220 | 99.0649 | 99.2675 | 99.2080 |
| June 2019 | 103.4241 | 100.0946 | 99.4888 | 99.2180 |
| July 2019 | 101.2989 | 100.4782 | 99.5058 | 99.7085 |
| Aug. 2019 | 98.4676 | 100.4301 | 99.4618 | 99.7988 |
| Sept. 2019 | 99.0110 | 100.9850 | 99.5702 | 99.7274 |
| Oct. 2019 | 100.0826 | 100.3962 | 99.6470 | 99.8488 |
| Nov. 2019 | 99.9219 | 100.1945 | 99.6860 | 99.8165 |
| Dec. 2019 | 100.4913 | 99.5557 | 99.9431 | 99.8554 |
| Jan. 2020 | 100.00 | 100.00 | 100.00 | 100.00 |
| Feb. 2020 | 100.5884 | 98.5278 | 100.2873 | 99.7432 |
| Mar. 2020 | 100.0593 | 99.7252 | 93.0496 | 94.2404 |
| Apr. 2020 | 95.3902 | 98.8704 | 82.6081 | 83.4140 |
| May 2020 | 91.5537 | 97.8961 | 86.1643 | 80.2800 |
| June 2020 | 91.9723 | 96.3811 | 91.4136 | 84.1069 |
| July 2020 | 90.4803 | 95.6619 | 93.8535 | 88.5658 |
| Aug. 2020 | 85.7618 | 94.8482 | 94.8385 | 90.4729 |
| Sept. 2020 | 89.7949 | 95.3390 | 95.5926 | 92.5105 |
| Oct. 2020 | 91.7352 | 94.1380 | 96.2524 | 93.6477 |
| Nov. 2020 | 92.7466 | 94.8304 | 96.9986 | 93.2292 |
| Dec. 2020 | 94.5898 | 95.9225 | 97.0772 | 93.5102 |
| Jan. 2021 | 97.4579 | 96.3008 | 97.7650 | 92.7155 |
| Feb. 2021 | 93.8389 | 95.9600 | 98.1497 | 93.0491 |
| Mar. 2021 | 95.2348 | 95.9064 | 99.4546 | 94.5482 |
| Apr. 2021 | 95.4279 | 95.7333 | 99.1222 | 95.5253 |
|
Note: GDP = Gross domestic product. Source: Statistics Canada, author’s calculation based on Tables 14-10-0220 and 36-10-0434. |
||||
Slower adjustments to price and demand changes in the oil and gas extraction industry relate to the nature of the industry. When demand plummets and prices drop, oil companies prefer to keep pumping at a loss for a certain period because market conditions may change quickly, and getting an oil well running again after shutting it down is very costly and requires a large amount of reinvestment. Also, pandemic-related lockdowns and physical distancing restrictions affected certain industries more than others, such as transportation and personal services, leading to larger adjustments in all industries as a whole than in the oil and gas extraction industry alone.
Crude oil and merchandise exports
The global value chain and, therefore, merchandise exports have been greatly affected by the pandemic because of declining demand. Chart 3 shows movements in crude oil exports and all merchandise exports before and during the pandemic. As shown in the chart, crude oil exports and all merchandise exports had similar patterns over time during the pandemic; however, the drop in crude oil exports was much greater than the drop in all merchandise exports in the early months of the pandemic.Note Crude oil exports started to decline before the oil price crisis. Their value dropped by more than 20% from December 2019 to February 2020 and by 70% from February to April 2020. The value then largely recovered over the next three months. About 50% of the loss from December 2019 to April 2020 was recovered over the period of April to July 2020. By May 2021, crude oil exports were 3.5% higher than their level from January 2020. By comparison, all merchandise exports dropped by 34% from February to April 2020, and the loss was almost fully recovered in the following three months. By May 2021, all merchandise exports were 5.3% higher than their level from January 2020.

Data table for Chart 3
| All merchandise | Crude oil | |
|---|---|---|
| January 2020 = 100 | ||
| Jan. 2019 | 103.2104 | 87.4420 |
| Feb. 2019 | 103.3337 | 107.4867 |
| Mar. 2019 | 108.4312 | 124.4445 |
| Apr. 2019 | 108.6140 | 127.6531 |
| May 2019 | 111.6744 | 115.8649 |
| June 2019 | 105.4773 | 104.5029 |
| July 2019 | 105.9426 | 110.7140 |
| Aug. 2019 | 106.6823 | 106.2860 |
| Sept. 2019 | 104.9636 | 108.9840 |
| Oct. 2019 | 103.8974 | 104.0002 |
| Nov. 2019 | 104.3179 | 105.5069 |
| Dec. 2019 | 104.8922 | 113.3870 |
| Jan. 2020 | 100.00 | 100.00 |
| Feb. 2020 | 101.6290 | 91.8232 |
| Mar. 2020 | 93.9587 | 51.2499 |
| Apr. 2020 | 67.2103 | 18.3272 |
| May 2020 | 72.2800 | 25.0316 |
| June 2020 | 87.9353 | 61.3471 |
| July 2020 | 97.6508 | 72.1392 |
| Aug. 2020 | 95.9310 | 72.5420 |
| Sept. 2020 | 97.4072 | 66.3169 |
| Oct. 2020 | 98.6979 | 69.8284 |
| Nov. 2020 | 99.7003 | 76.3845 |
| Dec. 2020 | 101.0477 | 84.2272 |
| Jan. 2021 | 109.0729 | 93.4735 |
| Feb. 2021 | 106.5880 | 103.4974 |
| Mar. 2021 | 107.4356 | 105.2321 |
| Apr. 2021 | 106.9865 | 102.5419 |
| May 2021 | 105.2788 | 103.5411 |
| Source: Statistics Canada, author’s calculation based on Table 12-10-0121. | ||
Capital expenditures
Capital expenditures in oil and gas extraction are highly related to crude oil price. Lower oil prices will drive down the profit level of oil and gas extraction and ultimately discourage investment in the industry, and this will affect its production capacity in the long term. Also, oil companies will quickly reduce their planned capital spending to lower their average variable production costs. This can help them survive longer in the regime of decreasing crude oil prices.
Chart 4 shows nominal capital expenditures in the oil and gas extraction industry from 2012 to 2021.Note As shown, capital expenditures in the industry have been declining since 2014. From 2014 to 2019, capital expenditures in oil and gas extraction declined by 55%, while capital expenditures in all industries were unchanged. This deteriorating investment situation worsened in 2020. Capital expenditures dropped by 36% in the oil and gas extraction industry in 2020 alone, triggered by the oil price shock in March and April of the same year. At the same time, capital expenditures dropped by about 9% in all industries.

Data table for Chart 4
| 2012 | 2013 | 2014 | 2015 | 2016 | 2017 | 2018 | 2019 | 2020 | 2021 | |
|---|---|---|---|---|---|---|---|---|---|---|
| 2019 = 100 | ||||||||||
| Oil and gas | 173.2885 | 191.8429 | 224.2616 | 150.5439 | 110.8623 | 118.6553 | 109.2337 | 100.00 | 64.0206 | 65.2823 |
| All industries | 91.0326 | 93.5226 | 99.3911 | 91.8041 | 83.9928 | 87.6287 | 96.2089 | 100.00 | 90.8331 | 97.2264 |
| Source: Stastistics Canada, author’s calculation based on Table 34-10-0035. | ||||||||||
Based on the Annual Capital Expenditures Survey, capital expenditures in Canada are expected to recover partially in 2021. As stated by Statistics Canada (2021a), “capital expenditures on non-residential construction and machinery and equipment are expected to increase 7.0% to $266.2 billion in 2021, following a 9.2% decline in 2020 largely attributable to the economic shock from the COVID-19 pandemic.” In contrast, capital expenditures in the oil and gas extraction industry are expected to increase by 2%, from $21.7 billion in 2020 to $22.1 billion in 2021. However, a report by the Canadian Association of Petroleum Producers (CAPP 2021) predicts a 14% increase in oil and gas investment in the year 2021.Note The mixed signals from the two expectations suggest that the near- and longer-term outlook of investment in Canada’s oil and gas extraction industry remains to be seen.
Looking forward
Despite the recent rebound in oil prices, the future of Canadian oil and gas extraction remains uncertain.
First, near-term demand for crude oil could be weakened by new waves of the COVID-19 pandemic. For example, continued lockdowns in Canada and reduced demand from the United States were the main contributing factors to the 7.2% decline in the production of crude oil and equivalent products between January and February 2021 (Statistics Canada 2021b). Some positive news is that capital spending in supporting activities for mining and oil and gas extraction, which is considered a good barometer for investment activity in the oil sands, is expected to increase by more than 33% in 2021 after a 20% decline in 2020.Note This may be an optimistic sign for investment rebounding in oil sands extraction.
Second, the Canadian oil and gas extraction industry has also faced many headwinds for years that impeded or inhibited expansion and development of the industry. These headwinds include the declining investment and capital spending that reduced its production, the cancellation of Keystone XL that limited pipeline capacity potential, carbon pricing that led to noticeable production cost increases, and regulations designed to accelerate the transition to green energy that increased regulatory uncertainty and operating costs.
Also, the green energy movement continues. As stated by the International Energy Agency (IEA 2021), investment in renewable energy remains strong despite looming economic uncertainties. From January to October 2020, global auctioned renewable capacity was 15% higher than for the same period in the previous year, and this is a new record. The share of renewable energy in electricity generation was 27% in 2020, up a record 2.3 percentage points from 2019, and is expected to reach 33% by 2025.
In addition, financial support for fossil fuels is increasingly constrained. The Canadian government has committed to phasing out “inefficient fossil fuel subsidies” since 2009 (G20 2009). The Canadian government also recently announced a strengthened climate plan to support its target of net-zero emissions by 2050, which will increase the carbon tax from $50 per tonne in 2022 to $170 per tonne by 2030 (Environment and Climate Change Canada 2020). These new efforts may be accompanied by fossil fuel subsidy reform, as fossil fuel subsidies are ultimately not consistent with net-zero commitments. As stated by the International Institute for Sustainable Development (IISD 2021), direct spending on fossil fuels under federal initiatives not related to COVID-19 appears to have declined from $600 million in 2019/2020 to $90 million in 2020/2021. This is possibly to the result of concerted measures to reduce subsidies, a lag in reporting or reduced industrial activity during the pandemic.
References
Baker McKenzie. 2020. US: Impressions from OPEC+’s June 6 2020 Decision to Maintain Oil Production Cuts. Available at: https://www.bakermckenzie.com/en/insight/publications/2020/06/opec-decision-to-maintain-oil-production-cuts#:~:text=OPEC%2B%27s%20deal%20in%20April,June%202020%20(2%20months)%3B&text=5.8%20million%20barrels%20per%20day,April%202022%20(16%20months) (accessed May 20, 2021).
CAPP (Canadian Association of Petroleum Producers). 2021. Canadian Natural Gas and Oil Investment: Ready for Recovery? Canadian Association of Petroleum Producers report. Available at: https://context.capp.ca/infographics/2021/infographic-capital-expenditure (accessed April 18, 2021).
Environment and Climate Change Canada. 2020. A Healthy Environment and a Healthy Economy. Available at: https://www.canada.ca/content/dam/eccc/documents/pdf/climate-change/climate-plan/healthy_environment_healthy_economy_plan.pdf (accessed May 26, 2021).
G20. 2009. Leaders’ Statement. The Pittsburgh Summit: September 24–25, 2009. Available at: https://www.treasury.gov/resource-center/international/g7-g20/Documents/pittsburgh_summit_leaders_statement_250909.pdf (accessed May 26, 2021).
IEA (International Energy Agency). 2021. Renewables 2020: Analysis and Forecast to 2025. International Energy Association report. Available at: https://context.capp.ca/infographics/2021/infographic-capital-expenditure (accessed May 26, 2021).
IISD (International Institute for Sustainable Development). 2021. Federal Fossil Fuel Subsidies in Canada: COVID-19 Edition. Global Subsidies Initiative (GSI) report. Available at: https://www.iisd.org/system/files/2021-02/fossil-fuel-subsidies-canada-covid-19.pdf (accessed May 26, 2021).
Statistics Canada. 2021a. “Non-residential capital and repair expenditures, 2021 (intentions).” The Daily. February 26. Available at: https://www150.statcan.gc.ca/n1/daily-quotidien/210226/dq210226b-eng.htm (accessed May 26, 2021).
Statistics Canada. 2021b. “Energy statistics, February 2021.” The Daily. May 6. Available at: https://www150.statcan.gc.ca/n1/daily-quotidien/210506/dq210506a-eng.htm (accessed May 26, 2021).
Wang, W. 2020. The Decline in Production and Investment in Canada’s Oil and Gas Sector and Its Impact on the Economy. Economic Insights, no. 109. Statistics Canada Catalogue no. 11-626-X. Ottawa: Statistics Canada.
- Date modified: