
Energy statistics, February 2021

Archived Content
Information identified as archived is provided for reference, research or recordkeeping purposes. It is not subject to the Government of Canada Web Standards and has not been altered or updated since it was archived. Please "contact us" to request a format other than those available.
Released: 2021-05-06
20.9 million cubic metres
February 2021
-7.2% 
(12-month change)
8.4 million cubic metres
February 2021
-14.5%
(12-month change)
527.3 million gigajoules
February 2021
-6.3%
(12-month change)
57.0 million megawatt-hours
February 2021
-2.3%
(12-month change)
Energy prices rose sharply in February, while production declined year over year in all energy sectors, including crude oil, natural gas, refined petroleum products and electricity generation. The exception was an increase in coal output.
Overall, demand for energy products in Canada continued to be limited by ongoing lockdowns, curfews and travel restrictions. Furthermore, February saw extreme cold in certain parts of North America, which caused some disruptions in natural gas production, some temporary refinery shutdowns in the United States, and a sharp increase in demand and prices for natural gas and other energy products. During the month, exports of natural gas, refinery products and coal rose, while exports of crude oil and electricity were down.
For more information on energy in Canada, including production, consumption, international trade and much more, please visit the Canadian Centre for Energy Information website and follow #energynews on social media.
Crude oil production decreases year over year because of low demand
Production of crude oil and equivalent products fell 7.2% to 20.9 million cubic metres (131.6 million barrels) in February. This followed a 1.9% increase in January, which had marked the first year-over-year growth since the start of the COVID-19 pandemic. Continued lockdowns in Canada and reduced demand from the United States were the main contributing factors to the February decline in production.
Heavy, light and medium crude oil extraction, which has been on a downward trend since the beginning of the pandemic, decreased 18.3% to 5.2 million cubic metres in February. This was the largest year-over-year decline since May 2020 (-20.4%). Crude bitumen production fell 6.9% year over year to 8.1 million cubic metres, because of lower outputs from both in-situ and mining production facilities, while the production of equivalent products (-6.1%) was also down.
Partially offsetting the overall decline, synthetic crude oil production was up 4.6% to 5.7 million cubic metres. Synthetic crude oil production has been on an upward swing since the fourth quarter of 2020, when prices began to increase significantly.
Following a 12.2% gain in January, the crude oil and bitumen price index climbed 16.5% in February—the fourth consecutive monthly price increase and the largest since June 2020. Crude bitumen (+30.5%) and synthetic crude oil (+17.9%) reported the largest month-over-month gains. Continued cuts in production by the Organization of the Petroleum Exporting Countries Plus (OPEC+), lower production in the United States and increased global demand all contributed to the steep increase in the price of crude oil.
Global consumption of crude oil rose 2.2% from January to February, fuelled by the easing of COVID-19 restrictions and an increase in economic activity around the world. Nevertheless, global consumption was 2.0% below February 2020 levels, according to the US Energy Information Administration.
Chart 1

Production, exports and imports of crude oil and equivalent products
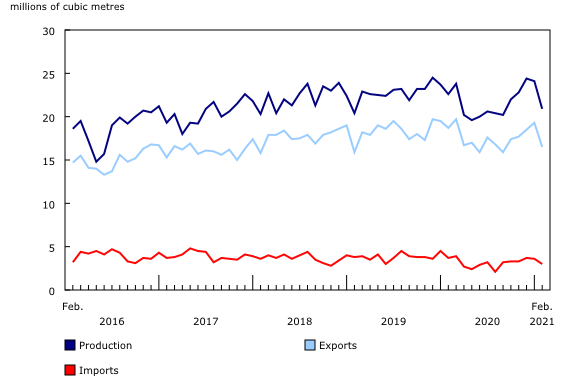
Exports of crude oil and equivalent products fell 11.9% to 16.5 million cubic metres in February—the largest year-over-year decrease since June 2020. Widespread shutdowns of refineries caused by extreme cold in the southern United States reduced the demand for Canadian crude oil in February. Overall, exports to the United States by rail, marine transportation and truck were most impacted, declining 61.5%, primarily because of lower volumes transported by rail. Crude oil transported by rail declined year over year for the 11th consecutive month in February, according to railway carloading statistics. Exports of crude oil by pipeline were down 5.9% year over year in February. In contrast, exports of crude oil to other countries were up 64.2% because of higher volumes originating from Newfoundland and Labrador.
Following a 20.8% decrease in January, imports of crude oil and equivalent products fell 18.1% year over year to 3.0 million cubic metres in February, as both imports by refineries (-9.9%) and imports by other entities (-30.8%) remained low during the month.
Lockdowns continue to affect refinery activity in February
In February, lockdowns were maintained in several provinces, continuing to affect both production and consumption of petroleum products.
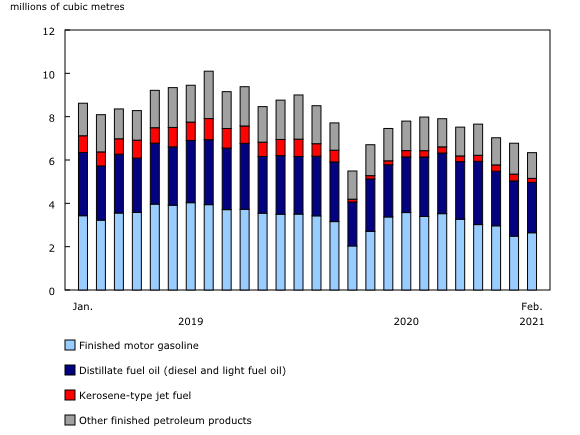
Demand for crude oil by Canadian refineries fell 13.4% year over year in February to 7.4 million cubic metres. Refinery capacity utilization also declined, down 2.7% from January to February, a second straight monthly decrease. Similarly, net production of finished petroleum products fell 14.5% year over year to 8.4 million cubic metres—the lowest level since June 2020. Finished motor gasoline (-21.8%) was the main contributor to the overall decline, while distillate fuel oil (-8.3%) and kerosene-type jet fuel (-56.7%) were also down.
Ongoing travel restrictions and curfews also reduced the demand for refined petroleum products. Refinery products supplied to Canadian consumers fell by just over one-quarter (-25.3%) year over year to 6.4 million cubic metres—the lowest level since April 2020. Demand for transportation fuels remained low in February. Finished motor gasoline fell 22.8% year over year, while distillate fuel oil, including diesel and light fuel oils, was down 15.5%—the largest year-over-year decrease since April 2020 (-19.2%). Consumption of kerosene-type jet fuel was down by over two-thirds (-68.0%), as air travel continued to be severely impacted by the pandemic. Average weekly domestic and international aircraft movements were over one-half (-51.2%) lower in February compared with the same month in 2020.
Chart 2
Finished petroleum products supplied to Canadian consumers
Overall, sales of petroleum and coal products, which include refinery activity, rose 6.5% from January to February, their fifth consecutive monthly increase. Higher prices of refined petroleum products were entirely responsible for the gain. Motor gasoline (+10.8%), diesel (+10.0%) and jet fuel (+10.1%) prices were all up significantly compared with the previous month. Nevertheless, sales in February were 14.6% below February 2020 levels.
Exports of refined petroleum products were up 1.9% year over year to 1.6 million cubic metres in February. The increase was attributable to higher demand from the United States, as extreme cold in the American Southwest in mid-February caused refineries to shut down, temporarily limiting the supply of refined petroleum products. According to the US Energy Information Administration, refinery capacity utilization in the United States fell to 70.8% in February—the lowest level since April 2020 (70.2%).
Imports of refined petroleum products were down by almost one-half (-48.2%) year over year, as lockdowns continued to limit the demand for transportation fuel.
Natural gas production down, deliveries to Canadian consumers and exports rise
Production of marketable natural gas declined for the 12th consecutive month, down 6.3% year over year to 527.3 million gigajoules in February. This decrease was attributable to lower levels of production in Alberta (-7.6%) and British Columbia (-1.8%).
In contrast, deliveries of natural gas to Canadian consumers were up 4.4% year over year to 483.6 million gigajoules. The rise was primarily driven by increased deliveries to residential (+8.5%) and commercial and institutional (+5.0%) consumers because of higher demand for heating. February 2021 was significantly colder on average, especially in central and Western Canada, compared with February 2020, according to Environment and Climate Change Canada data on heating degree days. Deliveries to the industrial sector also rose, up 2.7% to 279.4 million gigajoules, the third monthly year-over-year increase and the highest level for the month of February since the beginning of this series in 2016. The increase was mainly attributable to higher demand from industrial consumers in Ontario (+21.7%).
While production of natural gas fell in February, the increase in demand was met by drawing from inventories. Inventories held in Canadian facilities fell 22.8% in February to close at 615.5 million gigajoules—the largest monthly inventory withdrawal since the beginning of this series in January 2016.
Chart 3
Production, deliveries to Canadian consumers and exports of natural gas, year-over-year change
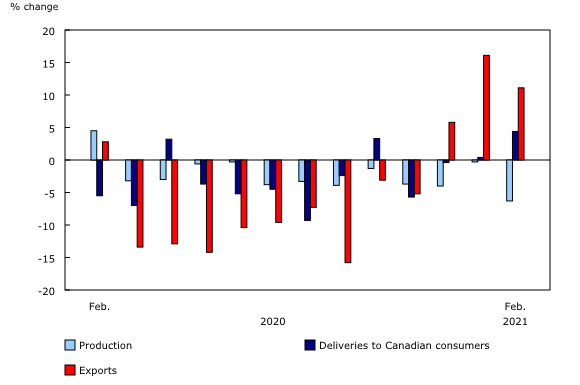
Demand for Canadian natural gas in the United States rose for the third consecutive month in February, as extreme cold weather both limited production capacity and increased the demand for heating. Exports of natural gas by pipeline to the United States increased 11.1% to 278.7 million gigajoules—the highest level for the month of February since the beginning of this series in January 2016. As a result, the natural gas price index was up 12.4% from January to February—the largest increase since March 2014 (+13.5%). Natural gas and, to a lesser extent, crude oil were the main contributors to Canada's merchandise trade balance surplus in February.
Imports of natural gas edged up 0.7% to 96.3 million gigajoules in February.
Electricity generation and consumption continue to fall year over year amid lower demand
Following a 1.5% decrease in January, electricity generation fell 2.3% year over year to 57.0 million megawatt-hours (MWh) in February. The decline was primarily driven by nuclear generation, down 17.9% year over year to 6.1 million MWh, as production continued to be limited by ongoing refurbishments and an unplanned outage at nuclear plants in Ontario and New Brunswick. Electricity generation from renewable energy sources (including hydro, wind, solar and other sources) was down 0.5% to 40.4 million MWh.
Partially offsetting the overall decrease, electricity generated from combustible fuels was up 1.9% to 11.2 million MWh, mostly as a result of larger volumes produced in Ontario, New Brunswick and Saskatchewan.
Electricity consumption decreased for the eighth consecutive month, down 1.7% year over year to 53.6 million MWh in February. The decline was mainly attributable to lower demand in Alberta (-6.5%), Ontario (-2.0%) and Quebec (-0.3%). In contrast, the Electric Power Selling Price Index rose 4.7% from January to February—the largest monthly increase since February 2020 (+6.7%)—as result of higher prices in Ontario and Alberta.
Chart 4
Electricity generation and consumption, year-over-year change

Following increases in December (+8.7%) and January (+7.6%), electricity exports to the United States decreased 7.8% year over year to 4.5 million MWh in February. Imports of electricity from the United States were up 3.7% to 1.2 million MWh, because of higher demand for imported electricity in Manitoba, New Brunswick and Ontario.
Production of coal rises year over year
Coal production was up 7.1% to 3.4 million tonnes in February—the second year-over-year increase—while exports of coal increased 18.4% to 2.0 million tonnes. Coke production decreased 3.6% to 172.3 thousand tonnes in February.
Note to readers
New as of March 2021 in the energy statistics release: selected provincial supply and disposition estimates for petroleum and other liquids. These data are now available in a new table (25-10-0081-01), which includes both Canadian and provincial supply and disposition estimates. The former table, 25-10-0076-01 (Petroleum products supply and disposition) was discontinued as of the December 2020 reference month.
The consolidated energy statistics table (25-10-0079-01) presents monthly data on primary and secondary energy by fuel type in terajoules (crude oil, natural gas, electricity, coal, etc.) and supply and demand characteristics (production, exports, imports, etc.) for Canada. The table uses data from a variety of survey and administrative sources. Estimates are available starting with the January 2020 reference month.
The survey programs that support the energy statistics release include the following:
- Crude oil and natural gas (survey number 2198, tables 25-10-0036-01, 25-10-0055-01 and 25-10-0063-01). Data for January 2021 have been revised.
- Energy transportation and storage (survey number 5300, tables 25-10-0075-01 and 25-10-0077-01).
- Natural gas transmission, storage and distribution (survey numbers 2149, 5210 and 5215, tables 25-10-0057-01, 25-10-0058-01 and 25-10-0059-01).
- Refined petroleum products (survey number 2150, table 25-10-0081-01). National and provincial supply estimates for renewable fuels, including ethanol fuel and renewable fuels except ethanol, are now available in table 25-10-0081-01 starting with the January 2020 reference month. More detailed renewable fuel data are also available upon request.
- Electric power statistics (survey number 2151, tables 25-10-0015-01 and 25-10-0016-01). Data for January 2021 have been revised.
- Coal and coke statistics (survey numbers 2147 and 2003, tables 25-10-0045-01 and 25-10-0046-01).
Data are subject to revisions. Energy data are revised on an ongoing basis for each month of the current year to reflect new information provided by respondents and updates to administrative data. Historical revisions are also performed periodically.
Definitions, data sources and methods for each survey program are available under their respective survey number.
The Energy Statistics Program uses respondent and administrative data.
Data in this release are not seasonally adjusted. Unless otherwise stated, the year-over-year calculations in this release are based on total monthly production volumes and do not take into account the extra day in February 2020. Year-over-year calculations for average daily production will yield different results.
Contact information
For more information, or to enquire about the concepts, methods or data quality of this release, contact us (toll-free 1-800-263-1136; 514-283-8300; STATCAN.infostats-infostats.STATCAN@canada.ca) or Media Relations (613-951-4636; STATCAN.mediahotline-ligneinfomedias.STATCAN@canada.ca).
- Date modified: