
A Presentation Series from Statistics Canada About the Economy, Environment and Society
Economic impacts of COVID-19 in the provinces and territories
Release date: June 23, 2021
Skip to text
Text begins
Lower economic activity during the COVID-19 pandemic highlights underlying differences in regional economies
While accommodation and food services, retail trade, and transportation services declined in all areas of the country, province-specific factors, including construction activities related to resource projects, played a key role in explaining how severely output contracted during 2020.
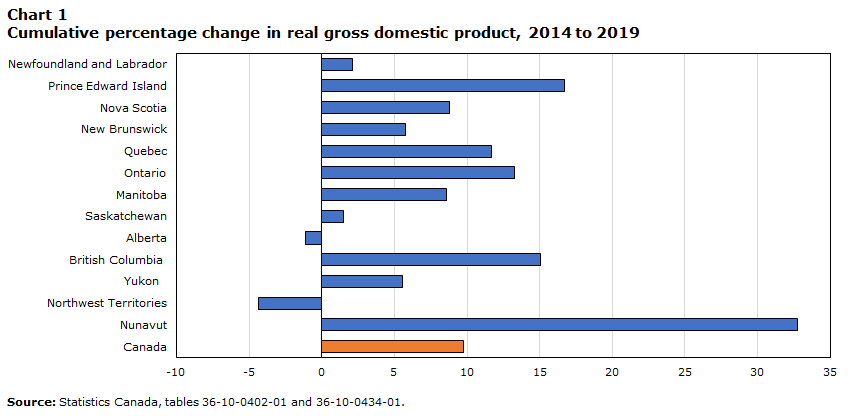
Data table for Chart 1
| Percent | |
|---|---|
| Newfoundland and Labrador | 2.1 |
| Prince Edward Island | 16.7 |
| Nova Scotia | 8.8 |
| New Brunswick | 5.8 |
| Quebec | 11.7 |
| Ontario | 13.3 |
| Manitoba | 8.6 |
| Saskatchewan | 1.5 |
| Alberta | -1.1 |
| British Columbia | 15.1 |
| Yukon | 5.6 |
| Northwest Territories | -4.3 |
| Nunavut | 32.7 |
| Canada | 9.7 |
| Source: Statistics Canada, tables 36-10-0402-01 and 36-10-0434-01. | |

Data table for Chart 2
| 2019 | 2020 | |
|---|---|---|
| percent | ||
| Newfoundland and Labrador | 4.0 | -5.3 |
| Prince Edward Island | 5.1 | -3.0 |
| Nova Scotia | 2.5 | -3.2 |
| New Brunswick | 1.1 | -3.7 |
| Quebec | 2.7 | -5.3 |
| Ontario | 2.1 | -5.0 |
| Manitoba | 0.5 | -4.8 |
| Saskatchewan | -0.9 | -5.2 |
| Alberta | 0.0 | -8.2 |
| British Columbia | 2.5 | -3.8 |
| Yukon | 0.7 | 1.1 |
| Northwest Territories | -8.1 | -10.4 |
| Nunavut | 6.5 | 3.5 |
| Canada | 1.8 | -5.3 |
| Source: Statistics Canada, tables 36-10-0402-01 and 36-10-0434-01. | ||
In Atlantic Canada
- In the Maritime Provinces, increases in real estate activity and financial services helped mitigate steep declines in tourism-related sectors. Construction activity also rose in Prince Edward Island and Nova Scotia.
- About one half of the decline in Newfoundland and Labrador’s economic output reflected lower engineering construction linked to major resource projects.
In Central Canada
- Lower manufacturing activity in Ontario and Quebec accounted for nearly one quarter of the declines in economic output, while increases in financial activity helped mitigate losses in both provinces.
In Western Canada
- Reductions in engineering construction linked to resource projects exacerbated declines in Alberta, Saskatchewan and Manitoba. Lower oil and gas extraction in Alberta and Saskatchewan also contributed to sizable declines in economic activity.
- Increases in engineering construction linked to major resource projects in British Columbia helped offset lower manufacturing output. Notable increases in real estate activity also helped to mitigate declines in high-contact sectors.
In Northern Canada
- Yukon and Nunavut were the only jurisdictions where real gross domestic product rose in 2020, led by sharp increases in mining activity. Economic output in the Northwest Territories fell by 10% on lower mining and oil and gas extraction.
More resilient economic activity during the second and third waves as businesses and households continued to adjust to containment measures
- New monthly estimates of economic activity highlight steep declines in Alberta and Saskatchewan since the start of the pandemic, and along with sizable declines in Ontario, New Brunswick and Quebec. These reflect large decreases in economic activity during the initial lockdowns.
- While activity levels have generally remained resilient during the second and third waves, the monthly data point to a slowdown in the pace of the recovery in many regions of the country as containment measures tightened during late 2020 and early 2021.

Data table for Chart 3
| PCA-based index | LASSO-based index | |
|---|---|---|
| percent | ||
| Newfoundland and Labrador | Note .: not available for any reference period | 3.0 |
| Prince Edward Island | -3.5 | 1.7 |
| Nova Scotia | 1.2 | 1.6 |
| New Brunswick | -6.0 | 0.7 |
| Quebec | -5.3 | 0.5 |
| Ontario | -9.1 | -0.1 |
| Manitoba | 4.2 | 2.5 |
| Saskatchewan | -17.5 | 0.2 |
| Alberta | -25.0 | -13.0 |
| British Columbia | -0.2 | 1.0 |
| Yukon | Note .: not available for any reference period | 3.4 |
| Northwest Territories | -4.8 | Note .: not available for any reference period |
| Nunavut | Note .: not available for any reference period | 4.1 |
|
. not available for any reference period Notes: PCA=Principal Component Analysis. LASSO=least absolute shrinkage and selection operator. Source: Statistics Canada, table 36-10-0633-01. |
||
British Columbia: Strongest employment recovery in Canada
Pre-COVID-19:
- Real gross domestic product rose by 2.5% in 2019, supported by notable increases in construction & real estate activity.
- Employment in finance & education rose by 12,200 during 2019, while net losses in manufacturing exceeded 10,000.
Post-COVID-19:
- Real gross domestic product contracted by 3.8% in 2020, the smallest decline outside of the Atlantic bubble.
- British Columbia experienced the strongest employment recovery of the country.
- Employment in professional, scientific and technical services has risen by 36,500 since February 2020.
- As of February 2021, British Columbia was the only province where the number of businesses operating in the business sector had surpassed pre-COVID-19 levels.
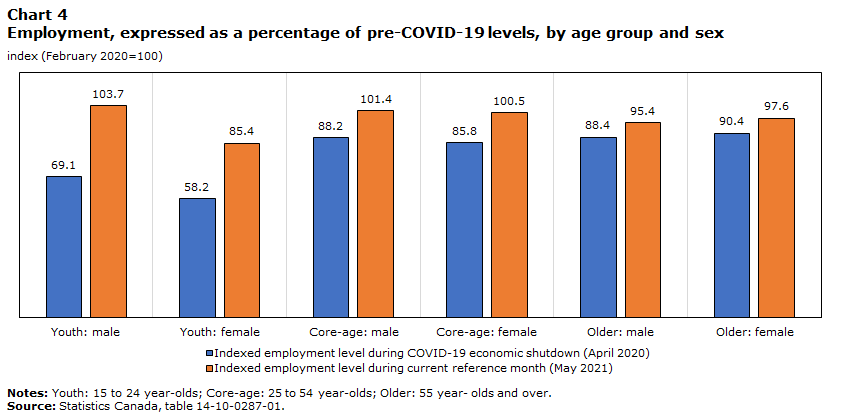
Data table for Chart 4
| Indexed employment level during COVID-19 economic shutdown (April 2020) | Indexed employment level during current reference month (May 2021) | |
|---|---|---|
| index (February 2020=100) |
||
| Youth: male | 69.1 | 103.7 |
| Youth: female | 58.2 | 85.4 |
| Core-age: male | 88.2 | 101.4 |
| Core-age: female | 85.8 | 100.5 |
| Older: male | 88.4 | 95.4 |
| Older: female | 90.4 | 97.6 |
|
Notes: Youth: 15 to 24 year-olds; Core-age: 25 to 54 year-olds; Older: 55 year- olds and over. Source: Statistics Canada, table 14-10-0287-01. |
||
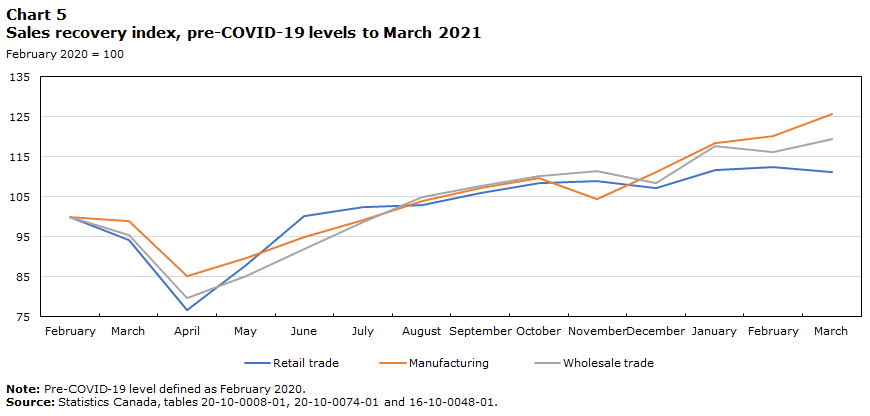
Data table for Chart 5
| Retail trade | Manufacturing | Wholesale trade | |
|---|---|---|---|
| February 2020 = 100 |
|||
| February | 100.0000 | 100.0000 | 100.0000 |
| March | 94.1318 | 99.0246 | 95.3524 |
| April | 76.6762 | 85.2151 | 79.8161 |
| May | 88.0033 | 89.7940 | 85.1674 |
| June | 100.2905 | 94.8783 | 91.8977 |
| July | 102.4387 | 99.1258 | 98.6095 |
| August | 102.9570 | 104.0095 | 105.0231 |
| September | 105.9718 | 107.1838 | 107.5717 |
| October | 108.3845 | 109.7936 | 110.0727 |
| November | 108.8904 | 104.5243 | 111.4599 |
| December | 107.0707 | 111.1516 | 108.5270 |
| January | 111.7387 | 118.4276 | 117.6154 |
| February | 112.3201 | 120.1385 | 116.0457 |
| March | 111.1190 | 125.7395 | 119.5387 |
|
Note: Pre-COVID-19 level defined as February 2020. Source: Statistics Canada, tables 20-10-0008-01, 20-10-0074-01 and 16-10-0048-01. |
|||

Data table for Chart 6
| Percent change | |
|---|---|
| B.C. | 0.51 |
| P.E.I. | -0.10 |
| N.S. | -0.90 |
| Sask. | -0.98 |
| Que. | -1.12 |
| Man. | -1.14 |
| N.B. | -1.68 |
| Canada | -1.95 |
| Alta. | -2.14 |
| N.L. | -4.44 |
| Ont. | -4.54 |
| Source: Statistics Canada table 33-10-0270-01. | |
Alberta: Remains hardest hit by COVID-19 due to impacts on energy sector
Pre-COVID-19:
- Economic growth stalled in 2019.
- Declines in construction activity were offset by gains in real estate, healthcare and finance.
- Total employment was little changed in 2019, as the province’s unemployment rate remained the highest in Western Canada.
Post-COVID-19:
- Economic activity was hardest hit in Alberta due to the impact of COVID-19 on oil prices. Real GDP in the province contracted by 8.2% in 2020.
- 2021 private capital intentions remain nearly 20% below pre-COVID-19 levels reported in 2019.
- As of February 2021, the number of active businesses operating in Alberta was 2.1% below pre-COVID-19 levels, the largest net decline in Western Canada.
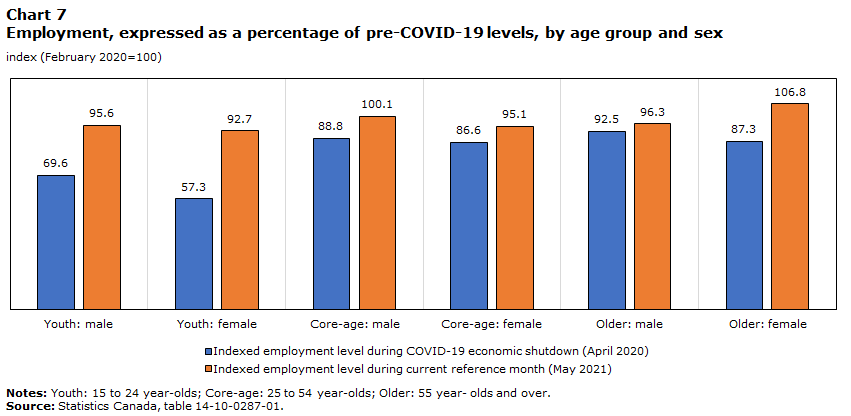
Data table for Chart 7
| Indexed employment level during COVID-19 economic shutdown (April 2020) | Indexed employment level during current reference month (May 2021) | |
|---|---|---|
| index (February 2020=100) | ||
| Youth: male | 69.6 | 95.6 |
| Youth: female | 57.3 | 92.7 |
| Core-age: male | 88.8 | 100.1 |
| Core-age: female | 86.6 | 95.1 |
| Older: male | 92.5 | 96.3 |
| Older: female | 87.3 | 106.8 |
|
Notes: Youth: 15 to 24 year-olds; Core-age: 25 to 54 year-olds; Older: 55 year- olds and over. Source: Statistics Canada, table 14-10-0287-01. |
||
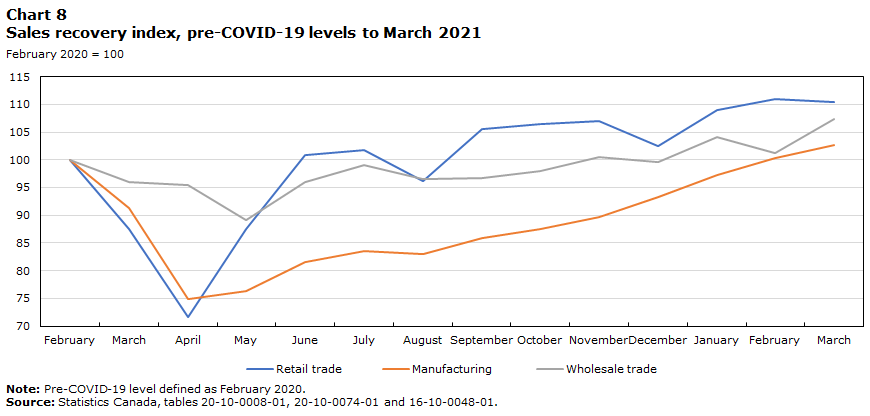
Data table for Chart 8
| Retail trade | Manufacturing | Wholesale trade | |
|---|---|---|---|
| February 2020 = 100 | |||
| February | 100.0 | 100.0 | 100.0 |
| March | 87.5 | 91.3 | 96.0 |
| April | 71.6 | 74.9 | 95.5 |
| May | 87.5 | 76.3 | 89.2 |
| June | 100.9 | 81.5 | 95.9 |
| July | 101.7 | 83.5 | 99.0 |
| August | 96.1 | 83.0 | 96.5 |
| September | 105.6 | 85.9 | 96.7 |
| October | 106.5 | 87.4 | 97.9 |
| November | 106.9 | 89.7 | 100.5 |
| December | 102.6 | 93.3 | 99.7 |
| January | 108.9 | 97.2 | 104.1 |
| February | 110.9 | 100.3 | 101.3 |
| March | 110.4 | 102.7 | 107.4 |
|
Note: Pre-COVID-19 level defined as February 2020. Source: Statistics Canada, tables 20-10-0008-01, 20-10-0074-01 and 16-10-0048-01. |
|||
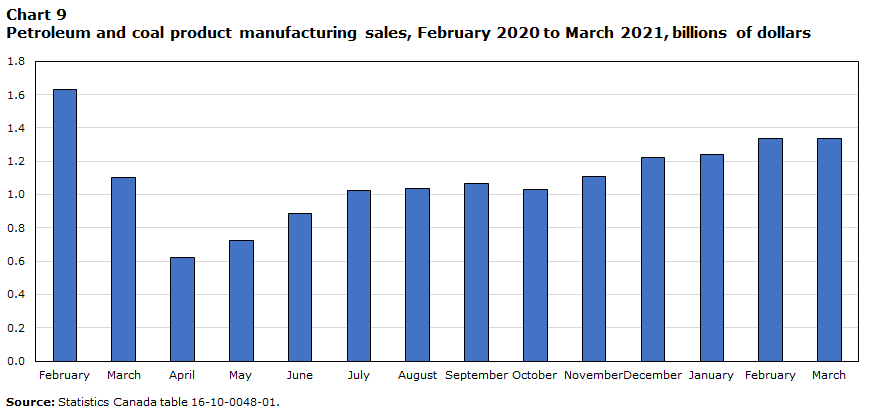
Data table for Chart 9
| Alberta | |
|---|---|
| dollars | |
| February | 1,627,712,000 |
| March | 1,103,407,000 |
| April | 620,579,000 |
| May | 726,393,000 |
| June | 883,958,000 |
| July | 1,025,166,000 |
| August | 1,034,516,000 |
| September | 1,068,451,000 |
| October | 1,027,727,000 |
| November | 1,106,484,000 |
| December | 1,224,629,000 |
| January | 1,242,525,000 |
| February | 1,338,013,000 |
| March | 1,338,013,001 |
| Source: Statistics Canada table 16-10-0048-01. | |
Saskatchewan: Second largest decline in economic activity since the onset of the pandemic due to stresses on resources and energy
Pre-COVID-19:
- Real gross domestic product declined by 0.9% in 2019.
- Lower economic output reflected notable declines in non-metallic mining and quarrying, manufacturing and residential building construction.
- Overall employment held steady in 2019 with gains in service industries offsetting lower employment in the goods sector.
Post-COVID-19:
- Real gross domestic product contracted by 5.2% in 2020. Experimental monthly estimates of economic activity point to relatively severe economic impacts since the onset of the pandemic.
- Wholesale agricultural supplies & farm machinery sales were less impacted by economic disruptions due to COVID-19. As of March, Saskatchewan has the strongest recovery in wholesale sales of the Western provinces.
- As of May, Saskatchewan has the strongest recovery in youth employment outside of the Atlantic bubble as the province avoids a third wave of restrictions.

Data table for Chart 10
| Indexed employment level during COVID-19 economic shutdown (April 2020) | Indexed employment level during current reference month (May 2021) | |
|---|---|---|
| index (February 2020=100) | ||
| Youth: male | 76.5 | 100.5 |
| Youth: female | 73.3 | 103.6 |
| Core-age: male | 90.8 | 100.6 |
| Core-age: female | 88.3 | 99.2 |
| Older: male | 92.3 | 91.6 |
| Older: female | 83.8 | 92.6 |
|
Notes: Youth: 15 to 24 year-olds; Core-age: 25 to 54 year-olds; Older: 55 year- olds and over. Source: Statistics Canada, table 14-10-0287-01. |
||
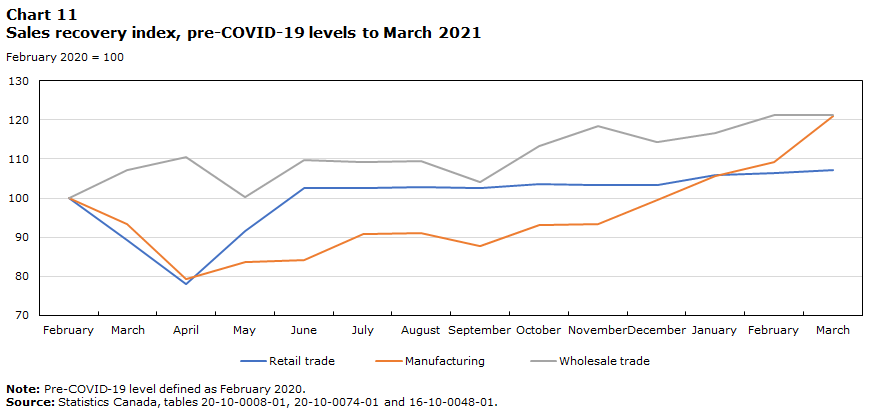
Data table for Chart 11
| Retail trade | Manufacturing | Wholesale trade | |
|---|---|---|---|
| February 2020 = 100 | |||
| February | 100.0 | 100.0 | 100.0 |
| March | 89.3 | 93.3 | 107.1 |
| April | 78.0 | 79.4 | 110.4 |
| May | 91.7 | 83.6 | 100.3 |
| June | 102.6 | 84.1 | 109.6 |
| July | 102.6 | 90.9 | 109.2 |
| August | 102.9 | 91.1 | 109.5 |
| September | 102.6 | 87.7 | 104.1 |
| October | 103.5 | 93.2 | 113.4 |
| November | 103.2 | 93.4 | 118.3 |
| December | 103.2 | 99.6 | 114.3 |
| January | 105.9 | 105.7 | 116.6 |
| February | 106.4 | 109.3 | 121.2 |
| March | 107.1 | 120.9 | 121.2 |
|
Note: Pre-COVID-19 level defined as February 2020. Source: Statistics Canada, tables 20-10-0008-01, 20-10-0074-01 and 16-10-0048-01. |
|||

Data table for Chart 12
| Manitoba | Saskatchewan | Alberta | British Columbia | |
|---|---|---|---|---|
| February 2020 = 100 | ||||
| February | 100.0 | 100.0 | 100.0 | 100.0 |
| March | 85.9 | 90.2 | 81.1 | 84.1 |
| April | 67.2 | 75.0 | 63.4 | 63.7 |
| May | 74.2 | 73.1 | 69.8 | 66.6 |
| June | 86.8 | 87.8 | 80.9 | 79.6 |
| July | 87.0 | 93.9 | 83.9 | 88.0 |
| August | 90.8 | 93.7 | 83.8 | 86.7 |
| September | 92.1 | 99.0 | 87.6 | 88.2 |
| October | 93.9 | 97.8 | 90.9 | 89.9 |
| November | 83.7 | 95.3 | 89.8 | 92.7 |
| December | 79.8 | 91.6 | 84.1 | 90.5 |
| January | 82.1 | 93.0 | 88.2 | 93.3 |
| February | 89.7 | 94.6 | 90.2 | 97.5 |
| March | 94.6 | 97.0 | 95.0 | 104.2 |
| April | 95.8 | 97.8 | 93.0 | 96.5 |
| May | 95.7 | 101.8 | 94.1 | 94.5 |
|
Notes: Pre-COVID-19 level defined as February 2020. Youth: 15 to 24 year-olds. Source: Statistics Canada, table 14-10-0287-01. |
||||
Employment in Manitoba quickly rebounded as second-wave public health restrictions were eased
Pre-COVID-19:
- Real GDP growth slowed to 0.5% in 2019.
- Increased output was led by gains in the service sector, including real estate and healthcare.
- Manufacturing output fell as factory employment declined.
Post-COVID-19:
- Real gross domestic product contracted by 4.8% in 2020.
- Following new restrictions in response to the second wave of COVID-19, employment fell sharply in late 2020. Employment has since rebounded as restrictions eased.
- Retail sales fluctuated sharply as a result of second-wave restrictions, but has since recovered to have the strongest recovery of the Western provinces as of March.
- Economic declines in Manitoba were generally in the mid-range compared to those in other provinces.
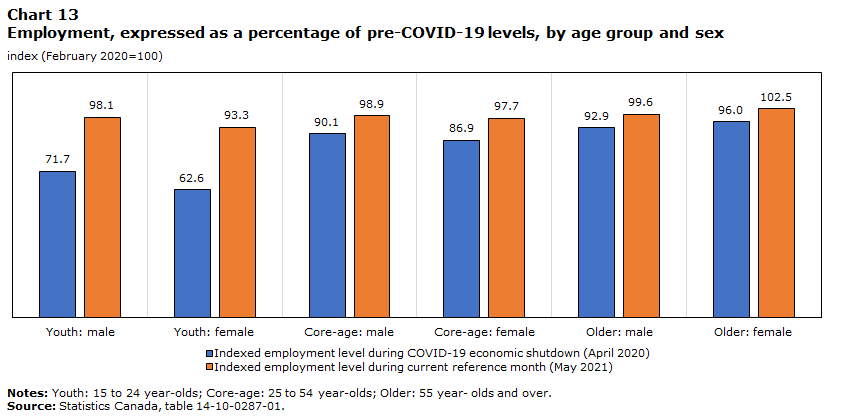
Data table for Chart 13
| Indexed employment level during COVID-19 economic shutdown (April 2020) | Indexed employment level during current reference month (May 2021) | |
|---|---|---|
| index (February 2020=100) | ||
| Youth: male | 71.7 | 98.1 |
| Youth: female | 62.6 | 93.3 |
| Core-age: male | 90.1 | 98.9 |
| Core-age: female | 86.9 | 97.7 |
| Older: male | 92.9 | 99.6 |
| Older: female | 96.0 | 102.5 |
|
Notes: Youth: 15 to 24 year-olds; Core-age: 25 to 54 year-olds; Older: 55 year- olds and over. Source: Statistics Canada, table 14-10-0287-01. |
||

Data table for Chart 14
| Retail trade | Manufacturing | Wholesale trade | |
|---|---|---|---|
| February 2020 = 100 | |||
| February | 100.0 | 100.0 | 100.0 |
| March | 90.8 | 107.2 | 99.0 |
| April | 72.6 | 88.0 | 89.8 |
| May | 93.0 | 93.0 | 92.9 |
| June | 103.7 | 91.3 | 99.1 |
| July | 106.0 | 101.5 | 106.3 |
| August | 103.4 | 102.0 | 103.4 |
| September | 105.4 | 105.7 | 105.8 |
| October | 106.8 | 108.0 | 101.1 |
| November | 99.3 | 106.5 | 106.4 |
| December | 92.4 | 110.9 | 108.3 |
| January | 108.1 | 111.7 | 107.5 |
| February | 114.3 | 109.0 | 105.9 |
| March | 112.9 | 113.2 | 106.9 |
|
Note: Pre-COVID-19 level defined as February 2020. Source: Statistics Canada, tables 20-10-0008-01, 20-10-0074-01 and 16-10-0048-01. |
|||
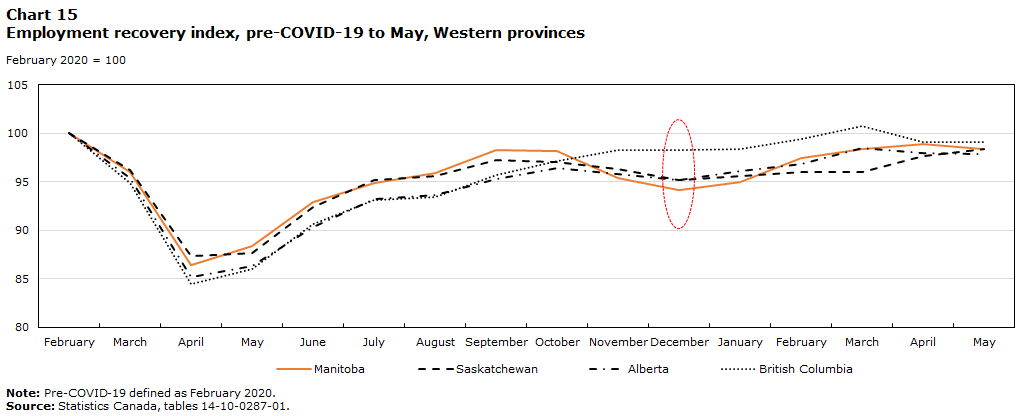
Data table for Chart 15
| Manitoba | Saskatchewan | Alberta | British Columbia | |
|---|---|---|---|---|
| February 2020=100 | ||||
| February | 100.0 | 100.0 | 100.0 | 100.0 |
| March | 96.0 | 96.2 | 95.4 | 94.9 |
| April | 86.4 | 87.4 | 85.1 | 84.5 |
| May | 88.4 | 87.7 | 86.3 | 86.0 |
| June | 92.9 | 92.4 | 90.3 | 90.7 |
| July | 94.9 | 95.2 | 93.2 | 93.2 |
| August | 95.9 | 95.6 | 93.7 | 93.5 |
| September | 98.2 | 97.2 | 95.3 | 95.7 |
| October | 98.1 | 97.0 | 96.4 | 97.2 |
| November | 95.3 | 96.3 | 95.8 | 98.3 |
| December | 94.2 | 95.2 | 95.2 | 98.3 |
| January | 95.0 | 95.6 | 96.1 | 98.4 |
| February | 97.4 | 96.0 | 96.9 | 99.4 |
| March | 98.4 | 96.0 | 98.5 | 100.8 |
| April | 98.9 | 97.6 | 98.0 | 99.1 |
| May | 98.4 | 98.4 | 97.9 | 99.0 |
|
Note: Pre-COVID-19 defined as February 2020. Source: Statistics Canada, tables 14-10-0287-01. |
||||
Ontario: Extended lockdowns dampened the economic recovery in hard-hit sectors
Pre-COVID-19:
- Real GDP grew by 2.1% in 2019 driven by higher output in services industries.
- Strong growth in professional, scientific and technical services as employment rose by 54,000.
- Employment rose by over 250,000 in the services sector.
Post-COVID-19:
- Real gross domestic product contracted by 5.0% in 2020.
- Employment levels in professional, scientific and technical industries has risen by more than 53,000 since February 2020
- Private capital intentions in Ontario are at 95% of pre-COVID-19 levels reported in 2019, the highest level in the country.
- As of February, Ontario has the lowest percentage of active businesses, relative to pre-COVID-19 levels, following second lockdown that resulted in sharp employment losses. Currently the province has the second lowest employment levels relative to those pre-pandemic, in the country.
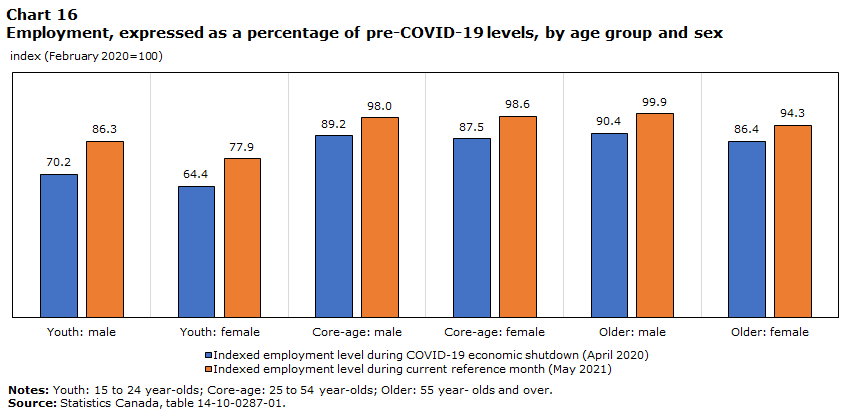
Data table for Chart 16
| Indexed employment level during COVID-19 economic shutdown (April 2020) | Indexed employment level during current reference month (May 2021) | |
|---|---|---|
| index (February 2020=100) | ||
| Youth: male | 70.2 | 86.3 |
| Youth: female | 64.4 | 77.9 |
| Core-age: male | 89.2 | 98.0 |
| Core-age: female | 87.5 | 98.6 |
| Older: male | 90.4 | 99.9 |
| Older: female | 86.4 | 94.3 |
|
Notes: Youth: 15 to 24 year-olds; Core-age: 25 to 54 year-olds; Older: 55 year- olds and over. Source: Statistics Canada, table 14-10-0287-01. |
||

Data table for Chart 17
| Retail trade | Manufacturing | Wholesale trade | |
|---|---|---|---|
| February 2020 = 100 | |||
| February | 100.0 | 100.0 | 100.0 |
| March | 91.9 | 86.0 | 95.3 |
| April | 63.6 | 53.8 | 66.3 |
| May | 75.5 | 64.1 | 72.7 |
| June | 99.9 | 90.1 | 93.6 |
| July | 99.8 | 101.2 | 98.1 |
| August | 99.4 | 96.1 | 98.4 |
| September | 101.2 | 97.0 | 99.4 |
| October | 101.6 | 97.0 | 100.8 |
| November | 104.8 | 95.9 | 101.1 |
| December | 98.0 | 95.1 | 101.2 |
| January | 96.2 | 98.6 | 103.5 |
| February | 99.6 | 93.8 | 102.7 |
| March | 108.6 | 96.5 | 103.0 |
|
Note: Pre-COVID-19 level defined as February 2020. Source: Statistics Canada, tables 20-10-0008-01, 20-10-0074-01 and 16-10-0048-01. |
|||

Data table for Chart 18
| Motor vehicle manufacturing | |
|---|---|
| dollars | |
| February | 4,454,977,000 |
| March | 2,869,437,000 |
| April | 562,000 |
| May | 956,264,000 |
| June | 3,761,624,000 |
| July | 5,003,648,000 |
| August | 4,367,404,000 |
| September | 4,243,350,000 |
| October | 4,261,516,000 |
| November | 3,985,447,000 |
| December | 4,021,641,000 |
| January | 3,627,101,000 |
| February | 3,074,183,000 |
| March | 3,410,652,000 |
| Source: Statistics Canada table 16-10-0048-01. | |
Quebec: Second lockdown weighed on youth employment
Pre-COVID-19:
- Real gross domestic product rose by 2.7% in 2019.
- Higher output reflected gains in manufacturing and services.
- Employment rose by 66,000 in 2019, with over three-quarters of the increase in service industries.
Post-COVID-19:
- Economic activity contracted by 5.3% in 2020.
- Employment losses in April 2020 were relatively severe compared to other provinces.
- The second lockdown had a strong impact on youth employment. As of May 2021, youth employment is at 90% of its pre-COVID-19 level.
- Despite large declines during the lockdowns, retail sales as of March were nearly 15% above pre-COVID-19 levels.
- Quebec has experienced the largest percentage increase in new housing prices of the provinces since the onset of the pandemic.

Data table for Chart 19
| Indexed employment level during COVID-19 economic shutdown (April 2020) | Indexed employment level during current reference month (May 2021) | |
|---|---|---|
| index (February 2020=100) | ||
| Youth: male | 65.6 | 91.6 |
| Youth: female | 60.4 | 88.8 |
| Core-age: male | 84.4 | 98.6 |
| Core-age: female | 86.2 | 96.2 |
| Older: male | 78.4 | 102.6 |
| Older: female | 81.7 | 96.2 |
|
Notes: Youth: 15 to 24 year-olds; Core-age: 25 to 54 year-olds; Older: 55 year- olds and over. Source: Statistics Canada, table 14-10-0287-01. |
||
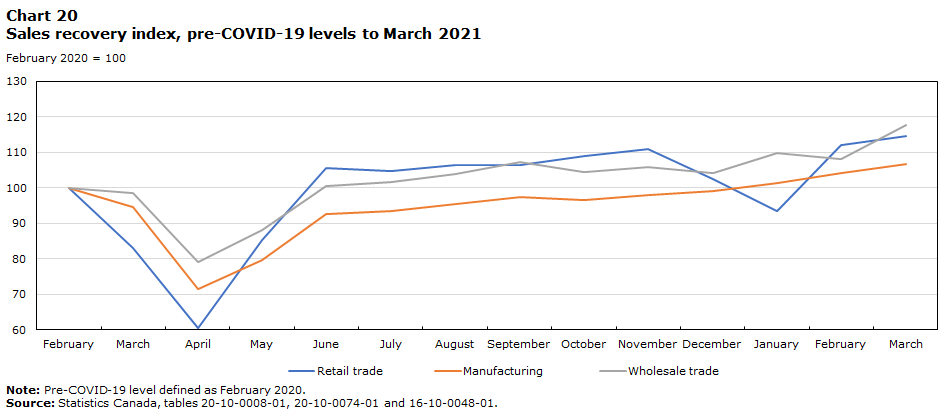
Data table for Chart 20
| Retail trade | Manufacturing | Wholesale trade | |
|---|---|---|---|
| February 2020 = 100 | |||
| February | 100.0 | 100.0 | 100.0 |
| March | 83.1 | 94.5 | 98.5 |
| April | 60.4 | 71.5 | 79.2 |
| May | 85.3 | 79.7 | 88.0 |
| June | 105.5 | 92.6 | 100.5 |
| July | 104.7 | 93.6 | 101.7 |
| August | 106.5 | 95.6 | 103.8 |
| September | 106.3 | 97.3 | 107.3 |
| October | 108.9 | 96.6 | 104.4 |
| November | 111.0 | 98.0 | 105.8 |
| December | 102.5 | 99.2 | 104.1 |
| January | 93.4 | 101.3 | 109.7 |
| February | 112.1 | 104.2 | 108.2 |
| March | 114.6 | 106.6 | 117.7 |
|
Note: Pre-COVID-19 level defined as February 2020. Source: Statistics Canada, tables 20-10-0008-01, 20-10-0074-01 and 16-10-0048-01. |
|||
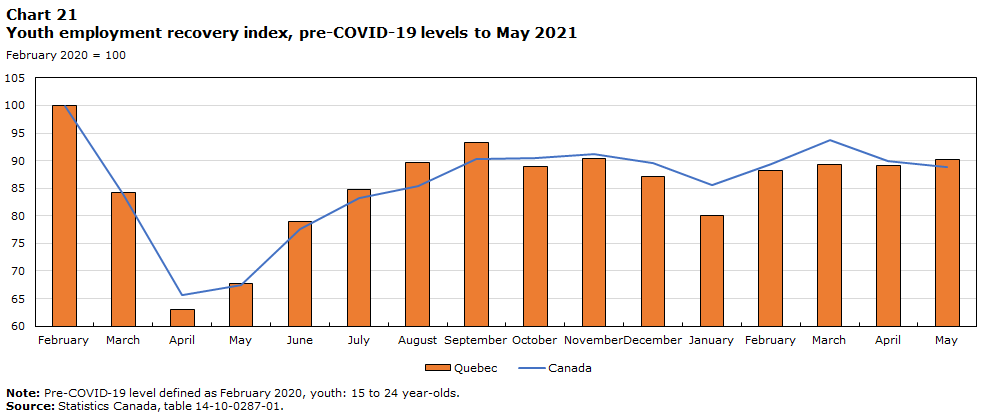
Data table for Chart 21
| Canada | Quebec | |
|---|---|---|
| February 2020 = 100 | ||
| February | 100.0 | 100.0 |
| March | 84.0 | 84.3 |
| April | 65.7 | 63.1 |
| May | 67.5 | 67.7 |
| June | 77.6 | 78.9 |
| July | 83.1 | 84.7 |
| August | 85.4 | 89.6 |
| September | 90.4 | 93.2 |
| October | 90.5 | 89.0 |
| November | 91.2 | 90.5 |
| December | 89.6 | 87.2 |
| January | 85.5 | 80.0 |
| February | 89.4 | 88.2 |
| March | 93.8 | 89.2 |
| April | 89.9 | 89.1 |
| May | 88.9 | 90.2 |
|
Note: Pre-COVID-19 level defined as February 2020. Youth: 15 to 24 year-olds. Source: Statistics Canada, table 14-10-0287-01. |
||
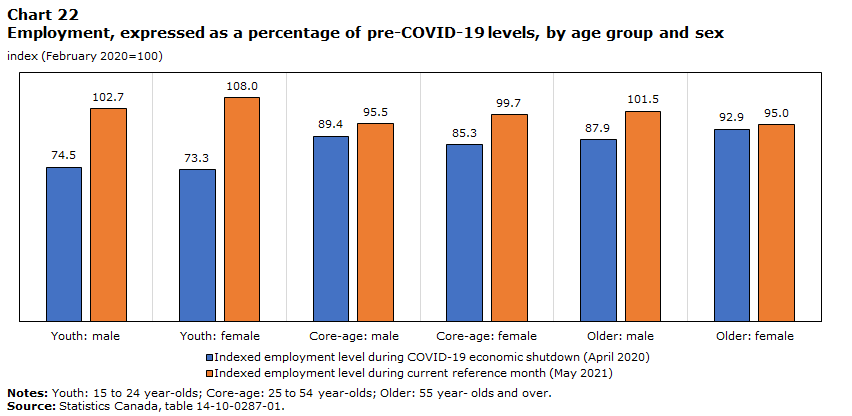
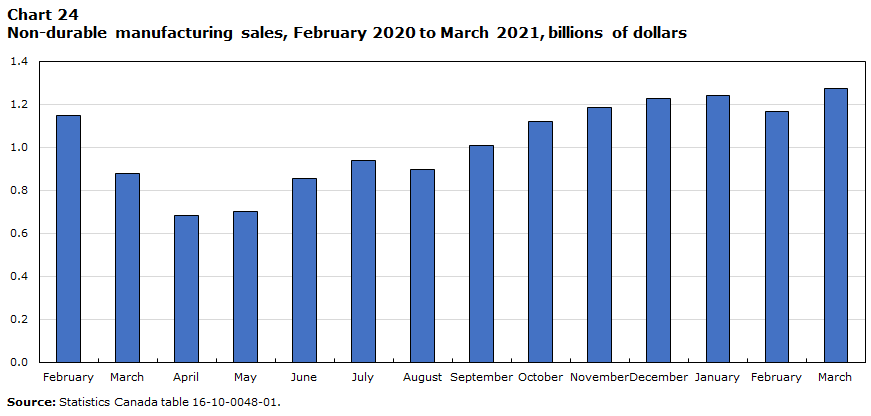
New Brunswick: Youth employment strengthens
Pre-COVID-19:
- Real gross domestic product grew by 1.1% in 2019.
- Higher output was supported by gains in utilities and healthcare.
- Declines in transportation, engineering construction and resource extraction tempered overall growth.
Post-COVID-19:
- Real GDP declined by 3.7% in 2020.
- As of March, the province experienced the second strongest manufacturing recovery in Atlantic Canada, as non-durables rebounded.
- As of May 2021, New Brunswick is one of only three provinces with youth employment above pre-COVID-19 levels, narrowly behind Newfoundland and Labrador.
Data table for Chart 22
| Indexed employment level during COVID-19 economic shutdown (April 2020) | Indexed employment level during current reference month (May 2021) | |
|---|---|---|
| index (February 2020=100) | ||
| Youth: male | 74.5 | 102.7 |
| Youth: female | 73.3 | 108.0 |
| Core-age: male | 89.4 | 95.5 |
| Core-age: female | 85.3 | 99.7 |
| Older: male | 87.9 | 101.5 |
| Older: female | 92.9 | 95.0 |
|
Notes: Youth: 15 to 24 year-olds; Core-age: 25 to 54 year-olds; Older: 55 year- olds and over. Source: Statistics Canada, table 14-10-0287-01. |
||

Data table for Chart 23
| Retail trade | Manufacturing | Wholesale trade | |
|---|---|---|---|
| February 2020 = 100 | |||
| February | 100.0 | 100.0 | 100.0 |
| March | 88.8 | 79.3 | 98.7 |
| April | 73.3 | 64.5 | 79.0 |
| May | 91.3 | 66.9 | 85.0 |
| June | 102.5 | 80.2 | 103.6 |
| July | 102.1 | 86.8 | 100.1 |
| August | 102.2 | 85.5 | 105.3 |
| September | 107.0 | 95.4 | 102.7 |
| October | 102.0 | 102.8 | 104.9 |
| November | 104.9 | 107.4 | 107.9 |
| December | 99.1 | 110.7 | 105.4 |
| January | 106.4 | 117.2 | 112.2 |
| February | 106.2 | 111.9 | 112.4 |
| March | 106.6 | 119.7 | 112.0 |
|
Note: Pre-COVID-19 level defined as February 2020. Source: Statistics Canada, tables 20-10-0008-01, 20-10-0074-01 and 16-10-0048-01. |
|||
Data table for Chart 24
| Non-durable goods | |
|---|---|
| dollars | |
| February | 1,149,327,000 |
| March | 876,332,000 |
| April | 683,617,000 |
| May | 702,965,000 |
| June | 857,193,000 |
| July | 940,760,000 |
| August | 896,631,000 |
| September | 1,008,058,000 |
| October | 1,121,850,000 |
| November | 1,186,762,000 |
| December | 1,224,745,000 |
| January | 1,242,022,000 |
| February | 1,168,062,000 |
| March | 1,275,101,000 |
| Source: Statistics Canada table 16-10-0048-01. | |
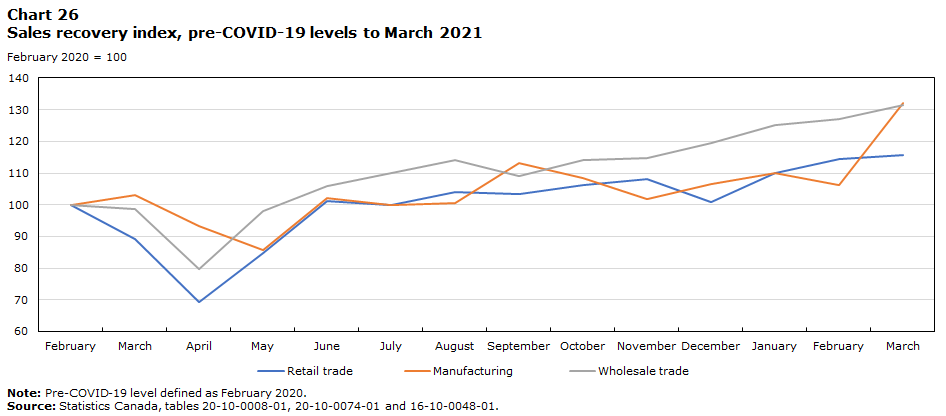
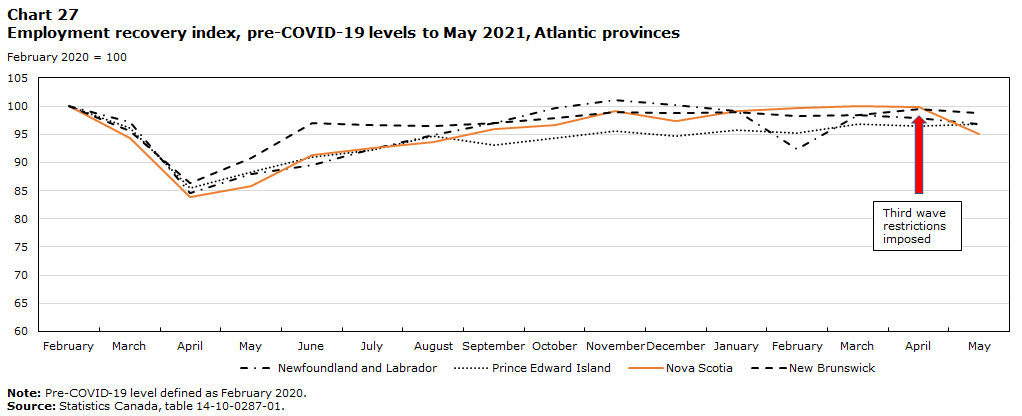
Nova Scotia: Late April restrictions halt employment recovery
Pre-COVID-19:
- Economy advanced by 2.5% in 2019, reflecting broad-based gains among services, led by real estate and healthcare.
- Higher manufacturing output reflected increases in shipbuilding.
- Employment gains largely reflected increases in healthcare and manufacturing.
Post-COVID-19:
- Economic activity declined by 3.2% in 2020.
- In April 2021, Nova Scotia has experienced the strongest employment recovery in the country, reflecting increases in professional, scientific and technical services, and educational services.
- Third wave COVID-19 restrictions imposed in late April caused employment to decline by 4.8% in May, as the recovery in total employment slowed to the lowest of all provinces.
- The province also experienced the strongest recovery in manufacturing and wholesale trade sales in Canada, as of March.

Data table for Chart 25
| Indexed employment level during COVID-19 economic shutdown (April 2020) | Indexed employment level during current reference month (May 2021) | |
|---|---|---|
| index (February 2020=100) | ||
| Youth: male | 63.4 | 79.3 |
| Youth: female | 61.7 | 85.5 |
| Core-age: male | 88.9 | 95.7 |
| Core-age: female | 86.5 | 97.5 |
| Older: male | 92.4 | 105.2 |
| Older: female | 82.4 | 92.0 |
|
Notes: Youth: 15 to 24 year-olds; Core-age: 25 to 54 year-olds; Older: 55 year- olds and over. Source: Statistics Canada, table 14-10-0287-01. |
||
Data table for Chart 26
| Retail trade | Manufacturing | Wholesale trade | |
|---|---|---|---|
| February 2020 = 100 | |||
| February | 100.0 | 100.0 | 100.0 |
| March | 89.1 | 103.1 | 98.6 |
| April | 69.2 | 93.2 | 79.8 |
| May | 84.8 | 85.8 | 97.9 |
| June | 101.1 | 102.0 | 106.0 |
| July | 99.8 | 99.9 | 110.1 |
| August | 104.1 | 100.6 | 114.1 |
| September | 103.3 | 113.1 | 109.1 |
| October | 106.3 | 108.3 | 114.0 |
| November | 108.1 | 101.8 | 114.7 |
| December | 101.0 | 106.5 | 119.4 |
| January | 110.1 | 110.0 | 125.1 |
| February | 114.4 | 106.3 | 127.0 |
| March | 115.6 | 132.2 | 131.5 |
|
Note: Pre-COVID-19 level defined as February 2020. Source: Statistics Canada, tables 20-10-0008-01, 20-10-0074-01 and 16-10-0048-01. |
|||
Data table for Chart 27
| Newfoundland and Labrador | Prince Edward Island | Nova Scotia | New Brunswick | |
|---|---|---|---|---|
| February 2020 = 100 | ||||
| February | 100.00000 | 100.00000 | 100.00000 | 100.00000 |
| March | 97.23461 | 96.08802 | 94.38972 | 95.51177 |
| April | 84.52275 | 85.45232 | 83.94004 | 86.28900 |
| May | 87.91258 | 88.38631 | 85.73876 | 90.72250 |
| June | 89.47368 | 90.95355 | 91.39186 | 97.07170 |
| July | 92.41748 | 92.29829 | 92.50535 | 96.63383 |
| August | 94.95986 | 94.62103 | 93.70450 | 96.49699 |
| September | 96.96699 | 93.03178 | 95.93148 | 96.96223 |
| October | 99.68778 | 94.25428 | 96.68094 | 97.83799 |
| November | 101.02587 | 95.59902 | 99.07923 | 98.93268 |
| December | 100.26762 | 94.74328 | 97.40899 | 98.71374 |
| January | 99.06334 | 95.84352 | 99.07923 | 99.01478 |
| February | 92.37288 | 95.23227 | 99.61456 | 98.30323 |
| March | 98.34969 | 96.82152 | 99.95717 | 98.41270 |
| April | 97.81445 | 96.45477 | 99.76445 | 99.53476 |
| May | 96.87779 | 96.82152 | 95.01071 | 98.79584 |
|
Notes: Pre-COVID-19 level defined as February 2020. Source: Statistics Canada, table 14-10-0287-01. |
||||
Prince Edward Island: Largest Atlantic increase in new housing prices since the onset of the pandemic
Pre-COVID-19:
- Real gross domestic product rose by 5.1% in 2019—the largest increase among the provinces.
- Higher output reflected increases in residential building construction and agriculture, along with broad-based gains among services.
- The employment rate was 61.9% at the end of 2019, 0.2 percentage points above the national average.
Post-COVID-19:
- Real gross domestic product declined by 3.0% in 2020, the smallest decrease among the provinces.
- The employment recovery in PEI has been slower than elsewhere in Atlantic Canada.
- PEI has experienced the largest percentage increase in new housing prices of the Atlantic provinces since the onset of the pandemic.
- As of February 2021, the number of active businesses in PEI had reached pre-COVID-19 levels, the strongest net recovery in Atlantic Canada.

Data table for Chart 28
| Indexed employment level during COVID-19 economic shutdown (April 2020) | Indexed employment level during current reference month (May 2021) | |
|---|---|---|
| index (February 2020=100) | ||
| Youth: male | 72.5 | 92.8 |
| Youth: female | 67.2 | 89.1 |
| Core-age: male | 90.3 | 100.8 |
| Core-age: female | 86.1 | 96.3 |
| Older: male | 95.3 | 101.9 |
| Older: female | 82.3 | 89.6 |
|
Notes: Youth: 15 to 24 year-olds; Core-age: 25 to 54 year-olds; Older: 55 year- olds and over. Source: Statistics Canada, table 14-10-0287-01. |
||
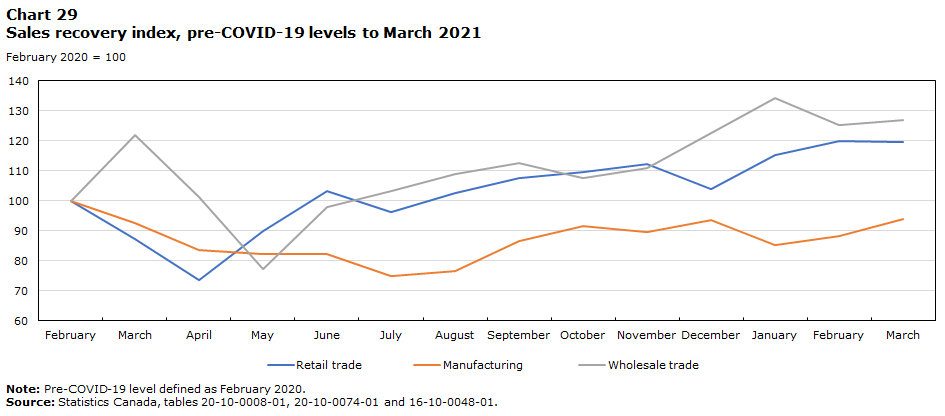
Data table for Chart 29
| Retail trade | Manufacturing | Wholesale trade | |
|---|---|---|---|
| February 2020 = 100 | |||
| February | 100.0 | 100.0 | 100.0 |
| March | 87.2 | 92.6 | 121.8 |
| April | 73.7 | 83.7 | 101.3 |
| May | 90.0 | 82.1 | 77.3 |
| June | 103.1 | 82.3 | 97.8 |
| July | 96.2 | 75.1 | 103.1 |
| August | 102.6 | 76.5 | 108.9 |
| September | 107.5 | 86.5 | 112.6 |
| October | 109.5 | 91.5 | 107.4 |
| November | 112.2 | 89.4 | 110.7 |
| December | 104.1 | 93.4 | 122.5 |
| January | 115.3 | 85.1 | 134.3 |
| February | 119.8 | 88.3 | 125.4 |
| March | 119.5 | 93.9 | 127.0 |
|
Note: Pre-COVID-19 level defined as February 2020. Source: Statistics Canada, tables 20-10-0008-01, 20-10-0074-01 and 16-10-0048-01. |
|||

Data table for Chart 30
| Newfoundland and Labrador | Prince Edward Island | Nova Scotia | New Brunswick | |
|---|---|---|---|---|
| February 2020 = 100 | ||||
| February | 100.0 | 100.0 | 100.0 | 100.0 |
| March | 99.8 | 100.0 | 100.2 | 100.3 |
| April | 99.8 | 100.0 | 100.3 | 100.5 |
| May | 99.8 | 100.6 | 100.8 | 100.5 |
| June | 99.8 | 100.6 | 101.3 | 100.5 |
| July | 99.5 | 100.6 | 101.7 | 100.5 |
| August | 99.5 | 100.6 | 103.4 | 100.5 |
| September | 100.6 | 102.6 | 104.2 | 101.5 |
| October | 102.7 | 102.6 | 105.5 | 101.5 |
| November | 103.2 | 104.4 | 106.3 | 101.5 |
| December | 103.4 | 104.4 | 106.3 | 101.5 |
| January | 103.4 | 107.8 | 106.3 | 101.5 |
| February | 103.4 | 108.0 | 108.8 | 102.7 |
| March | 104.2 | 111.7 | 109.8 | 105.6 |
| April | 104.8 | 112.9 | 112.0 | 107.3 |
|
Note: Pre-COVID-19 level defined as February 2020. Source: Statistics Canada, table 18-10-0205-01. |
||||
Newfoundland and Labrador: Youth employment rebounds while the recovery in manufacturing and active businesses lags
Pre-COVID-19:
- Newfoundland and Labrador’s economy grew by 4.0% in 2019, reflecting increases in oil and gas extraction and construction.
- Despite higher output, total employment edged down in 2019, as the employment rate ended the year at 50.0%.
Post-COVID-19:
- Real gross domestic product fell by 5.3% in 2020.
- The recovery in youth employment was among the strongest in the country.
- The recovery in manufacturing sales lags that in the rest of the country, as does the recovery in the number of active businesses.

Data table for Chart 31
[an error occurred while processing this directive]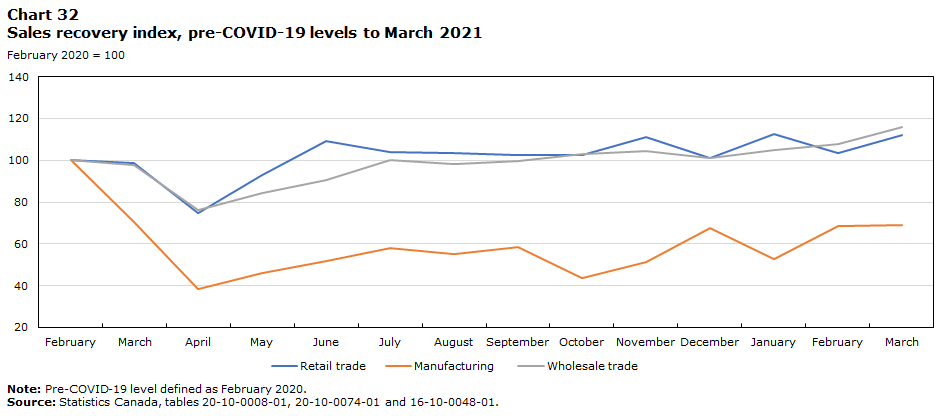
Data table for Chart 32
| Retail trade | Manufacturing | Wholesale trade | |
|---|---|---|---|
| February 2020 = 100 | |||
| February | 100.0 | 100.0 | 100.0 |
| March | 98.8 | 70.5 | 97.7 |
| April | 74.6 | 38.4 | 76.2 |
| May | 92.8 | 46.2 | 84.3 |
| June | 109.1 | 51.9 | 90.5 |
| July | 103.8 | 58.0 | 100.2 |
| August | 103.6 | 55.1 | 98.1 |
| September | 102.7 | 58.7 | 99.6 |
| October | 102.3 | 43.5 | 102.9 |
| November | 111.1 | 51.5 | 104.3 |
| December | 100.8 | 67.6 | 100.9 |
| January | 112.8 | 52.8 | 104.9 |
| February | 103.5 | 68.7 | 107.9 |
| March | 112.3 | 69.1 | 116.0 |
|
Note: Pre-COVID-19 level defined as February 2020. Source: Statistics Canada, tables 20-10-0008-01, 20-10-0074-01 and 16-10-0048-01. |
|||
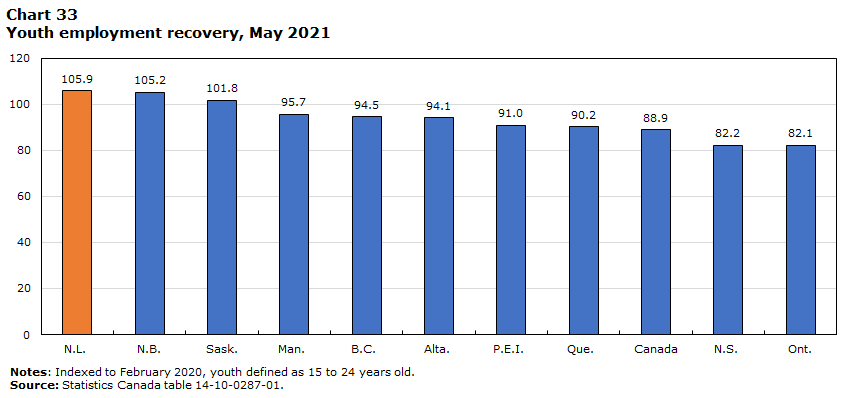
Data table for Chart 33
| Province | Youth Employment Recovery |
|---|---|
| N.L. | 105.9 |
| N.B. | 105.2 |
| Sask. | 101.8 |
| Man. | 95.7 |
| B.C. | 94.5 |
| Alta. | 94.1 |
| P.E.I. | 91.0 |
| Que. | 90.2 |
| Canada | 88.9 |
| N.S. | 82.2 |
| Ont. | 82.1 |
|
Notes: Indexed to February 2020, youth defined as 15 to 24 years old. Source: Statistics Canada table 14-10-0287-01. |
|
The territories: Impacts of resource extraction vary as businesses remain resilient
Pre-COVID-19:
- Yukon‘s real gross domestic product grew by 0.7% in 2019, as gains from real estate and other services offset lower wholesale activity.
- Real GDP in the Northwest Territories contracted by 8.1% in 2019 due to sharp declines mining and engineering construction.
- Nunavut’s economy grew for the fourth consecutive year, as real GDP rose by 6.5% on the strength of higher mining output.
Post-COVID-19:
- Businesses remained resilient—as of February 2021, the number of active businesses in Yukon and Nunavut exceeded pre-COVID-19 levels, while the number operating in the Northwest Territories was 1% below levels reported in February 2020.
- Public and private capital intentions for 2021, at $2.5 billion, are 9% higher than spending levels in 2020, but still down about 13% from pre-COVID-19 levels reported in 2019.
- Employment in the North was less impacted by the initial economic shutdowns. As of May 2021, employment in the Northwest Territories was above pre-COVID-19 levels. Employment levels in the Yukon have remained stable, while levels in Nunavut have shown signs of recovery.
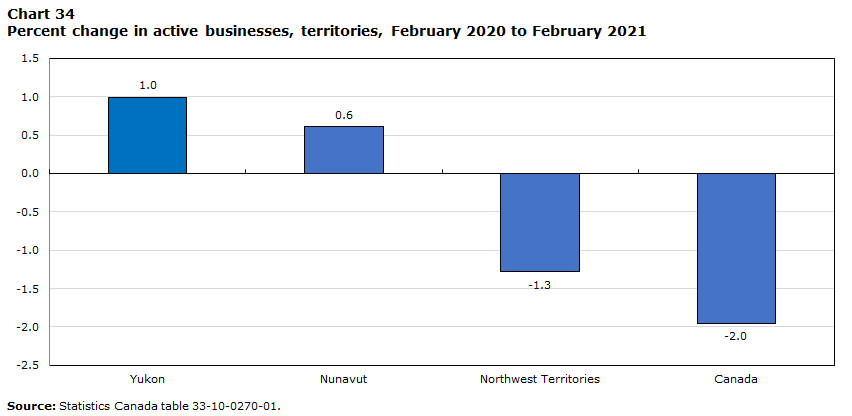
Data table for Chart 34
| Percent change | |
|---|---|
| Yukon | 1.0 |
| Nunavut | 0.6 |
| Northwest Territories | -1.3 |
| Canada | -2.0 |
| Source: Statistics Canada table 33-10-0270-01. | |

Data table for Chart 35
| Yukon | Northwest Territories | Nunavut | |
|---|---|---|---|
| February 2020 = 100 | |||
| February | 100.0 | 100.0 | 100.0 |
| March | 99.6 | 100.0 | 100.8 |
| April | 97.8 | 96.9 | 91.4 |
| May | 93.9 | 96.9 | 85.9 |
| June | 92.1 | 93.8 | 85.9 |
| July | 92.1 | 93.3 | 92.2 |
| August | 91.7 | 92.0 | 94.5 |
| September | 91.7 | 92.9 | 95.3 |
| October | 93.4 | 96.0 | 96.1 |
| November | 96.5 | 99.1 | 96.1 |
| December | 96.5 | 100.9 | 95.3 |
| January | 95.6 | 101.8 | 94.5 |
| February | 96.5 | 102.7 | 95.3 |
| March | 97.4 | 104.0 | 95.3 |
| April | 97.8 | 104.5 | 94.5 |
| May | 96.5 | 106.7 | 93.0 |
|
Note: Pre-COVID-19 defined as February 2020. Source: Statistics Canada, tables 14-10-0292-01. |
|||
- Date modified: