
EnviroStats
Impact of the January snowstorm in northeast Avalon Peninsula, Newfoundland and Labrador, 2020
Skip to text
Text begins
The northeast Avalon Peninsula experienced a record snowfall and strong winds during the weekend of January 17, 2020, that prompted officials to declare a state of emergency for the St. John's area. Environment and Climate Change Canada reported that the city of Mount Pearl received 93 cm of snow, and the town of Paradise received 91 cm. Over 208,000 individuals living in 86,000 private dwellings in the area of the northeast Avalon Peninsula and Bell Island were affected, covering a total land area of 1,136 square kilometres and affecting approximately 1,957 kilometres of roads.
Statistics Canada worked with federal departments and the provincial government of Newfoundland and Labrador to assess what statistical information was needed for emergency preparedness and response. Statistics Canada provided a statistical portrait of the populations living in the areas most affected by the snowstorm. This is part of ongoing efforts to improve emergency management in Canada through better data.
The government of Newfoundland and Labrador provided Statistics Canada with a map showing the area that was most affected. With this geospatial information, the agency was able to produce geo-enabled socioeconomic statistics for 334 dissemination areas across 16 municipalities within hours of the declaration of the state of emergency. About half of the dissemination areas are located in the St. John's census subdivision, corresponding to the city of St. John's.
Seniors and people living alone may be more at risk after a major snowstorm
In emergency situations, seniors and people living alone can be particularly at risk—especially if they lack the social network or support to receive the help that they need. Seniors who are living alone may be even more at risk, especially if health or mobility issues restrict their ability to move in and out of their homes. In the northeast Avalon Peninsula, seniors accounted for approximately 15% of the overall population.
Over 22,200 people live alone in the northeast Avalon Peninsula, representing 11% of the overall population. Among those living alone, about one-third were seniors.
In the city of St. John's, which accounts for over half of the total area's population, 17% of the population was aged 65 and older, while 14% were living in a one-person household.
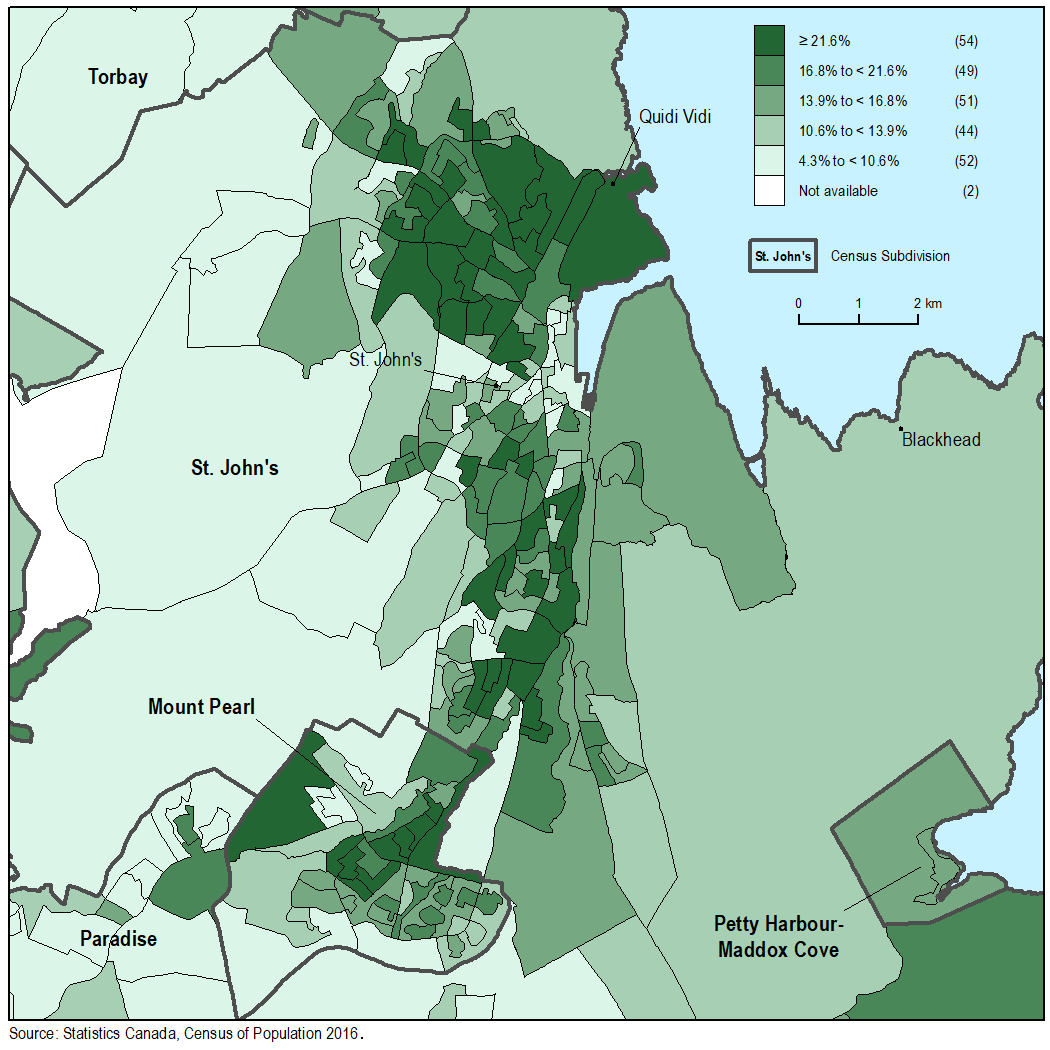
Map 1 illustrates the areas that had the highest concentration of seniors as a proportion of the total population, while Map 3 shows the areas with the highest concentration of people living alone. The vast majority of dissemination areas with the most seniors were located in the city of St. John's, in Mount Pearl and on Bell Island.
Within the city of St. John's, the areas with the highest proportion of seniors included a cluster of dissemination areas located to the north of the downtown core, including neighbourhoods in the Quidi Vidi area. In Mount Pearl, the areas with a large concentration of seniors were generally close to the city centre (Map 2).
The city of St. John's also had a large number of dissemination areas with a high concentration of people living alone. Almost all dissemination areas with the highest concentration of one-person households were located in the city of St. John's (58 out of 64), and the vast majority were located in the downtown core of St. John's and in the Quidi Vidi area (Map 4).

Description for Map 1
The title of the map is "Percentage of the population aged 65 and older in the northeast Avalon Peninsula, by dissemination area"
This is a map showing the population aged 65 and older in 2016, in percent, by dissemination area for the northeast Avalon Peninsula.
Dissemination areas are outlined with a thin black line while census subdivisions are outlined with a thick dark grey line and labelled in bold black text. A selection of place names are shown by black points and labelled in regular black text.
The legend shows a range of colours for dissemination areas: Not available in white
4.3% to less than 10.6% in light green
10.6% to less than 13.9% in medium light green
13.9% to less than 16.8% in medium green
16.8% to less than 21.6% in medium dark green
Greater than or equal to 21.6% in dark green
Source: Statistics Canada, Census of Population, 2016.
Description for Map 2
The title of the map is "Percentage of the population aged 65 and older in St. John's, by dissemination area"
This is a map showing the population aged 65 and older in 2016, in percent, by dissemination area for the area of St. John's.
Dissemination areas are outlined with a thin black line while census subdivisions are outlined with a thick dark grey line and labelled in bold black text. A selection of place names are shown by black points and labelled in regular black text.
The legend shows a range of colours for dissemination areas:
Not available in white
4.3% to less than 10.6% in light green
10.6% to less than 13.9% in medium light green
13.9% to less than 16.8% in medium green
16.8% to less than 21.6% in medium dark green
Greater than or equal to 21.6% in dark green
Source: Statistics Canada, Census of Population, 2016.

Description for Map 3
The title of the map is "Percentage of the population living alone in the northeast Avalon Peninsula, by dissemination area"
This is a map showing the population living alone in 2016, in percent, by dissemination area for the northeast Avalon Peninsula.
Dissemination areas are outlined with a thin black line while census subdivisions are outlined with a thick dark grey line and labelled in bold black text. A selection of place names are shown by black points and labelled in regular black text.
The legend shows a range of colours for dissemination areas:
Not available in white
2.0% to less than 6.4% in light red
6.4% to less than 8.5% in medium light red
8.5% to less than 11.5% in medium red
11.5% to less than 15.6% in medium dark red
Greater than or equal to 15.6% in dark red
Source: Statistics Canada, Census of Population, 2016.

Description for Map 4
The title of the map is "Percentage of the population living alone in St. John's, by dissemination area"
This is a map showing the population living alone in 2016, in percent, by dissemination area for the area of St. John's.
Dissemination areas are outlined with a thin black line while census subdivisions are outlined with a thick dark grey line and labelled in bold black text. A selection of place names are shown by black points and labelled in regular black text.
The legend shows a range of colours for dissemination areas:
Not available in white
2.0% to less than 6.4% in light red
6.4% to less than 8.5% in medium light red
8.5% to less than 11.5% in medium red
11.5% to less than 15.6% in medium dark red
Greater than or equal to 15.6% in dark red
Source: Statistics Canada, Census of Population, 2016.
Dwelling conditions can also represent a risk factor
Dwelling conditions represent another important risk factor in a major snowstorm event. Aging dwellings and dwellings in need of major repairs can represent an increased safety hazard in an emergency situation. Furthermore, the risk may increase if more snow falls in the region.
In the northeast Avalon Peninsula, 4% of private occupied dwellings (representing more than 3,700 dwellings) were in need of major repairs (Map 5). Dwellings requiring major repairs include those with defective plumbing or electrical wiring, as well as those requiring structural repairs. In addition, about 17% of private dwellings in the northeast Avalon Peninsula were built in 1960 or earlier.
A cluster of dissemination areas with a high concentration of dwellings in need of major repairs was located in the centre of St. John's (Map 6). Several dissemination areas on Bell Island (Wabana), as well as the coastal communities in Pouch Cove and Logy Bay–Middle Cove–Outer Cove, also had high rates of dwellings in need of major repairs.

Description for Map 5
The title of the map is "Percentage of occupied private dwellings in need of major repairs in the northeast Avalon Peninsula, by dissemination area"
This is a map showing the percentage of occupied private dwellings in need of major repairs in 2016, in percent, by dissemination area for the northeast Avalon Peninsula.
Dissemination areas are outlined with a thin black line while census subdivisions are outlined with a thick dark grey line and labelled in bold black text. A selection of place names are shown by black points and labelled in regular black text.
The legend shows a range of colours for dissemination areas:
Not available in white
0% in light grey
Greater than 0% to less than 4.5% in light yellow
4.5% to less than 6.4% in light orange
6.4% to less than 9.0% in orange
Greater than or equal to 9.0% in brown
Source: Statistics Canada, Census of Population, 2016.

Description for Map 6
The title of the map is "Percentage of occupied private dwellings in need of major repairs in St. John's, by dissemination area"
This is a map showing the percentage of occupied private dwellings in need of major repairs in 2016, in percent, by dissemination area for the area of St. John's.
Dissemination areas are outlined with a thin black line while census subdivisions are outlined with a thick dark grey line and labelled in bold black text. A selection of place names are shown by black points and labelled in regular black text.
The legend shows a range of colours for dissemination areas:
Not available in white
0% in light grey
Greater than 0% to less than 4.5% in light yellow
4.5% to less than 6.4% in light orange
6.4% to less than 9.0% in orange
Greater than or equal to 9.0% in brown
Source: Statistics Canada, Census of Population, 2016.
Residential instability index higher in the downtown core of St. John's
Statistics Canada has also developed an index of residential instability, which speaks to the tendency for the number of inhabitants to fluctuate over time. The residential instability index is part of a larger program to identify areas that may be more at risk of deprivation and marginalization.
This index is primarily based on housing and family characteristics, such as the number of people who have moved in the past five years, live alone and live in rental units. The index, shown in Map 7, can help identify areas that may be more vulnerable or less responsive to emergency interventions.
The dissemination areas characterized by the highest level of residential instability were almost all located in the city of St. John's, and were primarily located in the downtown core (Map 8).
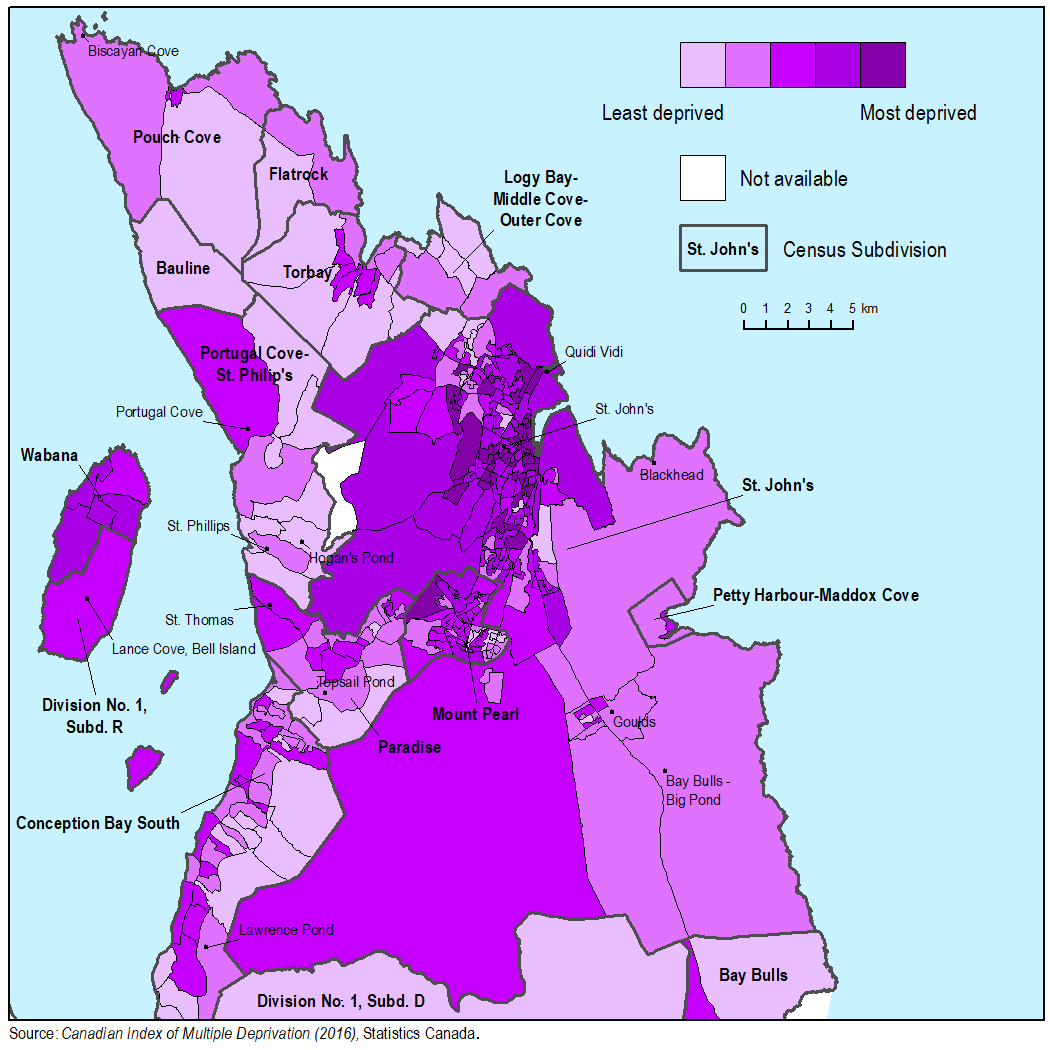
Description for Map 7
The title of the map is "Residential instability in the northeast Avalon Peninsula, by dissemination area"
This is a map showing residential instability, by dissemination area for the northeast Avalon Peninsula.
Dissemination areas are outlined with a thin black line while census subdivisions are outlined with a thick dark grey line and labelled in bold black text. A selection of place names are shown by black points and labelled in regular black text.
The legend shows a scale of deprivation for dissemination areas, shaded light purple (least deprived) to dark purple (most deprived).
Source: Canadian Index of Multiple Deprivation (2016), Statistics Canada.

Description for Map 8
The title of the map is "Residential instability in St. John's, by dissemination area"
This is a map showing residential instability, by dissemination area for the area of St. John's.
Dissemination areas are outlined with a thin black line while census subdivisions are outlined with a thick dark grey line and labelled in bold black text. A selection of place names are shown by black points and labelled in regular black text.
The legend shows a scale of deprivation for dissemination areas, shaded light purple (least deprived) to dark purple (most deprived).
Source: Canadian Index of Multiple Deprivation (2016), Statistics Canada.
| Dissemination areas | Approximate road length | Land area | |
|---|---|---|---|
| number | km | km2 | |
| Total | 334 | 1,957 | 1,136 |
| Census subdivisions | |||
| Bauline | 1 | 12 | 16 |
| Bay Bulls | 2 | 33 | 31 |
| Conception Bay South | 39 | 230 | 59 |
| Division No. 1, Subd. D | 2 | 86 | 299 |
| Division No. 1, Subd. R | 1 | 29 | 17 |
| Flatrock | 2 | 37 | 18 |
| Logy Bay–Middle Cove–Outer Cove | 4 | 43 | 17 |
| Mount Pearl | 44 | 132 | 16 |
| Paradise | 21 | 148 | 30 |
| Petty Harbour–Maddox Cove | 2 | 12 | 5 |
| Portugal Cove–St. Philip's | 10 | 113 | 57 |
| Pouch Cove | 3 | 43 | 58 |
| St. John's | 185 | 824 | 446 |
| Torbay | 11 | 101 | 35 |
| Wabana | 5 | 77 | 15 |
| Witless Bay | 3 | 36 | 17 |
| Source(s): Statistics Canada, 2016 Census of Population. | |||
| Population (100% data) | Occupied private dwellings (25% sample data) | |||||
|---|---|---|---|---|---|---|
| Total | People aged 65 and older | People living alone | Total | With major repairs needed | Constructed in 1960 or earlier | |
| number | percent | number | percent | |||
| Total | 208,511 | 15.0 | 10.8 | 86,235 | 4.3 | 16.5 |
| Census subdivisions | ||||||
| Bauline | 452 | 14.4 | 4.4 | 165 | 6.1 | 21.2 |
| Bay Bulls | 1,500 | 15.0 | 6.7 | 565 | 8.8 | 15.0 |
| Conception Bay South | 26,199 | 14.0 | 6.8 | 9,930 | 2.8 | 8.0 |
| Division No. 1, Subd. D | 88 | 22.2 | 11.1 | 55 | 18.2 | 18.2 |
| Division No. 1, Subd. R | 322 | 33.8 | 20.3 | 140 | 0.0 | 35.7 |
| Flatrock | 1,683 | 8.9 | 4.8 | 605 | 2.5 | 8.3 |
| Logy Bay–Middle Cove–Outer Cove | 2,221 | 16.0 | 5.4 | 795 | 2.5 | 8.2 |
| Mount Pearl | 22,957 | 16.8 | 9.9 | 9,605 | 3.9 | 5.5 |
| Paradise | 21,389 | 8.2 | 6.7 | 8,040 | 2.2 | 2.2 |
| Petty Harbour–Maddox Cove | 960 | 16.1 | 7.8 | 370 | 0.0 | 24.3 |
| Portugal Cove–St. Philip's | 8,147 | 12.6 | 5.8 | 3,015 | 6.0 | 10.4 |
| Pouch Cove | 2,069 | 14.5 | 8.0 | 820 | 8.5 | 19.5 |
| St. John's | 108,860 | 16.5 | 13.7 | 47,640 | 4.7 | 23.1 |
| Torbay | 7,899 | 10.3 | 6.0 | 2,875 | 4.2 | 7.3 |
| Wabana | 2,146 | 23.5 | 17.3 | 1,025 | 13.2 | 62.9 |
| Witless Bay | 1,619 | 14.2 | 6.7 | 590 | 7.6 | 7.6 |
| Source(s): Statistics Canada, 2016 Census of Population. | ||||||
Note to readers
The residential instability index is part of the Canadian Index of Multiple Deprivation, which allows communities across the country to be compared on four dimensions of deprivation and marginalization: residential instability, economic dependency, ethnocultural composition and situational vulnerability.
Residential instability speaks to the tendency of a neighbourhood's inhabitants to fluctuate over time, taking into consideration both housing and family characteristics. The Canadian Index of Multiple Deprivation and a user guide for the index are available.
This analysis is based on the 2016 Census dissemination areas that are included in the St. John's census metropolitan area and the communities of Bell Island. A dissemination area is a small, relatively stable geographic unit, and the smallest standard geographic area for which all census data are disseminated. Dissemination areas are uniform in terms of population size, targeted to range from 400 to 700 people to avoid data suppression. Dissemination areas can be aggregated at the census subdivision level. In this study, the 334 dissemination areas can be aggregated into 16 census subdivisions, which are listed in Table 1. A census subdivision normally corresponds to a municipality or an area that is deemed to be equivalent to a municipality for statistical reporting purposes.
- Date modified: