
Environment Accounts and Statistics Analytical and Technical Paper Series
Ecosystem accounting in Canadian agroecosystems
Skip to text
Text begins
1. Introduction
The new Census of Environment (CoE) informs Canadians about the importance of ecosystems in Canada. A main component of the CoE is the development of accounts to help track changes in ecosystems and the services they provide over time, based on the United Nations System of Environmental Economic Accounting - Ecosystem Accounting (SEEA EA) framework (United Nations et al., 2021).
The SEEA EA provides a structured approach to value the vital contributions of ecosystems to our economy and well-being and to highlight our use and dependence on these contributions. The framework applies national accounting principles to allow for the integration of environmental and economic data in a comprehensive, systematic and comparable manner.
The SEEA EA provides guidance on the development of ecosystem extent, condition and services accounts. Ecosystem extent accounts delineate ecosystem types and track changes in their areas through time. Condition accounts track changes in key ecosystem processes. Finally, ecosystem service accounts quantify the biophysical and monetary value of ecosystem contributions to our economy and well-being (United Nations et al., 2021).
The information contained in all three ecosystem accounts is interlinked. Conceptually, the extent and condition of ecosystems influence the flow of ecosystem services. The use of ecosystem services can also impact ecosystem condition. Practically, measuring and modeling ecosystem condition and services relies heavily on the spatial information in the extent account.
The information contained in ecosystem accounts will serve several purposes. It will allow policy makers to make evidence-based decisions about the well-being of Canadians and their environment, including on decisions related to land-use planning and ecosystem restoration. It will also help track Canada’s performance towards meeting international goals to protect the planet and achieve a more sustainable future. By placing an emphasis on the value of the natural environment and its foundational role for society, the accounts will support analysis of benefits and trade-offs between the economy and environment.
Agroecosystems are a key ecosystem type. These ecosystems cover a significant portion of Canada’s modified landscapes, provide habitat for many species, provide food for domestic consumption and export, support the livelihoods of farm operators and workers, and play a considerable role in maintaining the well-being of rural communities. On the other hand, agroecosystems can affect neighbouring ecosystems through nutrient runoff and pesticide drift while expansion of agroecosystems can cause habitat fragmentation and deforestation. Agroecosystems are also characterized by the fact that they are managed ecosystems. Consequently, farm operators and land managers play a direct role in influencing their extent, condition and service provision through the farm management practices applied.
This publication presents an ecosystem accounting framework to assess Canada’s agroecosystems and the ecosystem services they provide. It will be used to engage with stakeholders—including Agriculture and Agri-Food Canada (AAFC), Indigenous groups, other departments, agricultural experts and others—about needs, methods and uses of new data. As the accounts are developed, data sources and analytical methods will be continually refined.
Data for the agroecosystem accounts is updated every five years; however, it may be possible to produce annual accounts in the future as data and methods evolve. The development of pilot agroecosystem accounts will reflect the knowledge and data gaps described in this paper and will be built progressively over time, as data become available.
This technical paper outlines data sources relevant for measuring agroecosystem extent and describe the agroecosystem condition and ecosystem services accounts. Each section outlines proposed variables, metrics, data sources and methods while acknowledging current challenges and limitations. The paper provides a foundation for the development of agroecosystem accounts and will serve as guidance for the further development of accounts for other ecosystems as part of the CoE.
Start of text box
What are agroecosystems?
Agroecosystems are complex mosaics of annual and perennial cropland, pastures and semi-natural habitat that are managed for multiple uses and functions (food provision, livelihood, recreation, education, habitat, biodiversity, carbon storage, etc.). Although agroecosystems are often viewed through the lens of crop cultivation and livestock production, these ecosystems are important sources of food, shelter and habitat for the many species that deliver essential ecosystem services to farm operators and society (such as pest control and pollination; Swinton et al., 2007).
In agroecosystems, important ecological variables that can influence ecosystem conditions and services include climate, soil type, soil properties (e.g., structure, nutrient content, etc.), length of growing season, above- and below-ground species diversity and community composition. Important land management variables include crop type, crop diversity, crop rotation, tillage, seeding date, irrigation, fertilization (type and frequency), pesticide application (type and frequency) and nature-based solutions such as promoting natural habitat within the landscape and increasing habitat connectivity (Vandermeer, 2009).
Agroecosystem classes include intensive land use classes and semi-natural land classes such as grasslands and are covered in the International Union for Conservation of Nature Global Ecosystem Typology (Version 2.0, Keith et al., 2020), which is the reference classification for ecosystem types in the SEEA EA. The SEEA Central Framework land-use classification is also relevant for reporting on agricultural land cover and land use, and there are important conceptual overlaps between these classifications and available data. For the agroecosystem accounts described in this paper, the classifications have been adapted and are presented below with their associated land use classes:
Annual croplands: Systems dominated by one or a few shallow-rooted annual plant species.
- Includes areas with grains, silage corn, grain corn, pulses, oilseeds, seeds, hemp, tobacco, vegetables, non-woody fruits, summerfallow, and nursery plants, sod and cut flowers (field production).
Perennial croplands: Systems dominated by fruit and nut trees or shrubs.
- Includes areas with orchards, vineyards, blueberries, raspberries and cranberries.
Sown pasture and forage areas: Systems dominated by one or a few perennial pasture grasses or herbaceous legumes, used for forage production and grazing animals for commercial production. Land management can include seeding, draining, irrigation, fertilizer application or weed control.
- Includes areas with tame or seeded pasture, hay and forage crops.
Semi-natural pastures: Systems dominated by native grasses and forbs, sometimes including shrubs, used for grazing animal species.
- Includes natural pasture and rangeland areas.
Field edge vegetation: Small areas (less than 0.5 haNote ) of native, planted or ruderal trees, shrubs and herbaceous plants, growing along or near field borders.
- Includes shelterbelts, windbreaks, hedgerows, field margins, woodlots, riparian buffers and pivot corners.
It should be noted that greenhouses, community and residential gardens are not included in this paper’s definition of agroecosystems. The former will be included in the accounts for built up areas. Wetlands are also excluded and will be included in separate wetland accounts.
End of text box
Figure 1
Depiction of the five agroecosystem types with description of the three types of agroecosystem accounts

Description for Figure 1
The title of the figure is “Depiction of the five agroecosystem types with description of the three types of agroecosystem accounts.” This figure is composed of a single large image with three numbered text boxes below explaining the key agroecosystem accounts.
The image shows five types of agroecosystems and their key components, featuring a diverse agricultural landscape of a farm and its surroundings. The farm is presented as a hub for various agricultural activities. On the left side of the image there are rows of corn plants and a barn with silos. In the center of the figure, there is a cultivated field next to a pasture where a few cows are grazing. In the distance beyond the farm, green hills dominate the horizon, with two deer grazing on the plain. There is a line of trees along the edges of the fields. In the front right corner there is an orchard with a few fruit bearing trees and some birds.
At the bottom of this figure there are three numbered boxes with the text:
- Extent: The extent account tracks change in the area covered by different ecosystems. Different types of agroecosystems are delineated and measured repeatedly over time to understand changes in extent.
- Condition: The condition account compiles information about the health of ecosystems. For agroecosystems, that means tracking characteristics such soil erosion rates and biodiversity.
- Ecosystem services: The service account compiles information on the contributions of agroecosystems to our well-being and economy. Agroecosystems provide food, education and recreation opportunities, among other services.
2. Extent
Ecosystem extent accounts record the area and track changes in the size of ecosystem assets. In these accounts, agroecosystems are delineated, and changes in their extents are reported over time. The spatially explicit data within extent accounts also serve as the foundation for the development of ecosystem condition and service accounts. Several Canadian datasets provide detailed information on land cover and use in Canada’s agricultural regions, each with their own advantages and limitations for use in ecosystem accounting.
Statistics Canada’s Census of Agriculture (CEAG) collects data on crops, livestock and other related variables every five years (Statistics Canada, 2022a). Reported areas of annual and perennial crops and natural and tame or seeded pasture are aggregated and published by standard CEAG geographies.Note In addition, a new Agri-Environmental Spatial Data (AESD) product provides CEAG estimates for ecological and hydrological geographies (Statistics Canada, 2022b). This new product uses the Annual Space-Based Crop Inventory (ACI) and crop insurance datasets to allocate data for certain variables based on their actual geographic location, rather than farm headquarters location, producing crop area estimates better suited for ecosystem accounting.
Another important data source for agroecosystem accounting is satellite-based Earth observations. Since 2011, Agriculture and Agri-Food Canada (AAFC) has produced the ACI, created from satellite imagery collected at a 30 m resolution (AAFC, 2021a). The dataset, covering all of Canada’s agricultural regions, has an overall classification accuracy of 85% for agricultural cover types and is published annually.
Unfortunately, estimating crop areas by counting pixels in the ACI produces biased estimates. Misclassifications between certain crop types and land classes in the ACI occur where the spectral characteristics of different crops cannot easily be separated. The ACI also tends to overestimate certain annual crop areas because they are overrepresented in its training data (Davidson et al., 2017). In some cases, the ACI also overestimates agricultural land because small areas of other land occurring within the agricultural landscape are not detected. Overall, these issues lead to an overestimation of annual crop areas and an underestimation of perennial crop areas. Treed and shrubbed pastures are not included as a class in the ACI, also leading to an underestimation of pasture area. These classification errors can vary by region and year, adding to interregional and interannual variability in estimates. Difficulties in distinguishing crop types also leads to some crops being classed as “other crops” or “undifferentiated agriculture,” making it difficult to assign an agroecosystem type to these classes.
Data from the AESD will be used to estimate crop areas in the agroecosystem extent account until adjustments can be made to the ACI to reduce the bias associated with pixel counting (Map 1). The area estimates of crops derived from the ACI and AESD datasets are provided in Table 1 for reference. Differences in calculated areas are due to the characteristics of the datasets discussed in the previous paragraphs.
Despite the limitations of the ACI, the dataset is useful since it provides detailed spatial and temporal crop data at a spatial resolution suitable for field-level assessment (Map 2). Its ability to provide information regarding compositional and configurational characteristics of the agricultural landscape across multiple nested spatial scales is especially needed for modelling certain agroecosystem condition and service variables. For these reasons, the ACI will continue to be used to produce maps of agroecosystem extent and to model agroecosystem condition and service variables that require spatial information.
In the future, new satellite data streams and improvements in statistical methods for areal calculation will ideally allow for the ACI to be the foundational dataset for the agroecosystem extent account. Different statistical adjustments to the ACI are currently being considered. The use of moving averages to reduce noise in year-to-year classifications is one adjustment being considered, but it would not resolve the misclassification issues related to biased training data. Supplementary data sources (i.e., the AAFC Land Use Time Series) may also be leveraged to provide additional information on certain land cover classes (AAFC, 2021b). A statistical technique known as the regression estimator can also be applied to reduce bias in the ACI-derived estimates of crop area. This approach uses high-accuracy local crop maps to derive regression coefficients that improve the accuracy of the ACI-derived crop areas (Davidson et al., 2017). Ongoing research on these approaches will allow iterative improvements in the accuracy and consistency of the agroecosystem extent account to be made.
Another challenging yet important aspect of agroecosystem accounting relates to distinguishing sown pasture and forage areas from semi-natural pasture and rangeland. Semi-natural pastures with native grasses form part of temperate grassland ecosystems that are essential for the maintenance of biodiversity and ecosystem services. However, grassland ecosystems are in decline in Canada, mainly because of the conversion of land to annual crops or urban land (Tamburini et al., 2022; Bardgett et al., 2021). The ACI includes a pasture and forages class, which groups together all tame grasses and perennial crops grown for hay, pasture or seed. The ACI also includes a grassland class, though it does not differentiate between natural grassland used for pasture and unmanaged grassland that is not used in farming, a distinction that is mostly relevant in the Prairies and British Columbia. Given the difficulties in distinguishing hay, tame or seeded pastures and natural pastures with the ACI, the agroecosystem types will be grouped together in the pilot agroecosystem extent account. In the future, a Canadian Grassland Inventory— being developed jointly by ECCC and AAFC under the Agricultural Climate Solutions (ACS) component of the Government of Canada’s Nature-Based Climate Solutions Fund (NCSF)—will allow the extent of grassland, pastures and hay to be mapped across Canada with improved detail and accuracy.
Field edge vegetation in agroecosystems is also an important but challenging agroecosystem type to account for. This class is limited to small patches of vegetation (less than 0.5 haNote ) or linear features along or near the borders of agricultural fields. Most forms of vegetation that fit these criteria, such as shelterbelts or windbreaks, are linear with a width of less than 10 m, making them difficult to delineate using land cover datasets with a resolution of 30 m. AAFC and ECCC are currently exploring methods to map woody biomass along field edges in agroecosystems using Earth observation, which may provide an additional source of data for this condition variable (J. Le Moullec, personal communication, 2023). As finer resolution datasets such as these become available in the future, it will be possible to delineate these lands with greater detail and accuracy.
Map 1
Canadian agroecosystem extent, 2021, based on Census of Agriculture data

Description for Map 1
The title of this map is “Canadian agroecosystem extent, 2021, based on Census of Agriculture data”. This map provides a visual representation of the extent of agroecosystems in Canada. These data were produced using the Agri-Environmental Spatial Data for 2021.
On the page, there is one large map of Canada and a legend to the upper right. The map delineates ecoprovinces with a thin black boundary line. Areas outside the agricultural ecumene are in grey. On the map, the percentage of agroecosystem area per ecoprovince is illustrated using five different colours.
In the map legend, the agroecosystem area percentages are categorized as 0 to less than 3 in yellow, 3 to less than 8 percent in light orange, 8 to less than 20 precent in dark orange, 20 to less than 60 percent in light brown and 60 to less than 90 precent in dark brown.
The map shows that agroecosystems occur mostly in the south of Canada. The highest concentrations of agroecosystems are in the Prairies, and southern Quebec and Ontario.
Source: Statistics Canada, 2022, Census of Agriculture: Agri-Environmental Spatial Data (AESD) [Data set]. Retrieved December 14th,2022, from https://open.canada.ca/data/en/dataset/83096e57-6584-4a8c-9854-59a49e57fb28/
| Colour | Percent agroecosystem area |
|---|---|
| Light yellow | 0 to < 3 |
| Light orange | 3 to < 8 |
| Dark orange | 8 to < 20 |
| Light brown | 20 to < 60 |
| Dark brown | 60 to < 90 |
| Grey | Outside agricultural ecumene |
| Shape | Boundary |
| polygon | Ecoprovince |
| Ecoprovince | Percent area |
|---|---|
| Appalachian–Acadian Highlands | 4.94 |
| Boreal Foothills | 3.70 |
| Central Boreal Plains | 19.12 |
| Central Grassland | 85.75 |
| Central Montane Cordillera | 3.93 |
| Columbia Montane Cordillera | 1.06 |
| Eastern Boreal Plains | 6.95 |
| Eastern Boreal Shield | 0.41 |
| Eastern Prairies | 67.11 |
| Fundy Uplands | 2.75 |
| Georgia Depression | 5.63 |
| Great Lakes–St. Lawrence Lowlands | 40.77 |
| Hay–Slave Lowlands | 0.02 |
| Huron–Erie Plains | 58.90 |
| Lake of the Woods | 2.40 |
| Mid-Boreal Shield | 0.14 |
| Newfoundland | 0.13 |
| Northern Montane Cordillera | 0.77 |
| Northumberland Lowlands | 6.31 |
| Parkland Prairies | 79.97 |
| Southern Boreal Cordillera | 0.00 |
| Southern Boreal Shield | 1.10 |
| Southern Coastal Mountains | 0.04 |
| Southern Montane Cordillera | 10.27 |
| Western Boreal Shield | 0.00 |
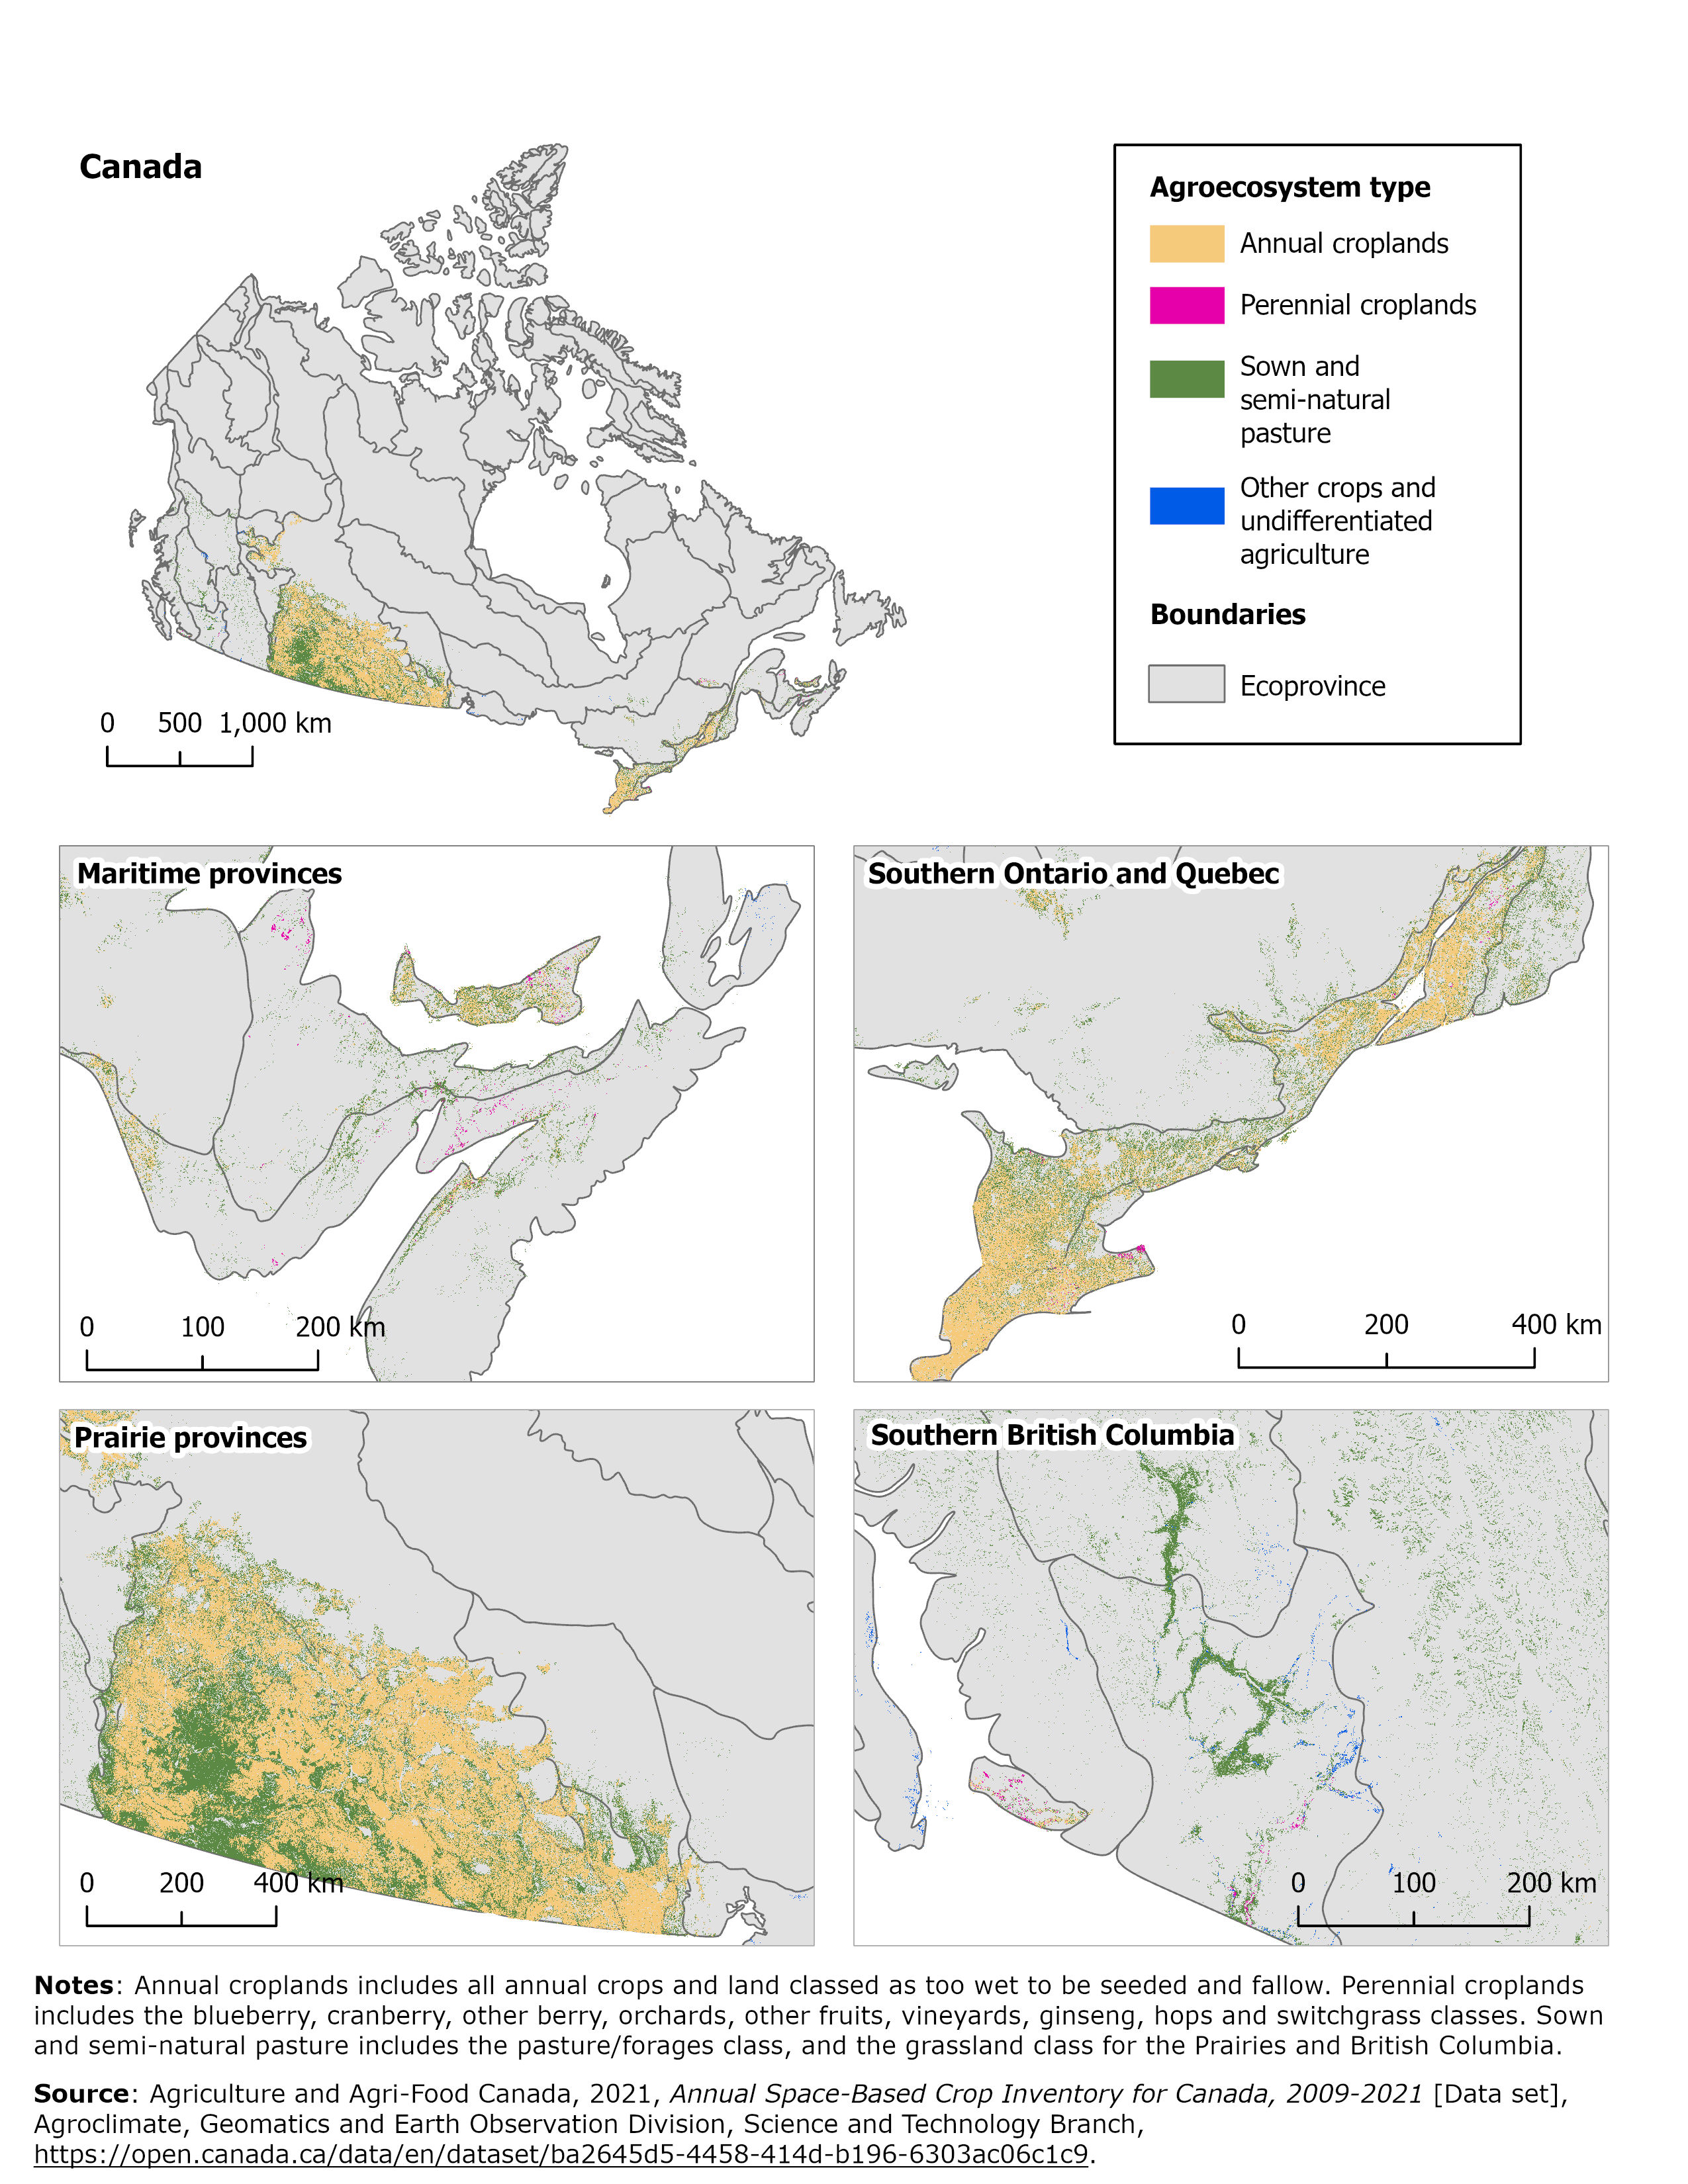
Map 2
Canadian agroecosystem extent, by agroecosystem type, 2021, based on Earth observation data
Description for Map 2
The title of this map is “Canadian agroecosystem extent, by agroecosystem type, 2021, based on Earth observation data”. This map visually represents the distribution and extent of different agroecosystem types in Canada during 2021. The data used for this map were derived from a modified version of Agriculture and Agri-Food Canada’s Annual Crop Inventory for 2021, reclassed into four agroecosystem types.
The map includes a large overview of Canada, accompanied by a legend positioned on the top right side. Additionally, four smaller maps are located on the bottom half of the page, showcasing the agroecosystem types in maritime provinces, southern Ontario and Quebec, Prairie provinces and southern British Colombia. Thin black lines delineate ecoprovinces.
Each map shows agroecosystem types represented by different colours, as outlined in the legend. The legend contains four categories: annual croplands (light orange), perennial croplands (dark pink), sown and semi-natural pasture (green) and other crops and undifferentiated agriculture (blue).
The map of Canada shows the most concentrated areas of agroecosystems are in the Prairie provinces and southern Ontario and Quebec. The map of the maritime provinces showcases sporadic coverage of different agroecosystem types across the entire region with a higher concentration of agroecosystems on Prince Edward Island. The map of southern British Colombia displays seminatural pasture concentrated in the centre of the province, extending from the north to the south. The maps of southern Ontario and Quebec and the Prairie provinces highlight dense concentrations of annual crops and semi-natural pasture.
Notes: Annual croplands include all annal crops and land classed as too wet to be seeded and fallow. Perennial croplands include the blueberry, cranberry, other berry, orchards, other fruits, vineyards, ginseng, hops and switchgrass classes. Sown and semi-natural pasture includes the pasture/forages class, and the grassland class for the Prairies and British Colombia.
Sources: Agriculture and Agri-food Canada, 2021, Annual Space-Based Crop Inventory for Canada, 2009-2021 [Data set], Agroclimatic, Geomatics and Earth Observation Division, Science and Technology Branch, https://open.canada.ca/data/en/dataset/ba2645d5-4458-414d-b196-6303ac06c1c9
| Colour | Agroecosystem type |
|---|---|
| Light orange | Annual croplands |
| Dark pink | Perennial croplands |
| Green | Sown and semi-natural pasture |
| Blue | Other crops and undifferentiated agriculture |
| Shape | Boundary |
| Polygon | Ecoprovince |
| Ecoprovince | Agroecosystem extents 2021 | |||
|---|---|---|---|---|
| AAFC Annual Crop Inventory (ACI) | ||||
| Annual crops | Perennial crops | Sown and seminatural pastures | Other crops and undifferentiated agriculture | |
| hectares | ||||
| Appalachian–Acadian Highlands | 135,000 | 511 | 480,699 | 40 |
| Boreal Foothills | 106,888 | 0 | 279,432 | 18,802 |
| Central Boreal Plains | 5,543,196 | 0 | 2,863,605 | 14,348 |
| Central Grassland | 12,746,466 | 0 | 9,796,824 | 0 |
| Central Montane Cordillera | 334 | 0 | 418,943 | 45,813 |
| Columbia Montane Cordillera | 3,463 | 7 | 688,246 | 19,975 |
| Eastern Boreal Plains | 436,546 | 0 | 612,622 | 0 |
| Eastern Boreal Shield | 54,036 | 26,668 | 89,292 | 0 |
| Eastern Prairies | 1,627,818 | 0 | 566,489 | 0 |
| Fundy Uplands | 72,206 | 18,962 | 237,091 | 2,964 |
| Georgia Depression | 15,563 | 9,942 | 17,048 | 13,550 |
| Great Lakes–St. Lawrence Lowlands | 2,734,185 | 13,518 | 1,662,854 | 312 |
| Hay–Slave Lowlands | 506 | 0 | 2,130 | 31 |
| Huron–Erie Plains | 1,376,058 | 21,830 | 274,878 | 185 |
| Lake of the Woods | 89,982 | 0 | 61,964 | 57,822 |
| Mid-Boreal Shield | 11,497 | 0 | 141,029 | 12,880 |
| Newfoundland | 344 | 83 | 9,897 | 1,517 |
| Northern Coastal Mountains | 0 | 0 | 46,099 | 0 |
| Northern Montane Cordillera | 82 | 0 | 450,568 | 21,326 |
| Northumberland Lowlands | 128,177 | 18,788 | 210,709 | 0 |
| Parkland Prairies | 10,251,462 | 0 | 3,576,895 | 0 |
| Southern Boreal Cordillera | 0 | 0 | 50,372 | 0 |
| Southern Boreal Shield | 126,086 | 976 | 362,501 | 52 |
| Southern Coastal Mountains | 158 | 46 | 244,847 | 3,059 |
| Southern Montane Cordillera | 0 | 10,472 | 374,747 | 48,893 |
| Western Boreal Shield | 0 | 0 | 190 | 0 |
| Canada | 35,460,052 | 121,803 | 23,519,969 | 261,571 |
| 0 true zero or a value rounded to zero | ||||
| Ecoprovince | Agroecosystem extents 2021 | ||||||
|---|---|---|---|---|---|---|---|
| Statistics Canada Agri-Environmental Spatial Data (AESD) | AAFC Annual Crop Inventory (ACI) | ||||||
| Annual croplandsTable 1 Note 1 | Perennial croplandsTable 1 Note 2 | Sown and semi-natural pasturesTable 1 Note 3 | Annual croplandsTable 1 Note 4 | Perennial croplandsTable 1 Note 5 | Sown and semi-natural pasturesTable 1 Note 6 | Other crops and undifferentiated agriculture | |
| hectares | |||||||
| Appalachian– Acadian Highlands |
130,299 | 1,828 | 336,514 | 135,000 | 511 | 480,699 | 40 |
| Boreal Foothills | 90,360 | 35 | 370,816 | 106,888 | 0 | 279,432 | 18,802 |
| Central Boreal Plains | 5,026,736 | 488 | 4,227,856 | 5,543,196 | 0 | 2,863,605 | 14,348 |
| Central Grassland | 11,996,697 | 469 | 9,814,580 | 12,746,466 | 0 | 9,796,824 | 0 |
| Central Montane Cordillera | 6,197 | 48 | 410,541 | 334 | 0 | 418,943 | 45,813 |
| Columbia Montane Cordillera | 5,743 | 496 | 184,879 | 3,463 | 7 | 688,246 | 19,975 |
| Eastern Boreal Plains | 396,439 | 32 | 512,473 | 436,546 | 0 | 612,622 | 0 |
| Eastern Boreal Shield | 56,405 | 30,633 | 57,267 | 54,036 | 26,668 | 89,292 | 0 |
| Eastern Prairies | 1,555,424 | 148 | 650,612 | 1,627,818 | 0 | 566,489 | 0 |
| Fundy Uplands | 67,417 | 17,493 | 110,573 | 72,206 | 18,962 | 237,091 | 2,964 |
| Georgia Depression | 32,457 | 15,631 | 61,428 | 15,563 | 9,942 | 17,048 | 13,550 |
| Great Lakes–St. Lawrence Lowlands | 2,489,754 | 18,083 | 1,087,342 | 2,734,185 | 13,518 | 1,662,854 | 312 |
| Hay–Slave Lowlands | 873 | 0 | 3,093 | 506 | 0 | 2,130 | 31 |
| Huron–Erie Plains | 1,305,749 | 17,811 | 132,542 | 1,376,058 | 21,830 | 274,878 | 185 |
| Lake of the Woods | 86,441 | 8 | 85,591 | 89,982 | 0 | 61,964 | 57,822 |
| Mid-Boreal Shield | 12,805 | 286 | 56,762 | 11,497 | 0 | 141,029 | 12,880 |
| Newfoundland | 1,323 | 294 | 12,314 | 344 | 83 | 9,897 | 1,517 |
| Northern Coastal Mountains | 0 | 0 | 0 | 0 | 0 | 46,099 | 0 |
| Northern Montane Cordillera | 3,219 | 60 | 104,987 | 82 | 0 | 450,568 | 21,326 |
| Northumberland Lowlands | 110,893 | 21,147 | 92,786 | 128,177 | 18,788 | 210,709 | 0 |
| Parkland Prairies | 9,369,803 | 579 | 4,820,937 | 10,251,462 | 0 | 3,576,895 | 0 |
| Southern Boreal Cordillera | 0 | 0 | 0 | 0 | 0 | 50,372 | 0 |
| Southern Boreal Shield | 119,110 | 1,576 | 231,896 | 126,086 | 976 | 362,501 | 52 |
| Southern Coastal Mountains | 491 | 41 | 6,524 | 158 | 46 | 244,847 | 3,059 |
| Southern Montane Cordillera | 12,873 | 11,761 | 581,616 | 0 | 10,472 | 374,747 | 48,893 |
| Western Boreal Shield | 0 | 0 | 117 | 0 | 0 | 190 | 0 |
| Canada | 32,877,508 | 138,945 | 23,954,048 | 35,460,052 | 121,803 | 23,519,969 | 261,571 |
|
|||||||
3. Condition
Ecosystem condition is “the quality of an ecosystem measured in terms of its abiotic and biotic characteristics” (United Nations et al., 2021). Ecosystem condition accounts measure characteristics that affect an ecosystem’s ability to function over time. Agroecosystems in good condition maintain and support biotic and abiotic resources and provide a long-term, balanced supply of ecosystem services (European Commission et al., 2018).
The SEEA EA framework provides a three-stage approach for presenting data on ecosystem condition. The first stage presents data on ecosystem condition variables. The second stage presents data on ecosystem condition indicators (Table 2), created by rescaling condition variables using reference levels to normalize the data. The third stage consists of creating composite indices of the ecosystem condition indicators by aggregating indicators across ecosystem types. The accounts in all three stages include observations on the state of the ecosystem at the beginning and end of the accounting period (United Nations et al., 2021). In this paper, the focus will be on ecosystem condition variables (i.e., the first stage of ecosystem condition accounting), but condition indicators are proposed where data are available.
| SEEA ecosystem condition typology class | Variable descriptor | Measurement unit | Variable values (observed) | Reference level values | Indicator values (rescaled) | ||||
|---|---|---|---|---|---|---|---|---|---|
| Opening | Closing | Lower level | Upper level | Opening | Closing | Change | |||
| Abiotic characteristics | |||||||||
| Physical state | Vegetation water content - NDWI | index (-1 to 1) | -0.15 | -0.13 | -1 | 1 | 0.43 | 0.44 | 0.01 |
| Chemical state | Soil organic carbon | g SOC/kg | 25.6 | 24.8 | 0 | 40 | 0.64 | 0.62 | -0.02 |
| Biotic characteristics | |||||||||
| Compositional state | Farmland bird species richness | Farmland bird index | 71 | 70 | 0 | 100 | 0.71 | 0.70 | -0.01 |
| Structural state | Crop diversity | Simpson's diversity index | 0.43 | 0.48 | 0 | 1 | 0.43 | 0.48 | 0.05 |
| Share of organic farming | percent | 7.5 | 7.6 | 0 | 100 | 0.08 | 0.08 | 0.00 | |
| Functional state | Gross primary production | kg C/m2 | 0.92 | 0.94 | 0.5 | 1.3 | 0.53 | 0.55 | 0.02 |
| Landscape/seascape characteristics | Share of semi-natural vegetation | percent | 5.1 | 4.9 | 0 | 20 | 0.26 | 0.25 | -0.01 |
|
Note: This table is presented for illustrative purposes and does not represent the condition indicator account that will be developed for Canada. Source: Based on table 5.3 in supplementary online materials for the United Nations et al. (2021). System of Environmental-Economic Accounting— Ecosystem Accounting (SEEA–EA). White cover publication, pre-edited text subject to official editing. https://seea.un.org/ecosystem-accounting |
|||||||||
This section proposes a set of potential variables for measuring agroecosystem condition, following the SEEA EA ecosystem condition typology (Table 3). At least one variable in each category is proposed here to comprehensively describe agroecosystem condition. Variables were selected according to criteria outlined in Annex 5.1 of the SEEA EA, which ensure the variables are conceptually appropriate, reasonably feasible, comprehensive and free of redundancy.
Many of the variables rely on the spatially explicit data presented in the agroecosystem extent account. Where possible, the use of existing data is proposed, including relevant variables from Agriculture and Agri-Food Canada’s (AAFC) Agri-Environmental Indicator (AEI) Report Series (1981 to 2021), which is updated every five years using Soil Landscapes of Canada (SLC) polygons as reporting units (Clearwater et al., 2016). These indicators monitor changes in soil, water and air quality across Canada’s agricultural landscape. The indicators use data from the Census of Agriculture that is adjusted based on AAFC’s Land Use Time Series. In addition, new metrics are proposed for condition variables that are not included in the AEI Report Series.
Several challenges were encountered in the development of the agroecosystem condition account. Ideally, all data would be available annually at a fine resolution, so that the variables could be easily aggregated across various geographies. However, the available data for different condition variables are produced at varying spatial and temporal resolutions. In addition, not all the proposed variables have consistent and comparable data available to measure change in a condition variable through time. Moreover, some of the proposed metrics are complex to model and require in situ data. Because of these limitations, the pilot condition accounts will rely on proxies for condition variables where there is currently a lack of data.
For the pilot accounts, the condition variables will be reported by ecogeography. Available data reported by SLC polygons will be aggregated to ecogeographies using weighted averaging. For data reported in raster format, all pixel values in an ecogeography will be averaged or summed, depending on the condition variable. Other datasets are in point format or only available at the provincial scale. For each variable, a single value will be produced for all agroecosystem types, unless specified. New methods to assess change in condition through Earth observations are in development and will be incorporated into future accounts.
Research is also ongoing to derive condition indicators using reference levels. Reference levels represent high and low levels of a condition variable. The distance of a variable from its reference level supplies information about the integrity of the ecosystem. Given that agroecosystems are anthropogenic ecosystems, the most appropriate high level of reference for agroecosystems is likely the best-attainable condition, “the expected condition of an ecosystem under best possible management practices and attaining a stable socio-ecological state” (Annex 5.2, United Nations et al., 2021). For certain variables, these levels may be challenging to determine, as there may not be a scientific consensus on the best possible management practices and levels will likely vary by region.
Ecosystem condition accounts also rely on ancillary data. These data are not directly reported in ecosystem accounts, but they support production of the accounts and their analysis. Ancillary variables include stable or slow changing ecosystem characteristics (e.g., soil type, texture, water holding capacity, bulk density and pH), ecosystem pressures (e.g., climate change, pests and pathogens) and agricultural management practices, including Indigenous practices (e.g., tillage, fertilization, irrigation, etc.). Statistics Canada’s Farm Management Survey is a possible data source for management practices, however data on Indigenous practices is lacking (Statistics Canada, 2022c). Select ancillary variables will be compiled into tables based on data availability and relevance.
| Condition Class | Variable | Status of available data | ||
|---|---|---|---|---|
| National coverage | Update frequency | Reporting geography/ Spatial resolution |
||
| A: Abiotic ecosystem characteristics | ||||
| A1: Physical state | Soil erosion | Available | Quinquennial | SLC Polygons |
| A2: Chemical state | Soil organic matter | Available | Quinquennial | SLC Polygons |
| Annual | Ecozones | |||
| Unknown | 250 m | |||
| Soil nutrient concentrations | Available | Quinquennial | SLC Polygons | |
| Soil pesticide concentration | Available | Quinquennial | SLC Polygons | |
| Soil salinization | Available | Quinquennial | SLC Polygons | |
| B: Biotic ecosystem characteristics | ||||
| B1: Compositional state | Bird abundance and diversity | Available | Annual | Points |
| Soil biodiversity | Unavailable | Not Applicable | Not Applicable | |
| Livestock density | Available | Quinquennial | SLC Polygons | |
| B2: Structural state | Soil cover | Available | Annual | SLC Polygons |
| Organic farming | Available | Annual | Province | |
| Crop rotational diversity | Available | Annual | 30 m | |
| B3: Functional state | Gross primary production | Available | Annual | Province |
| Annual | 250 m | |||
| Annual | 1 km | |||
| Wild pollinator abundance and diversity | Unavailable | Not Applicable | Not Applicable | |
| C: Landscape level characteristics | ||||
| C1: Landscape and seascape | Crop diversity | Available | Annual | 30 m |
| Mean patch size | Available | Annual | 30 m | |
| Natural and semi-natural habitat | Available | Annual | 30 m | |
3.1 Physical state
Physical state variables describe the abiotic (non-living) components of an ecosystem (United Nations et al., 2021). Proposed physical state variables for agroecosystems include the soil erosion rate.
3.1.1 Soil erosion
Soil erosion occurs when soil is worn away and transported. Slope, climate and soil characteristics influence soil erosion caused by natural processes, such as water, wind or gravity; however, farm management practices that leave soil bare and impact its structure make soils more susceptible to erosion (Lobb et al., 2016). Climate change may also exacerbate soil erosion through increased precipitation, wind and drought (Borelli et al., 2020).
AAFC has developed a Soil erosion risk indicator (Soil ERI) as part of the AEI series to assess the risk of soil erosion by water, wind and tillage. The indicator is modelled using data from the National Soil Database (landform and topographic data), the Census of Agriculture, the AAFC Land Use Time Series (land use and management data) and climate data. Water erosion risk is estimated using the Revised Universal Soil Loss Equation version 2 (RUSLE2). Wind erosion risk is estimated using a modified version of the Wind Erosion Equation. Finally, tillage erosion risk is calculated as the product of tillage erosivity and landscape erodibility (Lobb et al., 2016). A component of this indicator, the estimated total soil eroded, could be used in the condition account as a measure of the physical state of agroecosystems.
It is important to note that the Soil ERI does not account for the use of certain erosion control practices on farms, such as cover crops and shelterbelts, which may lead to overestimation of risk in certain areas. There are also specific erosion processes that are not accounted for, such as gully erosion or erosion on frozen soils (Lobb et al., 2016). In addition, the indicator estimates soil eroding from one slope position to the next and therefore the eroded soil is not necessarily removed from a productive field.
The Canadian Soil Information Service (CanSIS) is also developing a new soil erosion dataset using Earth Observation data. Once this dataset becomes available it will also be considered for use in the agroecosystem condition account.
Proposed metrics
- Eroded soil (tonnes/ha)
- Soil erosion risk level
3.2 Chemical state
Chemical state variables describe the chemical composition of abiotic ecosystem components (United Nations et al., 2021). Important variables for agroecosystems include soil organic matter, soil nutrient concentrations, pesticide concentration and soil salinization.
3.2.1 Soil organic matter
Soil organic matter (SOM) consists of plant, microbial and animal matter in various states of decomposition in the soil. It is an important fraction of the soil that influences soil structure, chemistry and function. SOM improves soil aggregation, water infiltration and water holding capacity, soil aeration, nutrient availability, and soil biodiversity. Different soil types can reach different levels of SOM based on their inherent characteristics; however, management practices that incorporate organic material into soil can help maintain or increase SOM (Dignac et al., 2017; Jackson et al., 2017).
Soil organic carbon (SOC) refers to the carbon component of SOM and is a useful proxy for SOM. A Soil organic carbon change indicator (SOCC) has been developed for Canada as part of the AEI series. The indicator tracks changing SOC levels over time using the CENTURY model (National Resource Ecology Laboratory, 2007). Estimates of the total change in kilograms SOC per hectare are available and could be included in the agroecosystem condition variable account. A limitation of this indicator is that it does not account for soil erosion, which can reduce SOC.
Canada also reports annual estimates of net carbon stock changes in soils in its National Inventory Report (NIR) using similar methods to the Soil organic carbon change indicator (ECCC, 2020). Estimates date back to 1990 and are published annually for reporting zones, a geography based largely on the National Ecological Framework ecozones. Similar to the estimates of total SOC change, estimates of net carbon stock changes in soils could be included in the agroecosystem condition variable account.
A Relative soil organic carbon indicator (RSOC) has also been produced by AAFC, which divides the current SOC content by an optimal SOC value. Current SOC estimates are modelled using SOC data from CanSIS, and the estimated change in SOC is based on the SOCC indicator (Cerkowniak et al., 2016). The RSOC values represent a condition variable that has been rescaled using a reference condition, and therefore could be used for an agroecosystem condition indicator account.
Other global datasets that provide below-ground carbon data at finer resolutions using satellite-based Earth observations are also available. SoilGrids has produced a global SOC map for six standard depth intervals at a 250 m spatial resolution from 1950 to 2017 (Hengl & Wheeler, 2017). CanSIS is advancing the groundwork from Hengl et al., (2017) by adding more ground truth data and customizing Canadian specific co-variables from a predictive soil mapping framework. CanSIS has also produced a SOC sequestration assessment across agriculture land in Canada. Both the gridded soil data and the soil derived data are being produced using an incremental approach. These datasets currently only exist for one time period but as methods are further refined, it may be possible to use these datasets to track change in SOC through time.
Proposed metrics
- Total soil organic carbon (kg/ha)
- Soil organic carbon change (kg/ha/yr)
- Net carbon stock change in soils (kg/ha/yr)
- Relative soil organic carbon (kg/ha)
3.2.2 Soil nutrient concentrations
Soils hold nutrients that are essential for crop growth. The three main macronutrients are phosphorus, nitrogen and potassium (Tripathi et al., 2014). While low concentrations of soil nutrients can be detrimental to plant growth, high concentrations can lead to eutrophication of neighbouring waterbodies and have negative impacts on water quality. This is an important variable to track, given that fertilizer applications have been increasing in past years in Canadian agroecosystems (Statistics Canada, Table 32-10-0162-01).
A Residual soil nitrogen (RSN) indicator for Canadian agricultural lands has been developed as part of the AEI series. The estimates are produced using the Canadian Agricultural Nitrogen Budget model (Yang et al., 2007). The model estimates the difference between total nitrogen inputs to agricultural soils and total nitrogen outputs, thus estimating the amount of inorganic nitrogen remaining in the soil at the end of the growing season (Drury et al., 2016). In addition, a similar annual phosphorus balance has been created, which estimates the amount of phosphorus remaining in the soil at the end of the growing season (Reid et al., 2016). The values of residual soil nutrients are suitable metrics to include in the agroecosystem condition variable account.
AAFC has also produced indicators for risk of water contamination by nitrogen and phosphorus (IROWC-N and IROWC-P) (Drury et al., 2016; Reid et al., 2016). These indicators identify agricultural areas with the highest risk of surface water contamination by nitrogen or phosphorus, based on agricultural, climate, watershed and soil properties. The IROWC-N and IROWC-P values represent condition variables that has been rescaled using a reference condition, and therefore could be used for a future agroecosystem condition indicator account.
Proposed metrics
- Residual soil nitrogen (kg N/ha)
- Soil phosphorus balance (kg P/ha)
3.2.3 Pesticide concentration
Pesticides, which include herbicides, fungicides and insecticides, are used to eradicate organisms (e.g., weeds, fungi and insects) that hinder crop growth (Gagnon et al., 2016). The longevity of pesticides in the environment and the toxicity of pesticides to different organisms varies based on chemical composition (DeLorenzo et al., 2001).
Pesticides can affect non-target organisms in the surrounding environment through processes such as vapour drift, soil leaching and surface runoff. These processes can impact agroecosystem functions (e.g., by endangering pollinators), as well as the functioning of neighbouring aquatic ecosystems (Gagnon et al., 2016). Pesticide use has been increasing in Canada since 2008, mainly because of the increase in the use of herbicide resistant crops (which allow herbicides to be applied without damaging the crop) (Health Canada, 2008; Health Canada, 2020).
A Risk of water contamination by pesticides indicator (IROWC-Pest) for Canada has been developed as part of the AEI series (Gagnon et al., 2016). The indicator uses data on farm management practices, including pesticide use, pesticide chemical properties, soil properties and climate, to estimate the annual mass and concentration of pesticides in surface runoff and water infiltrating into the soil to a depth of one meter. The risk of water contamination is assessed based on these variables with a maximum acceptable concentration of 0.5 g/L for pesticide mixtures in drinking water (Gagnon et al., 2016). The risk values represent a condition variable that has been rescaled using a reference condition, and therefore could be used for an agroecosystem condition indicator account.
The IROWC-Pest indicator does not account for differences in pesticide toxicity, and therefore is missing an important risk factor for agroecosystem species, especially insects. Future opportunities to account for differences in pesticide toxicity would increase the value of this condition variable and provide valuable information regarding agroecosystem condition.
The annual concentration of pesticides and the mass of pesticide transported in water are suitable metrics to measure pesticide concentration. The area treated with herbicides, insecticides and fungicides, for which the CEAG collects data every five years, is also a suitable metric for this condition variable (Statistics Canada, Table 32-10-0368-01).
Proposed metrics
- Pesticide concentration in water (µg/L)
- Mass of pesticide transported in water (g/ha)
- Area treated with pesticides (ha)
3.2.4 Soil salinization
Soil salinization occurs when soluble salts accumulate in the soil. The salt particles bind to water particles in the soil, making the water inaccessible to plants and negatively affecting crop yields. Salinization is of particular concern in the Prairie provinces because of high evaporation rates, which bring salts to the soil surface (Bock, 2016). Although salinization is a natural process, it can also be caused by farm management practices that bring salts into the root zone of crops (e.g., summerfallow, tillage; Henry et al., 1987).
A Risk of soil salinization indicator, developed by AAFC as part of the AEI series, exists for the Prairie provinces of Canada. The indicator estimates a Salinity Risk Index based on soil salinity status, topography, climate and land management factors. A limitation of this indicator is the lack of consideration given to weather variability throughout the growing season, since this variability affects salinization (Bock, 2016). However, this regularly published indicator monitors soil salinization trends, providing insight on an important aspect of agroecosystem condition in the Prairies.
Proposed metric
- Salinity risk index for soil
3.3 Compositional state
Compositional state variables describe the communities of biotic (living) components of an ecosystem (United Nations et al., 2021). Variables relating to birds, soil biota and livestock— important biotic components of agroecosystems—fall under this category.
3.3.1 Bird abundance and diversity
Birds play an important ecological role in agroecosystems. Bird foraging behaviour can affect other biotic communities within an ecosystem because of the position of birds in the food chain (Gregory, 2006). Insectivorous birds supply important pest control services by feeding on pests, like aphids and caterpillars, while herbivorous birds play an important part in weed control by feeding on weed seeds (Pejchar et al., 2018). In addition, birds are good indicators of overall biodiversity in an ecosystem because their population trends tend to mirror those of other species (Gregory, 2006). Tracking bird abundance and diversity can therefore be a good sign of the agroecosystem’s ability to support biodiversity.
Further research is needed to determine whether it would be possible to develop an index that combines the population trends of several key agroecosystem-dependent bird species, using openly available datasets in Canada. This indicator could be modelled on the Farmland Birds Index developed by Eurostat (Eurostat, 2022).
Several bird monitoring initiatives in Canada could be used to create this index, including the Breeding Bird Atlases, eBird Canada and the Nocturnal Owl Survey. Almost all datasets are publicly available or available upon request in Birds Canada’s NatureCounts database (Birds Canada, 2022). In this database, occurrence data and population trends exist for over 700 bird species across Canada with some going back to 1960, depending on the species. In addition, the critical habitat for species at risk map produced by Environment and Climate Change Canada (ECCC) (2022a) could be used to assess birds that are agroecosystem dependent.
However, data collected through citizen science has important limitations for the purpose of producing robust statistics. Records can be biased towards areas or species that are more popular and accessible. In addition, records can be temporally and spatially inconsistent. Nevertheless, given the challenge of collecting data for a country as large as Canada, these data are a rich source of information on species occurrences that are not accessible using Earth observation.
The Wild Species reports published by the Canadian Endangered Species Conservation Council are another potential data source for this condition variable. These reports are published every five years and date back to the year 2000. The latest report details the national and regional conservation status for 50,534 known species in Canada, including all 696 known bird species (Canadian Endangered Species Conservation Council, 2021). The percentage of agroecosystem-dependent birds listed as imperiled or critically imperiled in these reports could be used as a metric to assess this condition variable.
Proposed metrics
- Bird species richness
- Percentage of agroecosystem-dependent birds listed as imperiled or critically imperiled in the Wild Species reports
- Canadian farmland birds index
3.3.2 Soil biodiversity
Soils host a large diversity of organisms, such as fungi, bacteria, beetles and earthworms. Each organism carries out an important function in the soil ecosystem, such as providing plants with nutrients through mycorrhizal associations or improving soil structure so water and nutrients can flow freely.
Agroecosystems depend on soil organisms to build SOM, maintain proper soil structure and release nutrients for plant growth (FAO et al., 2019). Although knowledge on soil communities in agroecosystems is still developing, tracking changes in these communities is expected to be important because of their substantial effects on ecosystem function and crop productivity.
The Canadian National Collection of Insects, Arachnids and Nematodes is digitizing its datasets and making them available online. Occurrences of soil dwelling organisms could be obtained from this database. The database currently has over 1,600 occurrence records dating back to 1890; however, the occurrences do not cover all agroecosystems in Canada.
Other opportunities for monitoring change in this variable are becoming available and will hopefully be able to be incorporated in future agroecosystem condition accounts. The Canadian Soil Biodiversity Observatory is creating digital maps of soil biodiversity in Eastern Canada, using high-throughput culturing and sequencing (AAFC, 2023). In addition, new global initiatives, such as the Soil Biodiversity Observation Network (SoilBON) and the Global Soil Biodiversity Initiative (GSBI), are working to produce global soil biodiversity data using new techniques, like remote sensing (SoilBON 2022; GSBI, 2022).
As data on soil organisms becomes more available, it may be possible to create a soil biodiversity index. The index could combine measures of species richness for soil bacteria and fungi, along with the relative abundance of different types of soil micro (e.g., nematodes), meso (e.g., mitres, springtails) and macrofauna (e.g., earthworms, ants) (FAO et al., 2019; Wagg et al., 2014).
Proposed metrics
- Soil microbial species richness
- Nematode species richness
- Soil biodiversity index
3.3.3 Grazing livestock density
The plant and animal species of Canadian grassland ecosystems evolved alongside grazing bison. Grazing is a natural process in these ecosystems that maintains plant diversity and soil health (Cook, 2021). Livestock, particularly cattle, play a critical role in the health of pastures through grazing.
Short periods of intense grazing by livestock can mimic natural bison migration processes and promote high yields, while improving pasture quality (Franke & Kotzé, 2022). However, high livestock stocking rates for long periods can have negative effects on pastoral ecosystems (Aiken, 2019). Pastures with high livestock density over time can suffer from overgrazing, which can lead to soil degradation and biodiversity loss (Cid & Brizuela, 1998; Dlamini et al., 2016). High livestock densities can also increase the potential for disease transmission. Livestock density is therefore an important condition variable to track in agroecosystems.
Livestock, particularly goats and sheep, also graze in certain perennial cropping systems, including orchards and vineyards. Their presence can improve agroecosystem condition by reducing weeds and improving soil fertility (Wilson & Hardestry, 2006). Data on this management practice are lacking in Canada.
Statistics Canada collects data on grazing livestock through the AESD. Data on the total number of each species and pasture area are available by ecogeography and could be used to account for livestock density in the agroecosystem condition account (Statistics Canada, 2022b).
Proposed metrics
- Average number of grazing livestock per km2 of pasture
- Average number of cattle per km2 of pasture
- Average number of sheep per km2 of pasture
- Average number of goats per km2 of pasture
3.4 Structural state
Structural state variables capture aggregate properties of the whole ecosystem, or its major biotic components (United Nations et al., 2021). For agroecosystems, important structural variables include soil cover, the proportion of agricultural land using organic practices and crop rotation.
3.4.1 Soil cover
Soil cover—the extent to which soil is covered by vegetation or snow—is an important structural variable in agroecosystems that affects soil health and function and, in turn, crop productivity. Land management practices affect soil cover in different ways. Some factors include the type of crop planted, the use of summerfallow, the type of tillage practised, and the use of cover crops. Ensuring that soil is covered with vegetation or crop residues protects the soil from being eroded and helps build organic matter and proper soil structure (Krzic et al., 2021). Climate also impacts soil cover because it determines the period of snow cover (Huffman and Liu, 2016a).
AAFC has developed a soil cover indicator as part of the AEI series which estimates the effective number of days in a year that agricultural soils are covered by vegetation, crop residue or snow, using the Soil Cover Days model. The model accounts for typical lengths of soil cover per crop type and ecoregion, residue decomposition rates, snow cover and grazing regimes (Huffman and Liu, 2016a).
Proposed metric
- Effective number of days in a year that agricultural soils are covered (soil cover days)
3.4.2 Organic farming
Organic farming is a form of agriculture that has been increasing in Canada over the past several decades (Statistics Canada, tables 32-10-0363-01 and 32-10-0414-01; Statistics Canada, 2001). Agricultural products that are certified organic are grown or raised according to organic management practices (Canadian General Standards Board, 2021). Organic management practices include the use of diverse crop rotations, the non-chemical control of pests, the application of compost and animal manure instead of synthetic fertilizers, and the use of natural livestock breeding methods. In addition, organic production prohibits the use of several substances and techniques, such as genetically engineered products.
Several public data sources exist on the extent of organic agriculture in Canada. The Canada Organic Trade Association publishes annual organic acreage values by agriculture type and province (Canada Organic Trade Association, 2022). The Research Institute of Organic Agriculture also publishes annual values of organic farm area and the organic area share of total farmland (FiBL, 2022). Data are available from 2000 to 2020.
Statistics Canada conducts an annual Fruits and Vegetables Survey that collects information on cultivated areas of certified organically grown fruits and vegetables by province, from 2019 to 2021 (Statistics Canada, Table 32-10-0212-01). The CEAG also collects information on the sale of certified organic products but does not collect information on the areas of organic production (Statistics Canada, tables 32-10-0363-01 and 32-10-0414-01).
It is important to note that many farms employ environmentally friendly practices but are not officially certified organic. For this reason, it may be of interest in the future to cover the use of sustainable practices, rather than only organic certification.
Proposed metric
- Area of organically managed agricultural land (ha)
- Area of agricultural land applying sustainable management practices (ha)
3.4.3 Crop rotation diversity
Crop rotation is the practice of planting different crops sequentially on the same plot of land. Simple rotations might involve two or three crops, while complex rotations might incorporate a dozen or more.
Multiple benefits are associated with diversified crop rotations, including increased SOM, soil biodiversity, nutrients and crop yields, as well as reduced greenhouse gas emissions, pathogens and pests (AAFC, 2021c; Bowles et al., 2020). These benefits are attributed to the distinct soil microbial communities associated with different crop types. By using crop rotation, a high diversity of soil organisms and soil functions can be sustained in an agricultural field (Tiemann et al., 2015). Tracking the crop rotation diversity (i.e., the number of crops used in rotation) of agricultural fields is therefore an effective way to monitor annual cropland condition.
AAFC publishes an Annual Crop Rotations in Canada dataset, which shows spatially explicit crop rotation history over four growing seasons using the Annual Crop Inventory (ACI). The data are available from 2017 to 2020 (AAFC, 2021d). This dataset could be used to account for crop rotation diversity. In addition, under the Agricultural Climate Solutions (ACS) component of the Government of Canada’s Nature-Based Climate Solutions Fund (NCSF), new annual crop rotation metrics are being generated (A. Davidson, personal communication, 2023). These will be incorporated in our future condition accounts once they become available.
It may also be possible to calculate a crop rotational diversity index following the method adopted by Bowles et al. (2020). The index was calculated as the square root of the number of crop species in rotation multiplied by the length of the rotation, accounting for two fundamental properties of rotations known to affect soil function.
Proposed metric
- Average number of crop species included in rotation
- Crop rotational diversity index
3.5 Functional state
Functional state variables describe the interactions between different components of an ecosystem and the state of functional groups (United Nations et al., 2021). For agroecosystems, these variables include primary production and wild pollinator diversity and abundance.
3.5.1 Primary production
Gross primary production (GPP) is the total amount of carbon fixed (when carbon dioxide from the atmosphere is converted into carbohydrates) by plants during a specific period. Carbon fixation leads to the creation of plant biomass. Net primary production (NPP) is GPP minus the amount of carbon lost to plant respiration (Gough, 2011). NPP is an important variable in agroecosystems because the primary management goal of these ecosystems is the production of crop biomass that is harvested and sold.
The only regularly updated NPP dataset that covers Canada’s agroecosystem extent is produced by the U.S. National Aeronautics and Space Administration (NASA) Earth Observing System (EOS), which produces global satellite derived NPP estimates under their Terra Moderate Resolution Imaging Spectroradiometer (MODIS) MOD17A3HGF Version 6 product (Running et al., 2019). The NPP estimates are produced annually, for the years 2000 to 2021, at a 500 m resolution. The coarse resolution of this product would make it difficult to differentiate the NPP of different agroecosystem types but could still provide spatially explicit annual NPP estimates that could be summed by ecogeography across Canada’s agroecosystem extent. It should be noted that this MODIS product will soon be decommissioned and will not be available for use in future condition accounts.
Potential proxies for this variable include vegetation indices such as the Normalized Difference Vegetation Index (NDVI), which measure vegetation greenness using satellite imagery (Weier & Herring, 2000). Research is ongoing regarding the use of vegetation indices to derive NPP estimates. NDVI is used to track crop condition in Canada as part of Statistics Canada’s Crop Condition Assessment Program. Through this program, vegetation condition is monitored on a seven-day cycle during the growing season for all of Canada’s agroecosystems. Data are available at 1 km and 250 m resolutions, and span 1987 to the present. The dataset provides values for croplands and pastures. However, given the resolution of this dataset, the NDVI values of natural vegetation such as forests or wetlands located adjacent to agriculture areas would be included (Statistics Canada, 2022d).
The LEAF toolbox developed by Natural Resources Canada is an application that provides estimates for a series of vegetation biophysical variables (e.g., leaf area index, fraction canopy cover, etc.) with associated uncertainty estimates for all of Canada. It is being explored as a data source to derive NPP estimates for agroecosystems (Fernandes et al., 2021).
Proposed metrics
- Net primary production (tonnes of carbon/ha/year)
- Proxy: Crop and pasture Normalized Difference Vegetation Index
3.5.2 Wild pollinator abundance and diversity
Pollinators play an important role in agroecosystems, especially in areas with high proportions of pollinator-dependent crops, which rely in part or entirely on pollinators to fruit (Klein et al., 2007). Pollinators also contribute to the fruiting and reproduction of wild plant species in agroecosystems. Therefore, the abundance and diversity of wild pollinators are important condition variables in agroecosystems from both an ecological and an economic standpoint.
Although wild pollinator monitoring initiatives exist at regional and provincial levels across Canada, there are no datasets with national coverage. This lack of data makes it difficult to track national pollinator trends. The Wild Species reports publish data on the conservation status of 903 known bee species and 524 known flower fly species in Canada every five years, at national and provincial levels (Canadian Endangered Species Conservation Council, 2016, 2021). The status of these important pollinating species could be used as a proxy for this condition variable.
Another potential source of data is citizen science. The Xerces Society Bumble Bee Watch is a citizen science initiative that collects bumblebee species occurrence data from photographic observations of bumblebees collected and submitted by community scientists in the United States and Canada. Data are currently available from 1969 to 2019 (Hatfield et al., 2020). Although bumblebee species are not the only important pollinator group, they are one of the groups with the most data.
In addition, an international database known as the Global Biodiversity Information Facility (GBIF) holds records of species occurrences from a variety of sources, including museum collections and citizen science, from the early 1900s to present (GBIF, 2023). As with birds, further research is needed to determine whether an indicator tracking the population trends of key pollinator species can be created.
Proposed metrics
- Pollinator species richness
- Percentage of pollinator species listed as imperiled or critically imperiled in the Wild Species reports
- Canadian pollinator index (based on population trends of key pollinator species)
3.6 Landscape
Landscape variables provide information on the compositional and configurational heterogeneity of different ecosystem types at landscape scales. For agroecosystems, variables include crop diversity, mean patch size, and natural and semi-natural habitat.
3.6.1 Crop diversity
Agroecosystem-dependent species rely on different crop types for food and habitat (Javorek et al., 2016; Fahrig et al., 2011). Thus, a diverse set of crop types across an agricultural landscape can support a greater diversity of species than a landscape with only one or two crops. Crop diversity can also increase yield stability and resilience (Renard & Tilman, 2019; Sanford et al., 2021). For these reasons, crop diversity is an important condition variable to include in an agroecosystem condition account.
To estimate crop diversity across a landscape, the Shannon diversity index, which accounts for both the abundance and the evenness of crop types within a landscape, could be used (Fahrig et al., 2015). Index values range from zero to one, with low values indicating lower levels of crop diversity. The ACI, which delineates crop types at a 30 m resolution, could be the base map used to calculate this index by select ecogeographies.
Proposed metric
- Shannon diversity index for crops
3.6.2 Mean patch size
Along with the maintenance of large patches of natural habitat, field edges play an important role in biodiversity maintenance in agroecosystems (Fahrig et al., 2015; Sirami et al., 2019). Vegetation on the edge of fields can supply shelter and food to beneficial species of birds, mammals and insects. Borders also increase habitat connectivity and ease of dispersal across the landscape. For species that use more than one crop type for food and shelter, smaller parcels provide greater access to different land cover types within the landscape (Fahrig et al., 2011).
Mean patch size refers to the average size of agricultural parcels (e.g., an individual field or orchard) in a landscape. Mean patch size is directly related to the length and density of edges in that landscape (where a landscape with smaller parcels will have a greater length and density of field edges). The perimeter to area ratio is another metric that can be used to assess the length and density of edges.
Data to accurately measure field size across Canadian agroecosystems are limited. The ACI does not always represent parcel edges accurately (i.e., if two different parcels are planted with the same crop). Parcel level crop insurance data likely represent parcel borders more accurately; however, these data are available for a limited number of provinces. The project being undertaken by AAFC and ECCC exploring methods to map woody biomass along field edges in agroecosystems using Earth observation could in future provide an additional source of data for this condition variable (J. Le Moullec, personal communication, 2023).
In the meantime, it may be more feasible to create a pilot account for some provinces using publicly available crop insurance data until detailed data become available nationally. These condition variables could be calculated for select ecogeographies.
Proposed metric
- Mean patch size of agricultural parcels (minimum patch size 90 m x 90 m)
- Perimeter to area ratio of agricultural parcels
3.6.3 Natural and semi-natural habitat
Natural and semi-natural habitat plays an important role in supporting and maintaining biodiversity in agricultural landscapes. Although agricultural land can offer important food and shelter resources to species, the presence of stable forest, unmanaged grassland, semi-natural pasture, shrubland and wetland in the vicinity of cropland is important for the maintenance of species (Sirami et al., 2019). These natural and semi-natural covers provide complementary year-long food and habitat resources that are necessary for the life cycles of many species. Experts have advocated for a minimum of 20% native habitat within agricultural and other managed landscapes (Garibaldi et al., 2020) for the maintenance of biodiversity and ecosystem services.
Several potential metrics could be used to account for natural and semi-natural habitats in agroecosystems. Both the size and proportion of these habitats across the landscape represent important aspects of agroecosystem condition. In addition, the distance between agricultural parcels and natural and semi-natural habitats influences the accessibility and connectivity of these habitats within the agricultural matrix. Average distances of between 1 km and 2 km have been recommended by experts to ensure habitat connectivity (Garibaldi et al., 2020; Chaplin-Kramer et al., 2019; Fahrig et al., 2015).
To produce estimates for these variables by select ecogeographies, geospatial analyses could be conducted using the ACI, along with other supplementary datasets, such as AAFC’s Land Use Time Series.
Proposed metrics
- Average proportion of natural and semi-natural habitat within 2 km of an annual or perennial cropland patch (minimum patch size 90 m x 90 m)
- Percentage of natural and semi-natural habitat by ecogeography
- Average distance to natural and semi-natural habitat
- Mean patch size of natural and semi-natural parcels
4. Ecosystem services
The SEEA EA framework defines ecosystem services as “the contributions of ecosystems to the benefits that are used in economic and other human activity” and recognizes three broad categories of services: provisioning, regulating and maintenance, and cultural (United Nations et al., 2021).
Provisioning services are the tangible benefits humans receive from ecosystems (e.g., crops). Regulating and maintenance services describe the biological processes that regulate and maintain ecosystem function (e.g., climate regulation, pollination). Cultural services are the experiential and intangible benefits humans derive from nature (e.g., recreation, education) (United Nations et al., 2021).
The goal of ecosystem service accounting is to quantify the flows of services to beneficiaries. Final ecosystem services flow between ecosystems and people (e.g., businesses, governments, households). Intermediate ecosystem services flow between ecosystems and can be recorded if they have a clear connection to a final ecosystem service and have high policy interest.
Ecosystem service accounting can provide information to minimize trade-offs in ecosystems, so that ecosystem service provision can be optimized among its various users. The accounts are also useful to identify areas where service supply does not meet demand or where a service is being overused (i.e., the service is being extracted or used at an unsustainable rate), allowing policy makers and land managers to prioritize areas where service provision can be enhanced through ecosystem restoration and management.
The SEEA EA describes the supply and use accounting structure for ecosystem services. Supply tables record the amount of service provided by each ecosystem type (in biophysical or monetary terms), while use tables record the amount of service consumed by different sectors of the economy (United Nations et al., 2021). It is also possible to quantify the potential of an ecosystem to deliver a service and the human demand for a service, although these tables are not a requirement of the statistical standard. The potential and demand for a service provide a deeper understanding of the dynamics underlying service provision (i.e., by identifying areas where demand is not being met).
This framework paper will focus on the supply of ecosystem services but will propose additional metrics to measure the potential and demand of a service where appropriate. Service users and the derived benefits are also a part of ecosystem accounting and will be addressed in future CoE publications. Table 5 lays out the inputs, beneficiaries and users of each service discussed in this section.
There are several options available to model ecosystem services. Accurately modeling ecosystem services is a challenge because they are the result of complex ecological processes across multiple scales. The empirical data needed to calibrate and validate the national scale ecosystem service models is not readily available in most cases (Bennett et al., 2009; Thierry et al., 2021).
Open-source modelling software, including ARIES (Artificial Intelligence for Environment and Sustainability, developed by an international network of scientists) and InVEST (Integrated Valuation of Ecosystem Services and Tradeoffs, developed by the Natural Capital Project), offer opportunities to map and quantify ecosystem services (Sharp et al., 2020; Villa et al., 2014).
ARIES uses global datasets to model the potential, demand and supply of several different services (Villa et al., 2014). However, global datasets are often insufficiently detailed for national-level analyses, which require higher-resolution national and regional datasets. Statistics Canada is currently undertaking research to integrate Canadian datasets in the ARIES platform. InVEST allows users to input their own datasets into its models. The models on both platforms, however, need to be calibrated and validated to produce useable outputs (Sharp et al., 2020).
The use of these and other modelling systems and ongoing research efforts have resulted in more widely available data on ecosystem services at the global and national level. Methods used in the development of ecosystem services accounts for other countries and regions, for example, the Integrated System for Natural Capital Accounting (INCA) project of the European Union, also offer valuable insight (La Notte et al., 2022).
Figure 2
Depiction of ecosystem service categories

Description for Figure 2
The image titled "Depiction of ecosystem service categories" is composed of a circular shape divided into four quadrants. Each quadrant represents a specific category of ecosystem services and features floating text boxes that explain the key services and benefits provided by the ecosystem. Both quadrants in the upper portion have text boxes, while one text box is shared between the two bottom quadrants.
The top left quadrant illustrates an orchard where two people are picking red apples from a tree. The attached textbox has the text: Cultural services: Education, recreation, cultural heritage, and visual amenity.
In the top right quadrant of the image, there is a farm with a small house and cows grazing in a pasture. Additionally, a few fruit trees can be seen near a cornfield. The attached textbox has the text: Provisioning services: Crops, grazed biomass, and ornamental plants.
The bottom left quadrant shows two bees pollinating yellow flowers. While the bottom right quadrant displays a river surrounded by thick vegetation and trees. These quadrants share a text box with the text: Regulating services: Crop pollination, climate regulation, water purification, flood regulation, soil retention, and habitat maintenance.
4.1 Provisioning services
Provisioning services include flows of biomass including food, fuel, fibre and timber, as well as environmental flows, such as water, from ecosystems to people.
Agroecosystems are managed ecosystems in which both natural and human inputs contribute to the supply of ecosystem services. The proportion of natural to human inputs contributing to service supply depends on management intensity. According to the SEEA EA, estimates of provisioning services should focus on the portion of the service that can be attributed to ecosystems (natural capital), and not to human or economic capital (United Nations et al., 2021). However, it recommends the use of proxies when this is not possible.
Ecosystem contributions to biomass production in agricultural systems include pollination, water flow regulation, water purification, soil retention and habitat maintenance. If any of these regulating services are reported as final ecosystem services in the accounts, their contribution to biomass production must be removed from the biomass provisioning service, to avoid double counting. Solar radiation and wind are abiotic flows that also contribute to biomass production but are not considered ecosystem services (United Nations et al., 2021). Human inputs consist of fertilizer and pesticide applications, irrigation, machinery (for weeding, tilling, seeding, etc.), fossil fuels, and human labour (Vallecillo Rodriguez et al., 2019).
4.1.1 Crops
Crop provisioning includes all plant biomass, including grains, seeds, fruits and vegetables, which is harvested from agroecosystems for food and fibre production, fodder and energy. Greenhouse-produced crops are excluded because of the limited ecosystem contributions they receive. The yield attributable to pollination is also excluded if pollination is being reported as a final ecosystem service, to avoid double counting.
ARIES has a model to estimate the ecosystem contribution to crop provisioning. The model estimates the portion of crop yield directly attributable to natural inputs. Further testing, as well as the incorporation of national datasets into ARIES, would be necessary to use this model for Canada.
Total harvested biomass can be used as a proxy for this service. For example, crop provisioning services were reported in Statistic Canada’s Human Activity and the Environment (HAE) report in metric tonnes at the national and provincial levels (Statistics Canada, 2021a). In 2021, agroecosystems produced approximately 109 million tonnes of crops destined for food, animal feed and industrial use. The values were derived from Statistics Canada’s field crop and fruit and vegetable surveys (Statistics Canada, tables 32-10-0359-01, 32-10-0364-01 and 32-10-0365-01).
Proposed metrics
- Potential:
- Further research needed
- Demand:
- Further research needed
- Supply:
- Proportion of harvested biomass attributable to ecosystem contribution (tonnes/ha) (excluding pollination contribution, see Section 4.2.1)
- Proxy: Total harvested biomass (tonnes/ha)
4.1.2 Grazed biomass
Grazed biomass provisioning includes the plant biomass that is grazed by livestock on sown and semi-natural pasture, contributing to livestock growth. In the SEEA EA framework, grazed biomass is considered a final ecosystem service. Crops harvested to produce fodder for livestock (e.g., hay) are excluded. To avoid double counting, livestock biomass is not included in the provisioning service account.
The HAE report provided coarse estimates of grazed biomass provisioning at the national and provincial levels (Statistics Canada, 2021a). In 2021, agroecosystems produced approximately 11 million tonnes of forage for grazing livestock. This biomass values were calculated based on estimated forage production of Canadian pastures using animal unit month estimates (the amount of forage required by one animal for one month). Tame and seeded pasture and natural pasture areas were taken from the CEAG (Statistics Canada, Table 32-10-0153-01).
Proposed metric
- Potential:
- Further research needed
- Demand:
- Further research needed
- Supply:
- Proportion of grazed biomass attributable to ecosystem contribution (tonnes/ha)
- Proxy: Total grazed biomass (tonnes/ha)
4.1.3 Ornamental plants
Ornamental plants include all field-grown plants harvested for ornamental purposes, such as cut flowers and sod. Greenhouse-produced flowers are excluded because of the limited ecosystem contributions they receive. Christmas trees are also excluded because they will be considered within the forest accounts.
For compatibility with reporting of other provisioning services, the weight of harvested ornamental plants could be used as a proxy for the service value. The Annual Greenhouse, Sod and Nursery Survey (GSNA) (Statistics Canada, Table 32-10-0452-01) is the main data source for this industry. However, the GSNA provides estimates of field-grown cut flower production as a count, rather than by weight. Calculating cut flower production in tonnes requires multiplication using a coefficient for cut flower weight. There is currently no explicitly spatial data on cut flower production.
For sod, the GSNA supplies sod areas but not yields (Statistics Canada, Table 32-10-0034-01). An approximate value for average sod yield is 73 tonnes per acre,Note which can then be used to estimate total sod yield in tonnes for all provinces (Aldino Sod Farms, n.d.; Ontario Ministry of Agriculture, Food and Rural Affairs, 2022). The Annual Crop Inventory (ACI) includes sod as a land cover; therefore, spatially explicit data are available.
Proposed metrics
- Potential:
- Further research needed
- Demand:
- Further research needed
- Supply:
- Proportion of field-grown flowers and sod attributable to ecosystem contribution (tonnes/ha)
- Proxy: Total harvested cut flowers (number and tonnes/ha)
- Proxy: Total harvested sod (area and tonnes/ha)
4.2 Regulating and maintenance services
Regulating and maintenance services relate to an ecosystem’s ability to maintain or regulate biological, hydrological or biochemical processes. Regulating and maintenance services have a direct impact on ecosystem function (United Nations et al., 2021).
Agroecosystems are particularly important for providing regulating services to farm operators and nearby populated areas. These services include crop pollination, climate regulation, water purification, flood regulation, soil retention and habitat maintenance.
Both natural and human inputs contribute to the supply of regulating ecosystem services. It can be difficult to disentangle the ecosystem contribution from the economic contribution.
4.2.1 Crop pollination
Many of the agricultural products harvested in Canada and around the world consist of the fruits and seeds of plants. Approximately 85% of the principal fruit, vegetable and seed crops worldwide depend on animals for pollination to varying degrees (Klein et al., 2007). In Canada bees are the main pollinators, but other pollinators include wasps, flies, butterflies, moths, hummingbirds and beetles (AAFC, 2014). For some crops, animal pollination is essential for fruit set, while for others, animal pollination increases the size and quality of fruits or allows them to mature more uniformly (Table 4; Klein et al., 2007). Over 40 crop types grown in Canada rely on pollinators to some degree, to produce fruits and seeds (AAFC, 2014).
Commercial bees deliver important pollination services. However, because honeybees and other commercial pollinators are not native to North America and need to be managed at an extra cost to producers, their pollination services are not considered ecosystem contributions. Wild pollinators deliver free pollination services and are more efficient at pollinating certain crops. There are 856 native bee species in Canada, many of which play a role in crop pollination (Sheffield et al., 2017).
Identifying areas in Canada where crop pollination demand is not met, and where pollinator habitat could be restored, can deliver positive outcomes for farm operators, food security and biodiversity (Reilly et al., 2020). Pollination can be either an intermediate service or a final service, depending on the indicators measured. If the direct contribution of pollination to crop yields is measured, then it can be reported as a final service (and the contributed portion must be removed from the crop provisioning service to avoid double counting) (United Nations et al., 2021).
Allocating the supply of this ecosystem service to a specific ecosystem type is challenging because the main organisms that provide this service—bees—use multiple different ecosystem types as food and habitat sources. Although agroecosystems are the major user of pollination services, they also supply pollination services by providing habitat and food for pollinators. In this paper, cropland is considered the supplier of the final service of pollination, while surrounding natural and semi-natural lands supply an intermediate habitat service to cropland.
There are currently no spatially explicit data on crop pollination services that cover all of Canada’s agroecosystems. However, other countries and researchers have modelled pollination at national and global scales, and similar methods could be adopted. ARIES has several crop pollination models (pollinator occurrence, net value of pollination, pollination surplus and deficit). However, further research is needed before Canadian data can be integrated into the ARIES platform.
InVEST also has a crop pollination model that has been used by certain countries to create their ecosystem services accounts. The InVEST model is data intensive and requires detailed life history traits for all pollinators present in a landscape, complicating its use in a country as large as Canada.
A simpler model for crop pollination was developed by Chaplin-Kramer et al. (2019) to assess global crop pollination services. They first estimated wild pollination potential based on the area of pollinator habitat around farmland, assuming agricultural pixels with over 30% natural and semi-natural habitat within a 2 km surrounding area received sufficient pollination. Natural and semi-natural habitat included forest, grassland (unmanaged and semi-natural pasture), shrubland and wetland. Pollination demand was estimated using crop pollination dependency values from the literature (i.e., percentage crop yield reduction associated with inadequate pollination) (Table 4). Thus, the extent of pollinator-dependent crops represented demand for the service. Finally, pollination supply (i.e., pollination-dependent crop production) was calculated by multiplying the yield values for crops with pollination potential by their pollination dependency to determine total pollination supply. The Chaplin-Kramer method of calculating pollination potential, demand and supply could be applied using national and provincial land cover data that map pollinator-dependent crops and natural habitat. Researchers at the University of British Columbia and the Nature Conservancy of Canada are currently applying these methods to model pollination services in Canada (Personal communication, M. Mitchell, 2023). Further research is needed to determine whether their data could be integrated into the ecosystem service account.
Proposed metrics
- Potential:
- Extent of annual and perennial cropland with a minimum of 30% natural or semi-natural land (km) within 2 km
- Demand:
- Extent of pollinator-dependent crops (km2), by dependence on pollination
- Supply:
- Proportion of harvested biomass attributable to pollination (kg/ha)
| Type of crop | Pollinator-dependent crops in Canada and their level of dependency | Pollinators (known) | |||
|---|---|---|---|---|---|
| Low | Moderate | High | Essential | ||
| Legumes | Bean Lima bean |
Soybean Faba bean |
Note ...: not applicable | Note ...: not applicable | Honeybee, bumble bees, solitary bees |
| Vegetables | Pepper Tomato |
Note ...: not applicable | Cucumber | Pumpkin Squash |
Honeybee, bumble bees, solitary bees |
| Fruits | Note ...: not applicable | Strawberry | Apple Apricot Blueberry Cherry Cranberry Nectarine Peach Pear Plum Raspberry |
Melons | Honeybee, bumble bees, solitary bees, flies, hover flies |
| Oils, seeds and grains | Alfalfa Safflower |
Canola Mustard seed Sunflower |
Buckwheat | Note ...: not applicable | Honeybee, solitary bees, bumble bees, wasps |
... not applicable |
|||||
4.2.2 Global climate regulation
Carbon sequestration and storage are important final ecosystem services that prevent carbon from entering the atmosphere and mitigate climate change. In agricultural systems, above-ground carbon stock includes perennial vegetation at field edges, vineyards and orchards (ECCC, 2020). Carbon stored in annual crops is not accounted for because it is removed from the ecosystem once harvested (United Nations et al., 2021). The below-ground carbon stock (i.e., soil organic carbon) is stored in soil organic matter (SOM).
The agricultural industry emits greenhouse gases through processes like fossil fuel combustion, methane produced by ruminant animals and crop residue decomposition. However, there is evidence that enhancing carbon storage in agroecosystems, especially within soils, could help countries meet national emissions reduction targets (AAFC, 2020).
Soil management practices that can increase soil carbon are those that increase organic inputs, minimize soil disturbance and diversify cropping systems. This includes minimum or no-till farming, the addition of organic amendments, cover cropping and intercropping (AAFC, 2020). The presence of native perennial vegetation (e.g., prairie strips, ley strips) within fields can also have beneficial effects for carbon storage (Van Vooren et al., 2018; Drexler et al., 2021). For above-ground carbon stock, opportunities to increase storage include growing perennial crops and integration of woody perennials along field edges. The adoption of many of these practices, especially in the Prairies, contributed to the transformation of Canadian agricultural soils into a carbon sink in recent decades (Cerkowniak et al., 2016).
Canada’s National Inventory Report (NIR) provides official estimates of net carbon removals for woody biomass, dead organic matter and soils in agroecosystems. These estimates are released annually and could be included in an ecosystem service account (see Section 3.2.1).
Other carbon data are available, including at finer spatial resolutions; however, these data are not consistent with the NIR as they use different methods and cover different time periods. The European Space Agency has also produced global above-ground biomass (i.e., biomass of all living trees, including those on agricultural land) datasets for the years 2010, 2017 and 2018, at a 250 m resolution (Santoro & Cartus, 2021). Finer resolution data (250 m) is more useful in informing where restoration efforts or improved management practices may be needed due to low provision of the ecosystem service. However, more research is necessary to assess the quality of these datasets.
There are finite limits to the amount of carbon that soils in agroecosystems can store. Limits are related to the amount of carbon that plants can fix (and return to the soil) and to the amount of nitrogen they can take up (which is needed for the formation of SOM) (Janzen et al., 2022). Research is ongoing, however many agricultural areas in Canada have not reached their full carbon storage potential (Smukler, 2019). The FAO has produced global maps of soil organic carbon sequestration potential for which CanSIS has contributed Canadian estimates. The maps estimate soil carbon sequestration rates under different sustainable soil management scenarios (FAO, 2022).
Proposed metrics
- Potential:
- Soil carbon sequestration potential (tonnes/ha)
- Demand:
- Further research needed
- Supply:
- Net carbon uptake (tonnes)
- Proxy: Total soil organic carbon (tonnes/ha)
- Proxy: Total carbon stored (tonnes/ha)
4.2.3 Local climate regulation
Local climate regulation services are the contribution of ecosystems to the regulation of temperature and rainfall. This is an increasingly important final service because average summer temperatures continue to rise in Canada (ECCC, 2022b). Vegetation can reduce air temperatures through the creation of shade and through transpiration. The shade provided by vegetation—mainly trees—reduces the input of short-wave radiation reaching the ground. Transpiration is the process by which plants use radiation to evaporate water within their leaves, reducing the amount of radiation available to heat the surrounding air (Rahman & Ennos, 2016).
It is important to note that the cooling effects of agroecosystems are increased by irrigation because radiation is used to evaporate water in the field, rather than warming the air. In fact, irrigation has been shown to have a large impact on temperature extremes worldwide (Thiery et al., 2017). However, given that irrigation is a human input, it cannot be considered an ecosystem contribution. This limits the contribution of agroecosystems to local climate regulation.
Modelling temperature changes through shade and transpiration is complex, however data on evapotranspiration in agroecosystems can be used as a proxy for this condition variable. Although evapotranspiration includes water transpired by plants as well as that evaporated from the soil surface, crop cover during the growing season shades the soil, limiting soil evaporation. Modelled data for average annual evapotranspiration exist for Canada at a 5 km resolution, from 1979 to 2016 (Natural Resources Canada, 2019; Wang, 2008). If irrigated lands were excluded from the calculation, this dataset could be used as a proxy for the supply of local climate regulation services by agroecosystems.
The demand for this service can be represented by the population living in close proximity to agroecosystems, who would benefit from local climate regulation. Statistics Canada’s Census of Population collects detailed population data at various geographies which could be used to estimate the demand for this service (Statistics Canada, 2023). More research is needed to determine the distance within which communities around agroecosystems can benefit from reduced temperatures.
Proposed metrics
- Potential:
- Further research needed
- Demand:
- Population living within the vicinity of agroecosystems
- Supply:
- Reduction in air temperature (degrees Celsius)
- Proxy: Average annual evapotranspiration (cm)
4.2.4 Water purification
Water purification refers to the ecosystem contributions to the restoration and maintenance of water quality through the removal or breakdown of pollutants. For example, plants take up contaminants and prevent them from leaching into groundwater or running off into neighbouring waterbodies. Perennial vegetation patches, riparian buffers and semi-natural pasture are especially important for water purification services. Their deep roots and long growing season allow greater uptake of water and nutrients. These plants can also help improve soil structure, leading to better water infiltration capacity and less runoff (Asbjornsen et al., 2014). Soils also contribute to water purification through physical, chemical and biological processes. For example, soil particles bind contaminants and soil microorganisms, such as bacteria and fungi, transform pollutants (Sindelar, 2015).
In agroecosystems, the most common contaminants include nutrients and pesticides, which are applied to promote crop growth. Crops often do not take up 100% of the nutrients applied to fields because of fertilizer overapplication or improper timing of fertilizer application (Drury et al., 2016). Residual nutrients remaining in the soil are vulnerable to leaching and runoff, putting water quality at risk. High levels of nitrogen and phosphorus in waterbodies can lead to eutrophication, a phenomenon that affects both aquatic biodiversity and water quality for drinking and recreation (Bennett et al., 2001). In 2011, soils in 28% of Canadian farmland had residual nitrogen that was considered to be at a high risk of contaminating water bodies (Drury et al., 2016).
Water purification services can be assessed by determining the amount of contaminants that the ecosystem retains and filters from water. Given that fertilizers are the main water contaminants in agroecosystems, nitrogen or phosphorus retention (e.g., tonnes of nitrogen or phosphorus removed) is often used to measure this service. The service can be considered either intermediate or final, according to the SEEA EA framework, depending on whether the service is being supplied to people or ecosystems.
InVEST offers an option to model water purification supply. Its Nutrient delivery ratio model estimates the amount of nitrogen or phosphorus exported from each pixel in a landscape and subtracts the amount that is retained by the landscape. The output is the total amount of nitrogen or phosphorus from each pixel exported to waterbodies. Pixels that export the least amount of nutrients provide the greatest amount of service. Further research is needed to determine whether this model would be appropriate to use.
Demand for water purification exists in areas where fertilizers are applied to the landscape. Areas where agriculture is more intensive are likely to have a higher demand for the service. The IROWC-N and IROWC-P produced by AAFC (see Section 3.2.2) could represent demand for the service of water purification. These indicators estimate agricultural areas with the highest risk of surface water contamination by nitrogen or phosphorus, based on agricultural, climate, watershed and soil properties (Drury et al., 2016). The total nitrogen and phosphorus input into the agroecosystem could also represent the demand for this service (La Notte et al., 2021).
The demand for water purification services could also be represented by the population reliant on clean water downstream of agricultural areas (Mitchell et al., 2021). Clean water is needed by households, municipalities, farm operators and businesses for drinking, irrigating fields and recreating, among other uses. The number of people living downstream of agroecosystems could be used as a proxy for this service demand.
Pesticides and coliforms are other forms of pollutants that pose a risk to water quality in agroecosystems. AAFC produces indicators of the risk of water contamination by pesticides and coliforms, similar to the aforementioned indicators for nitrogen and phosphorus (Clearwater et al., 2016). These indicators of pesticide and coliform contamination risk could represent demand for the service of water purification. No models that estimate the supply of this service for pesticides and coliforms have yet been identified.
Proposed metrics
- Potential:
- Further research needed
- Demand:
- Extent of agricultural areas ranked with a medium to very high risk of nitrogen and phosphorus contamination (ha)
- Total nitrogen and phosphorus input (tonnes)
- Extent of agricultural areas ranked with a medium to very high risk of pesticide and coliform contamination (ha)
- Proxy: Number of people living downstream of agroecosystems
- Supply:
- Amount of nitrogen and phosphorus retained by the landscape (kg)
- Amount of pesticides and coliforms retained by the landscape (kg)
4.2.5 Water flow regulation
The regulation of water flows is another important ecosystem service. Agroecosystems regulate water flows by absorbing and storing water, helping to mitigate peak water flows and avoid flooding. These services can help prevent flooding that causes serious damage to homes and livelihoods.
Several characteristics influence an agroecosystem’s water infiltration capacity, such as soil texture, bulk density, SOM, microbial activity and root distribution (Vallecillo Rodriguez et al., 2019). Rainfall interception by vegetation in agroecosystems also contributes to the regulation of water flow. In general, pastures and perennial crops retain the most water in their soils, slowing down water flows and reducing flood damage. The service can be considered either intermediate or final.
Models that estimate flood control demand, potential and supply have been developed by the European Union for the INCA project and could be applied to Canadian agroecosystems. The INCA model to estimate flood control potential was based on land cover, soil, slope and imperviousness characteristics. A Canadian flood control potential model would ideally also account for tile drainage in agricultural fields, which can alter both the volume and pathways of runoff (Kokulan, 2019). Unfortunately, national data on tile drainage is lacking, making it challenging to incorporate in the model. To estimate flood control demand, the INCA model used the area of economic assets (in this case, agricultural land and built-up area) located within floodplains. Finally, flood control supply was estimated based on the ecosystem area with flood control potential upstream of the demand area (Vallecillo Rodriguez et al., 2019). Although not measured in the INCA model, the amount of runoff retained by agroecosystems upstream of the demand area would also be an important measure of flood control supply.
ARIES is currently developing flood control potential, demand and supply models. These models provide another option for accounting for flood control services in Canadian agroecosystems.
Proposed metrics
- Potential:
- Extent of agroecosystems capable of retaining runoff (km2)
- Demand:
- Extent of agricultural or built-up areas downstream of agroecosystems (km2)
- Supply:
- Extent of area with flood control potential upstream of demand area (km2)
- Amount of runoff retained by agroecosystems upstream of demand area (L)
4.2.6 Soil retention
Soil retention (i.e., the prevention of soil erosion) is an important service in agroecosystems because it maintains the fertility and health of soils and, by consequence, the productivity of crops. Soil erosion has important economic and ecological consequences (see Section 3.1.1 for more details).
Perennial crops and vegetation along and within fields (hedgerows, shelterbelts, ley strips) provide a stabilising effect for soils. Perennial crops keep the soil covered through the winter and their deep roots improve soil structure (Asbjornsen et al., 2014).
Cropland in Atlantic Canada, southern Quebec and Ontario is most at risk of erosion because of the types of cropping systems in these regions (potato, conventional corn and soy) and the climatic and topographic conditions (i.e., high rainfall and sloping landscapes) (Lobb et al., 2016). Measuring soil retention services can help identify areas where demand for this service is not being met and where management is needed.
Soil retention services can be measured by estimating the amount of soil retained in the landscape, compared with the amount that would be retained in a bare landscape. The service can be considered either intermediate or final depending on the indicators measured. If the contribution of soil retention to ecosystem function is being measured, it is an intermediate service (i.e., intra-ecosystem flow). However, if the direct contribution of soil retention to crop production is measured, it is a final service. If reported as a final service, the contribution of soil retention to crop provisioning must be isolated and removed from the crop provisioning service, to avoid double counting (United Nations et al., 2021; La Notte et al., 2021).
Both InVEST and ARIES have models that estimate soil retention supply. Both models use the Revised Universal Soil Loss Equation (RUSLE), a widely used model for estimating soil erosion by water at regional and national levels (Wall et al., 2002). The InVEST sediment delivery ratio model estimates the amount of soil annually exported and subtracts the amount that is retained by the landscape. The difference between this amount of exported sediment and that exported by a bare landscape determines the amount of sediment retention service provided by the ecosystem. The model requires several input datasets, including land use and land cover (i.e., vegetation cover), rainfall erosivity, elevation, and soil erodibility (Sharp et al., 2020). The ARIES Soil Erosion Control Model provides biophysical estimates of soil loss and retention using similar methods.
The AAFC Soil ERI (see Section 3.1.1) provides data related to this service, but it measures soil erosion and not soil retention. Since it identifies areas at high risk of soil erosion, the data could be used to represent demand for the service of soil retention. In addition, by applying a method like the InVEST model, where the total amount of soil lost is subtracted from the amount of soil that would be lost in a landscape without any vegetation, it could be possible to estimate the total amount of soil retained by the ecosystem (Lobb et al., 2016). Research is ongoing to evaluate which method is most appropriate to account for this service.
Proposed metrics
- Potential:
- Further research needed
- Demand:
- Extent of agricultural areas ranked with a medium to very high risk of soil erosion (km2) by the Soil erosion risk indicator
- Supply:
- Total amount of soil retained by agroecosystems (tonnes/km2)
4.2.7 Habitat maintenance
Canada’s diverse agricultural landscape provides habitat for close to 600 species of birds, mammals, reptiles and amphibians, as well as thousands of arthropods, fungi and bacterial species (Javorek et al., 2016). Many types of agricultural fields and edges serve as habitat and food sources for species, providing pollen, nectar, insects, seeds, refuge and overwintering habitat for many organisms (Guiller et al., 2016; Fahrig et al., 2011). As managers of these landscapes, farm operators play an important role in sustaining biodiversity.
Habitat maintenance is considered an intermediate service that contributes to provisioning and recreation services (i.e., maintaining habitat for pollinators contributes to crop supply).
AAFC has produced a Wildlife habitat capacity on farmland indicator as part of the AEI series. The indicator calculates the relative value of farmland for terrestrial vertebrates. Different land covers are assessed, based on the number of vertebrate species that use the habitat for breeding or feeding (Javorek et al., 2016). The indicator is not immediately usable for the measurement of habitat maintenance under this framework since it includes non-agricultural land covers for all SLC polygons with more than 5% agricultural area. Other limitations include the fact that the indicator does not consider habitat quality, which can vary greatly depending on farm management practices. The indicator also does not include insects, which are important organisms for agroecosystem function. Further research is needed to determine whether the indicator could be modified to fit the purposes of ecosystem accounting.
Metrics such as those suggested for bird diversity in Section 3.3.1 could also be used as proxies for measuring habitat maintenance services. The calculation of the Shannon crop diversity index and mean patch size for agricultural ecosystems also give an indication of the level of habitat provision and maintenance (see Sections 3.6.1 and 3.6.2) (Fahrig et al., 2015; Martin et al., 2020).
Proposed metrics
- Potential:
- Further research needed
- Demand:
- Further research needed
- Supply:
- Area of agricultural land that serves as habitat (km2)
- Proxy: Bird richness
- Proxy: Shannon diversity index for crops
- Proxy: Mean patch size of agricultural parcels (ha)
4.3 Cultural services
Cultural services include the “experiential and non-material connections” humans derive from nature (United Nations et al., 2021). These include recreation-related services; visual amenity services; education, scientific and research services; and spiritual, artistic and symbolic services. It is not only farm operators and workers that benefit from agroecosystem cultural services, but anyone who visits or interacts with agroecosystems. Many cultural services are difficult to account for at a national scale because of the challenges of capturing the diverse relational values Canadians hold with nature.
This paper proposes methods to account for four cultural services: education and research, recreation, cultural heritage and visual amenity. Work is ongoing to evaluate how cultural services could be better represented and accounted for in future agroecosystem accounts. Other cultural services not yet discussed in this paper include social relations, inspiration, spirituality and sense of place (Huynh et al., 2022). Engagement with agricultural organizations and Indigenous groups is needed to determine which cultural services should be included in the ecosystem service accounts and what data and methods would be most appropriate to account for these services.
4.3.1 Education and research
Agroecosystems, as complex socioecological systems, contribute to many different types of education and research efforts across Canada. Educational opportunities offered by agroecosystems include on-farm educational tours for visitors and technical trainings for farm operators and workers. Technical trainings can be given by educational institutions, farmer-to-farmer networks and nongovernmental organizations. The number of farms offering tours, the number of trainings available for farm operators and workers and the number of farmer-to-farmer networks in Canada can all be potential indicators for this service.
Agroecosystems also provide research opportunities. Several Canadian universities have renowned faculties of agricultural and environmental science. Research fields that make use of these ecosystems include agronomy, soil science, microbiology, ecology, entomology, hydrology, horticultural science, weed science, genomics and toxicology.
The proportion of Canadian professors doing research on Canadian agroecosystems and the number of their publications can be potential indicators for this service. This information can be found on university websites and in academic journal databases (e.g., Web of Science).
Proposed metrics
- Potential:
- Further research needed
- Demand:
- Further research needed
- Supply:
- Number of farms offering educational tours to visitors
- Number of farmer-to-farmer networks in Canada
- Number of Canadian educational institutions offering farming related degrees
- Number of Canadian professors conducting research in Canadian agroecosystems
- Number of scientific articles published by Canadian researchers related to agricultural sciences in Canada
4.3.2 Recreation
Agroecosystems offer many recreation opportunities to Canadians. Systems geared towards agritourism contribute particularly to this service. Recreational activities include fruit and vegetable picking, corn maze exploring, animal visiting, bird watching, walking and wine tasting.
The InVEST Recreation Model estimates the spread of person-days of recreation across the landscape using geotagged photos posted to Flickr (Sharp et al., 2020). Flickr is not as popular as other social media sites, such as Facebook and Instagram, and data are only available from 2005 to 2017, limiting the effectiveness of this model.
Other software exists that allows users to analyze data from social media sites. Netlytic is a text and social network analysis software that automatically summarizes public online conversations on Twitter, YouTube, Reddit, Facebook and Instagram (Netlytic, 2022). A similar software, quintly, allows social media images to be downloaded and analyzed (quintly, 2022). These types of software may present opportunities to estimate the number of visitors to agroecosystems per year, but further research is needed regarding privacy issues and statistical biases associated with them.
ARIES has a model for outdoor recreation based on naturalness of land covers and accessibility. However, this model is less suited to managed ecosystems, like agroecosystems. The accessibility portion of the model could represent the demand for this service, since the population living in proximity to agroecosystems have access to recreate in these ecosystems. Population data from Statistics Canada’s Census of Population could be used to estimate the demand for this service (Statistics Canada, 2023). More research is needed to determine which agroecosystems are most suitable for recreation and the distance within which communities around agroecosystems can benefit from recreation services.
Another metric that can be used to measure this service is the revenue from on-farm recreational activities. Statistics Canada collects data on farm revenue every two years in its Farm Financial Survey; however, recreational activity revenue is currently grouped with other revenue sources (Statistics Canada, 2021b). It may be possible to find other data sources to estimate the portion of this revenue that could be related to recreation.
The potential of agroecosystems to provide recreational services could be estimated using metrics such as those suggested for bird diversity in Section 3.3.1, representing the potential for bird watching in these ecosystems. More research is needed to determine other metrics of recreation potential in agroecosystems.
Proposed metrics
- Potential:
- Bird richness
- Further research needed
- Demand:
- Population living within the vicinity of agroecosystems
- Supply:
- Total number of days or visits spent recreating in agroecosystems
- Total number of visitors to agroecosystems for recreational purposes
- Revenue from on-farm recreational activities
4.3.3 Cultural heritage
The land within Canada’s agroecosystems has a long tradition of being farmed. Many farms, values, stories and traditions have been passed down from generation to generation, creating a strong sense of cultural heritage among Canadian agricultural communities. However, as Canada’s rural landscape continues to transform and as the number of small farms continues to decline (Statistics Canada, 2022a), this cultural service is likely to shift.
Cultural heritage is a complex service to estimate, given its intangibility, especially on a national scale. Ideally this ecosystem service would capture the benefits provided by the various tangible and intangible cultural traditions and values associated with agroecosystems. Smaller-scale studies have used participatory methods, such as surveys and interviews, to try to estimate this service (Holleland et al., 2017). Further research is needed to determine whether adding new questions to a Statistics Canada survey would be feasible to account for this service.
Some Indigenous communities have been farming for centuries. In 2016, Aboriginal agricultural operators represented 2% of Canada’s farm operators and they represent a growing proportion of the agricultural population in Canada (Gauthier & White, 2019). Traditional practices, values and knowledge about agricultural land management have been passed through many generations and represent an important aspect of the cultural heritage value provided by agroecosystems. Data on the number of farms applying traditional Indigenous practices or growing native crops is lacking but could be potential indicators for the supply of this service (Arcand et al., 2020; Hill, 2020). Engagement with Indigenous communities is needed to further develop appropriate indicators and methods to account for this service.
Currently, both the CEAG and the Farm Financial Survey at Statistics Canada include questions on succession planning, providing data on planned inheritance of farms (Statistics Canada, Table 31-10-0244-01; Statistics Canada, 2021b). This could represent a proxy for the service of cultural heritage while research and engagement on this ecosystem service is ongoing.
Proposed metrics
- Potential:
- Further research needed
- Demand:
- Further research needed
- Supply:
- Number of farm operators applying traditional Indigenous practices
- Number of farms growing native or culturally relevant crops
- Proxy: Number of farms inherited from a family member
4.3.4 Visual amenity
The mosaic landscape of agroecosystems can provide a service to local populations through its visual appeal (United Nations et al., 2021). Houses that are near agricultural land may have pleasing views of open fields, pastures or orchards which can encourage feelings of well-being and improve mental health (Brady, 2006; Fagerholm et al., 2016).
Measuring visual amenity is difficult given its intangibility. A further complication is that groups of people with different age, ethnicity or backgrounds may respond differently to the same landscape views (Lindemann-Matthies et al., 2010).
The potential for an agroecosystem landscape to provide a visual amenity service is linked to the condition of the ecosystem. Agricultural landscapes that are biodiverse, less intensively managed, pastoral, have high crop diversity or with vegetation in the form of woodlots and hedgerows, tend to be more visually pleasing (Lindemann-Matthies et al., 2010). As such an indicator based on these condition variables may give a measure of the potential of the landscape to provide visual amenity services, however more research is needed.
A potential metric for the supply of this service could be the difference in the price of homes with uninterrupted views of agricultural land compared with local average prices. However, it is important to note that certain types of farming may decrease the prices of nearby homes if noise levels or smells are intrusive. More research is needed to develop an appropriate metric for this service supply. Other metrics on visual enjoyment are difficult to obtain but could be obtained through engagement with or surveying of agricultural communities.
Proposed metrics
- Potential:
- Further research needed
- Demand:
- Further research needed
- Supply:
- Further research needed
| Ecosystem service | Level of provision | Factors determining supply | Factors determining use | Metrics or proxies for service quantification | Benefits | Main users and beneficiaries | |
|---|---|---|---|---|---|---|---|
| Ecological | Social | ||||||
| Provisioning | |||||||
| Crops | Final | Solar energy; soil fertility; water flow regulation; water purification; soil retention; pollination; pest control; habitat for service providing organisms | Farm management practices (fertilization, irrigation, pesticide application, tilling, cover cropping, crop diversity, perennial vegetation etc.) | Demand for crops | • Proportion of harvested biomass attributable to ecosystem contribution (excluding pollination contribution) (tonnes/ha) • Proxy: Total harvested biomass (tonnes/ha) |
Crop products | Farm operators and workers; households |
| Grazed biomass | Final | Solar energy; soil fertility; water flow regulation; water purification; soil retention | Farm management practices | Demand for livestock | • Proportion of grazed biomass attributable to ecosystem contribution (tonnes/ha) • Proxy: Total grazed biomass (tonnes/ha) |
Livestock and livestock products | Farm operators and workers; households |
| Ornamental plants (field grown) | Final | Solar energy; soil fertility; water flow regulation; water purification; soil retention | Farm management practices | Demand for cut flowers, sod and nursery plants | • Proportion of field-grown flowers and sod attributable to ecosystem contribution (tonnes/ha) • Proxy: Total harvested cut flowers (number and tonnes/ha) • Proxy: Total harvested sod (area and tonnes/ha) |
Cut flowers, sod and nursery plants | Farm operators and workers; households |
| Regulating and maintenance | |||||||
| Crop pollination | Final or intermediate | Abundance and diversity of wild pollinators; extent and connectivity of pollinator food and habitat throughout growing season | Use of agrichemicals; tilling; presence of honeybee hives; crop diversity; maintenance or planting of perennial vegetation | Location of crops benefiting from wild pollination | Proportion of harvested biomass attributable to pollination (kg/ha) | Enhanced yield for certain crops; reduced need for paid pollinator services | Farm operators and workers; households; ecosystems |
| Global climate regulation | Final | Solar energy; soil type; soil biota; perennial vegetation cover; vegetation type | Current and past soil management practices; GHG emissions; maintenance or planting of perennial vegetation | Vulnerability to climate change | • Net carbon uptake (tonnes) • Total soil organic carbon (tonnes/ha) • Total carbon stored (tonnes/ha) |
Reduced concentrations of GHG in the atmosphere; climate change mitigation | Collectively used by government on behalf of society |
| Local climate regulation | Final | Solar energy; vegetation cover and type; precipitation | Irrigation; maintenance or planting of perennial vegetation | Proximity to the ecosystem; air temperature | • Reduction in air temperature (degrees Celsius) • Proxy: Average annual evapotranspiration |
Moderation of local climate conditions; more comfortable air temperatures | Farm operators and workers; households; businesses |
| Water purification | Final or Intermediate | Vegetation cover and type; soil type; soil water infiltration capacity; soil biota | Farm management practices (especially current and past soil management practices) | Area at risk of being contaminated through runoff | • Amount of nitrogen and phosphorus retained by the landscape (kg) • Amount of pesticides and coliforms retained by the landscape (kg) |
Improved water quality | Farm operators and workers; households; businesses; ecosystems |
| Water flow regulation | Final or Intermediate | Vegetation cover and type; soil type; soil water infiltration capacity; soil biota | Farm management practices (especially current and past soil management practices) | Area at risk of flooding | • Extent of area with flood control potential upstream of demand area (km2) • Amount of runoff retained by agroecosystems upstream of demand area (L) |
Lower risk of flooding | Farm operators and workers; households; businesses |
| Soil retention | Final or intermediate | Soil type; soil biota; vegetation cover and type | Farm management practices (especially current and past soil management practices) | Demand for agricultural biomass; location of managed water bodies at risk from sedimentation | • Total amount of soil retained by agroecosystems (tonnes/km2) | Reduced soil erosion and preserved soil fertility | Farm operators and workers; households; businesses; ecosystems |
| Habitat maintenance | Intermediate | Extent and connectivity of food and habitat throughout growing season | Use of agrichemicals; tilling; maintenance or planting of perennial vegetation | Demand for services that can be provided by organisms | • Area of agricultural land that serves as habitat for wildlife (km2) • Proxy: Bird richness • Proxy: Shannon Diversity index for crops • Proxy: Mean patch size of agricultural parcels (ha) |
Maintenance of biodiversity and ecosystem service provision | All ecosystems; ultimately all sectors of society |
| Cultural | |||||||
| Education | Final | Agroecosystem condition | Farm management practices; funding for education activities | Demand for training from farmers; education policies; research priorities; funding | • Number of farms offering educational tours to visitors • Number of farmer-to-farmer networks in Canada • Number of Canadian educational institutions offering farming related degrees • Number of Canadian professors conducting research in Canadian agroecosystems • Number of scientific articles published by Canadian researchers related to agricultural sciences in Canada |
Intellectual development; advancement of knowledge and understanding | Educational and research organisations; agricultural sector |
| Recreation | Final | Agroecosystem condition; presence of important landmarks or species; landscape characteristics | Farm management including facilities to support access | Accessibility of farm sites; demand for outdoor recreation | • Total number of days or visits spent recreating in agroecosystems • Total number of visitors to agroecosystems for recreational purposes • Revenue from on-farm recreational activities |
Improved physical and mental health; enjoyment | Households; agritourism sector |
| Cultural heritage | Final | Agroecosystem condition | Farm ownership; farm management practices; sowing of culturally important crops | Demand for maintaining agricultural heritage; funding | • Number of farmers applying traditional Indigenous practices • Number of farms growing native or culturally relevant crops • Proxy: Number of farms inherited from a family member |
Improved mental health and sense of belonging | Households |
| Visual amenity | Final | Agroecosystem condition; landscape characteristics | Farm management practices | Demand for housing in agricultural areas | • Further research needed | Improved mental health; enjoyment | Households |
5. Conclusion
This paper has outlined the framework that will be used to develop extent, condition and ecosystem services accounts for Canadian agroecosystems as part of the Census of Environment (CoE). The accounts will be built incrementally, addressing variables based on data availability, complexity and importance. Methods and datasets will be updated as data, knowledge and modelling techniques improve. The accounts will also be updated regularly to track changes in extent, condition and services through time.
The agroecosystem accounts provide a structured approach to track the area and state of agroecosystems as well as their contributions to our well-being. While these accounts will provide crucial information to link economic and environmental data for policymakers, certain important aspects of agroecosystems fall outside the scope of the accounts. Information on agricultural land tenure as well as the positive impact humans have on the environment through stewardship, management and restoration fall outside the scope of the ecosystem accounts but may be addressed in separate programs. Ecosystem disservices are also not a focus of the SEEA EA framework. Finally, data on the pressures that agroecosystems exert on neighbouring ecosystems will be reflected in the accounts of the affected ecosystems (e.g., forest, wetland and freshwater accounts).
Agroecosystems are important ecosystems that provide food security, livelihoods, and multiple regulating and cultural ecosystem services. Monitoring their extent and condition is vital to Canada’s economy and to the well-being of the population. Valuing the services provided by agroecosystems is important to ensure they continue to be well managed and maintained.
6. Glossary
Abiotic: Non-living elements of the environment.
Agricultural nitrogen budget model: A model of the residual soil nitrogen at the Soil Landscapes of Canada scale that uses climate data to calculate nitrogen loss in drainage water.
Agricultural parcel: A continuous area of land seeded with a single crop by a single farm.
Biomass: The mass of living organisms.
Built-up area: Area that is predominantly developed, such as road surfaces, buildings, urban areas and industrial sites, at a resolution of 30 m or greater.
Bulk density: The dry weight of soil divided by its volume.
CENTURY model: A model of plant-soil nutrient cycling that simulates carbon and nutrient dynamics within an ecosystem.
Citizen science: The participation of the public in scientific research.
Ecosystem asset: contiguous spaces of a specific ecosystem type characterized by a distinct set of biotic and abiotic components and their interactions.
Ecosystem service demand: The amount of service required by a population.
Ecosystem service potential: The capacity of an ecosystem to provide a service.
Ecosystem service supply: The amount of service delivered to a population.
Eutrophication: Excess nutrients in a body of water, leading to an increase in plant and algal growth.
Evapotranspiration: The combined processes of water evaporation from soil surfaces and transpiration from plants into the atmosphere.
Final service: An ecosystem service from which humans directly benefit.
Fixation: A process by which an inorganic compound is converted to an organic compound by living organisms.
Forb: A flowering plant that is not a grass, sedge or rush.
Gross primary production: The rate of conversion of energy to carbon through photosynthesis.
High-throughput sequencing: Technologies that rapidly sequence DNA and RNA using cost-effective methods.
Landscape scale: A spatial scale that encompasses the ecological processes or dispersal ranges of species being studied.
Mineralization: Organic matter decomposition releasing nutrients in a plant-available form.
Mycorrhizal: Associations between fungi and plants.
Natural and semi-natural habitat: All land classes except settlement and roads, cropland and harvested forest.
Net primary production: Gross primary production minus the amount of energy used for metabolism and maintenance of the plant; this is the amount of biomass produced.
Normalized Difference Vegetation Index (NDVI): The difference between the near-infrared (which plants reflect) and visible light (which plants absorb) waves reflected by plants—a green and healthy plant will reflect most of the visible light that hits it, while an unhealthy plant will reflect more visible light and less near-infrared light; low NDVI values can signal that a plant is unhealthy.
Respiration: The rate at which CO2 is released from soil.
Ruderal: Plant species that colonize human-disturbed sites.
Soil community: The assembly of organisms inhabiting the soil and playing a role in several important ecological processes.
Soil compaction: The compression of soil particles, reducing pore space between them.
Soil Landscapes of Canada (SLC): Polygons of distinct soil types and their attributes across Canada; SLCs were compiled at a scale of 1:1 million.
Soil organic carbon: The fraction of soil organic matter made up of carbon.
Soil organic matter: The portion of soil made up of living tissue in various stages of breakdown.
Soil porosity: The volume of space between soil particles filled with water or air.
Soil texture: The proportions of sand, silt and clay particles that make up the soil.
Spectral characteristic: The magnitude of energy that an object reflects or emits across a range of wavelengths.
Summerfallow: A practice where cropland is kept out of production during a regular growing season through cultivation or chemical means.
Tillage: Preparation of agricultural soil through mechanical means.
Topography: The features of the Earth’s surface.
Versatile Soil Moisture Budget model: A model of soil water budget developed by Agriculture and Agri-Food Canada that is continuous and deterministic in nature, based on the concept that water for plant growth is gained through precipitation or irrigation and lost through the mechanisms of evapotranspiration, runoff, and lateral and deepdrainage.
7. References
Abdalla, M., Hastings, A., Cheng, K., Yue, Q., Chadwick, D., Espenberg, M., Truu, J., Rees, R.M. and Smith, P. (2019). A critical review of the impacts of cover crops on nitrogen leaching, net greenhouse gas balance and crop productivity. Global change biology, 25(8), 2530-2543.
Agriculture and Agri-Food Canada. (2014). Native pollinators and agriculture in Canada.
Agriculture and Agri-Food Canada. (2020). Greenhouse gas emissions and agriculture. Retrieved October 26, 2022.
Agriculture and Agri-Food Canada. (2021a). Annual Space-Based Crop Inventory for Canada, 2009-2021. [Data set]. Agroclimate, Geomatics and Earth Observation Division, Science and Technology Branch.
Agriculture and Agri-Food Canada. (2021b). Land Use Time Series, 2000-2020. [Data set]. Agroclimate, Geomatics and Earth Observation Division, Science and Technology Branch.
Agriculture and Agri-Food Canada. (2021c). Diverse crop rotations shown to increase yields, improve soil health and lower GHGs. Retrieved October 14, 2022.
Agriculture and Agri-Food Canada. (2021d). Crop Rotations in Canada [Data set]. Agroclimate, Geomatics and Earth Observation Division, Science and Technology Branch.
Agriculture and Agri-Food Canada. (2022). Percent of Normal Soil Moisture [Data set]. Agroclimate, Geomatics and Earth Observation Division, Science and Technology Branch.
Agriculture and Agri-Food Canada. (2023). Canadian Soil Biodiversity Observatory. Retrieved March 29, 2023.
Aiken, G. E. (2019). Grazing Management Options for Maintaining Optimum Pasture Composition and Utilization [Keynote]. The XXIII International Grassland Congress, New Delhi, India.
Aldino Sod Farms. (n.d.). F.A.Q. and Tips from the Pros. Retrieved November 26, 2022.
Arcand, M. M., Bradford, L., Worme, D. F., Strickert, G. E., Bear, K., Johnston, A. B. D., Wuttunee, S.M., Gamble, A. & Shewfelt, D. (2020). Sowing a way towards revitalizing Indigenous agriculture: Creating meaning from a forum discussion in Saskatchewan, Canada. Facets, 5(1), 619-641.
Asbjornsen, H., Hernandez-Santana, V., Liebman, M., Bayala, J., Chen, J., Helmers, M., Ong, C. K. & Schulte, L. A. (2014). Targeting perennial vegetation in agricultural landscapes for enhancing ecosystem services. Renewable Agriculture and Food Systems, 29(2), 101-125.
Bardgett, R. D., Bullock, J. M., Lavorel, S., Manning, P., Schaffner, U., Ostle, N., ... & Shi, H. (2021). Combatting global grassland degradation. Nature Reviews Earth & Environment, 2(10), 720-735.
Bennett, E. M., Carpenter, S. R., & Caraco, N. F. (2001). Human impact on erodable phosphorus and eutrophication: a global perspective: increasing accumulation of phosphorus in soil threatens rivers, lakes, and coastal oceans with eutrophication. BioScience, 51(3), 227-234.
Bennett, E. M., Peterson, G. D., & Gordon, L. J. (2009). Understanding relationships among multiple ecosystem services. Ecology letters, 12(12), 1394-1404.
Birds Canada. 2022. NatureCounts web application.
Bock, M.D. (2016). Soil Salinization. In R. L. Clearwater, T. Martin & T. Hoppe (Eds.), Environmental sustainability of Canadian agriculture: Agri-environmental indicator report series – Report #4 (pp. 101 – 109). Agriculture and Agri-Food Canada.
Borrelli, P., Robinson, D.A., Panagos, P., Lugato, E., Yang, J.E., Alewell, C., Wuepper, D., Montanarella, L. & Ballabio, C. (2020). Land use and climate change impacts on global soil erosion by water (2015-2070). Proceedings of the National Academy of Sciences, 117(36), 21994-22001.
Bowles, T. M., Mooshammer, M., Socolar, Y., Calderón, F., Cavigelli, M. A., Culman, S. W., Deen, W., Drury, C.F., Garcia y Garcia, A., Gaudin, A.C.M., Harkcom, W.S, Lehman, R.M., Osborne, S.L., Roberston, G.P., Salerno, J., Schmer, M.R., Strock, J. & Grandy, A. S. (2020). Long-term evidence shows that crop-rotation diversification increases agricultural resilience to adverse growing conditions in North America. One Earth, 2(3), 284-293.
Brady, E. (2006). The aesthetics of agricultural landscapes and the relationship between humans and nature. Ethics, Place and Environment, 9(1), 1-19.
Canada Organic Trade Association. (2022). Organic in Canada: By the Numbers [Data set].
Canadian Endangered Species Conservation Council. (2016). Wild Species 2015: The General Status of Species in Canada.
Canadian Endangered Species Conservation Council. (2021). Wild Species 2020: The General Status of Species in Canada.
Canadian General Standards Board. (2021). Organic production systems General principles and management standards.
Cerkowniak, D., McConkey, B.G., Smith, W.N. & Bentham, M.J. (2016). Soil Organic Matter. In R. L. Clearwater, T. Martin & T. Hoppe (Eds.), Environmental sustainability of Canadian agriculture: Agri-environmental indicator report series – Report #4 (pp. 90 - 100). Agriculture and Agri-Food Canada.
Chaplin-Kramer, R., Sharp, R. P., Weil, C., Bennett, E. M., Pascual, U., Arkema, K. K., Brauman, K. A., Bryant, B. P., Guerry, A. D., Haddad, N. M., Hamann, M., Hamel, P., Johnson, J. A., Mandle, L., Pereira, H. M., Polasky, S., Ruckelshaus, M., Shaw, M. R., Silver, J. M., … Daily, G. C. (2019). Global modeling of nature’s contributions to people. Science, 366(6462), 255–258.
Cid, M. S., & Brizuela, M. A. (1998). Heterogeneity in tall fescue pastures created and sustained by cattle grazing. Rangeland Ecology & Management/Journal of Range Management Archives, 51(6), 644-649.
Clearwater, R. L., Martin, T., & Hoppe, T. (Eds.). (2016). Environmental sustainability of Canadian agriculture: Agri-environmental indicator report series – Report #4. Agriculture and Agri-Food Canada.
Cook, I. (2021) Livestock producers are powerful allies for grassland birds. Birds Canada. Retrieved February 17th, 2023.
Davidson, A.M., Fisette, T., Mcnairn, H. & Daneshfar, B. (2017). Detailed crop mapping using remote sensing data (Crop Data Layers). In Delincé, J. (Ed.), Handbook on Remote Sensing for Agricultural Statistics (pp. 91 - 129). Global Strategy to improve Agricultural and Rural Statistics (GSARS) .
DeLorenzo, M.E., Scott, G.I. & Ross, P.E. (2001). Toxicity of pesticides to aquatic microorganisms: A review. Environmental Toxicology and Chemistry, 20(1), 84-98.
Dignac, M.-F., Derrien, D., Barré, P., Barot, S., Cécillon, L., Chenu, C., Chevallier, T., Freschet, G. T., Garnier, P., Guenet, B., Hedde, M., Klumpp, K., Lashermes, G., Maron, P.-A., Nunan, N., Roumet, C., & Basile-Doelsch, I. (2017). Increasing soil carbon storage: Mechanisms, effects of agricultural practices and proxies. A Review. Agronomy for Sustainable Development, 37(2), 1-27.
Dlamini, P., Chivenge, P., & Chaplot, V. (2016). Overgrazing decreases soil organic carbon stocks the most under dry climates and low soil ph: A meta-analysis shows. Agriculture, Ecosystems & Environment, 221, 258–269.
Drexler, S., Gensior, A., & Don, A. (2021). Carbon sequestration in hedgerow biomass and soil in the temperate climate zone. Regional Environmental Change, 21(3), 1-14.
Drury, C.F., Yang, J., De Jong, R., Huffman, T., Reid, K., Yang, X., Bittman, S. & Desjardins R. (2016). Residual Soil Nitrogen. In R. L. Clearwater, T. Martin & T. Hoppe (Eds.), Environmental sustainability of Canadian agriculture: Agri-environmental indicator report series – Report #4 (pp. 114- 120). Agriculture and Agri-Food Canada.
Environment and Climate Change Canada. (2020). National Inventory Report 1990–2018: Greenhouse Gas Sources and Sinks in Canada. Pollutant Inventories and Reporting Division.
Environment and Climate Change Canada. (2022a). Critical Habitat for Species at Risk National Dataset – Canada [Data set]. Canadian Wildlife Service.
Environment and Climate Change Canada. (2022b). Temperature change in Canada. Retrieved October 26, 2022.
European Commission, Directorate-General for Environment, Grizzetti, B., Teller, A., Maes, J. (2018). Mapping and assessment of ecosystems and their services: an analytical framework for mapping and assessment of ecosystem condition in EU, Publications Office.
Eurostat. (2022). Farmland birds index. Retrieved February 17, 2023.
Fagerholm, N., Oteros-Rozas, E., Raymond, C. M., Torralba, M., Moreno, G., & Plieninger, T. (2016). Assessing linkages between ecosystem services, land-use and well-being in an agroforestry landscape using public participation GIS. Applied Geography, 74, 30-46.
Fahrig, L., Baudry, J., Brotons, L., Burel, F. G., Crist, T. O., Fuller, R. J., Sirami, C., Siriwardena, G. M., Martin, J.-L. (2011). Functional landscape heterogeneity and animal biodiversity in agricultural landscapes. Ecology Letters, 14(2), 101- 112.
Fahrig, L., Girard, J., Duro, D., Pasher, J., Smith, A., Javorek, S., King, D., Lindsay, K. F., Mitchell, S., Tischendorf, L. (2015). Farmlands with smaller crop fields have higher within-field biodiversity. Agriculture, Ecosystems & Environment, 200, 219- 234.
FAO, ITPS, GSBI, CBD and EC (Eds.). (2020). State of knowledge of soil biodiversity - Status, challenges and potentialities, Report 2020.
FAO. (2018). Terms and Definitions, Global Forest Resources Assessment 2020.
FAO. (2022). Global Soil Organic Carbon Sequestration Potential Map – SOCseq v.1.1. Technical report.
Fernandes, R. et al. (2021). LEAF Toolbox [Data set]. Canada Centre for Remote Sensing.
FiBL. (2022). Area data on organic agriculture in Canada 2000-2022. [Data set]. The Research Institute of Organic Agriculture (FiBL).
Franke, A.C. and Kotzé, E. (2022). High-density grazing in southern Africa: Inspiration by nature leads to conservation? Outlook on Agriculture. 51(1), 67-74.
Gagnon, P., Sheedy, C., Farenhorst, A., Cessna, A.J., Newlands, N. & McQueen, D.A.R. (2016). Pesticides. In R. L. Clearwater, T. Martin & T. Hoppe (Eds.), Environmental sustainability of Canadian agriculture: Agri-environmental indicator report series – Report #4 (pp. 153- 165). Agriculture and Agri-Food Canada.
Garibaldi, L. A., Oddi, F. J., Miguez, F. E., Bartomeus, I., Orr, M. C., Jobbágy, E. G., Kremen, C., Schulte, L. A., Hughes, A. C., Bagnato, C., Abramson, G., Bridgewater, P., Carella, D. G., Díaz, S., Dicks, L. V., Ellis, E. C., Goldenberg, M., Huaylla, C. A., Kuperman, M., … Zhu, C. D. (2020). Working landscapes need at least 20% native habitat. Conservation Letters, 14(2).
Gauthier, N., & White, J. (2019). Aboriginal peoples and agriculture in 2016: a portrait. Statistics Canada.
GBIF. (2023). GBIF Home Page. Retrieved March 29, 2023.
Global Soil Biodiversity Initiative. (2022). Objectives. Retrieved October 14, 2022.
Gough, C. M. (2011) Terrestrial Primary Production: Fuel for Life. Nature Education Knowledge 3(10), 28.
Gregory, R. (2006). Birds as biodiversity indicators for Europe. Significance, 3(3), 106-110.
Guiller, C., Affre, L., Albert, C. H., Tatoni, T., & Dumas, E. (2016). How do field margins contribute to the functional connectivity of insect-pollinated plants?. Landscape Ecology, 31(8), 1747-1761.
Hatfield, R, E. Sellers, J. Kerr, M. Larrivée (2020). Xerces Society - Bumble Bee Watch (Version 1.9). [Data set]. United States Geological Survey.
Health Canada. (2008). Pest control products sales report for 2007 and 2008.
Health Canada. (2020). Pest control products sales report for 2020.
Hengl, T. (2018). Soil bulk density (fine earth) 10 x kg / m-cubic at 6 standard depths (0, 10, 30, 60, 100 and 200 cm) at 250 m resolution (v0.2) [Data set]. Zenodo.
Hengl, T. & Gupta, S. (2019). Soil available water capacity in mm derived for 5 standard layers (0-10, 10-30, 30-60, 60-100 and 100-200 cm) at 250 m resolution (v0.1) [Data set]. Zenodo.
Hengl, T. & Wheeler, I. (2018). Soil organic carbon stock in kg/m2 for 5 standard depth intervals (0–10, 10–30, 30–60, 60–100 and 100–200 cm) at 250 m resolution (v0.2) [Data set]. Zenodo.
Henry, L., B. Harron, and D. Flaten. (1987). The nature and management of salt-affected land in Saskatchewan. Saskatchewan Agriculture.
Hill, C. (2020). Returning the ‘three sisters’ – corn, beans and squash – to Native American farms nourishes people, land and cultures. The Conversation. Retrieved September 1, 2023.
Holleland, H., Skrede, J., & Holmgaard, S. B. (2017). Cultural heritage and ecosystem services: A literature review. Conservation and Management of Archaeological sites, 19(3), 210-237.
Huffman T. & Liu, J. (2016a). Soil Cover. In R. L. Clearwater, T. Martin & T. Hoppe (Eds.), Environmental sustainability of Canadian agriculture: Agri-environmental indicator report series – Report #4 (pp. 53- 63). Agriculture and Agri-Food Canada.
Huffman, T., &. Liu, J. (2016b). Soil Organic Matter. In R. L. Clearwater, T. Martin & T. Hoppe (Eds.), Environmental sustainability of Canadian agriculture: Agri-environmental indicator report series – Report #4 (pp. 53- 63). Agriculture and Agri-Food Canada.
Huynh, L. T. M., Gasparatos, A., Su, J., Dam Lam, R., Grant, E. I., & Fukushi, K. (2022). Linking the nonmaterial dimensions of human-nature relations and human well-being through cultural ecosystem services. Science Advances, 8(31).
Jackson, R. B., Lajtha, K., Crow, S. E., Hugelius, G., Kramer, M. G., & Piñeiro, G. (2017). The ecology of soil carbon: pools, vulnerabilities, and biotic and abiotic controls. Annual Review of Ecology, Evolution, and Systematics, 48(1), 419-445.
Janzen, H. H., van Groenigen, K. J., Powlson, D. S., Schwinghamer, T., & van Groenigen, J. W. (2022). Photosynthetic limits on carbon sequestration in croplands. Geoderma, 416, 115810.
Javorek, S.K., Grant, M.C., Fillmore, S. (2016). Wildlife Habitat. I n R. L., Clearwater, T. Martin & T. Hoppe (Eds.), 2016. Environmental sustainability of Canadian agriculture: Agri-environmental indicator report series – Report #4 (pp. 64- 73). Agriculture and Agri-Food Canada.
Jian, J., Vargas, R., Anderson-Teixeira, K., Stell, E., Herrmann, V., Horn, M., Kholod, N., Manzon, J., Marchesi, R., Paredes, D., Bond-Lamberty, B. (2021). A restructured and updated global soil respiration database (SRDB-v5). Earth System Science Data, 13(2), 255- 267.
Keith, D.A., Ferrer-Paris, J.R., Nicholson, E. and Kingsford, R.T. (Eds.) (2020). The IUCN Global Ecosystem Typology 2.0: Descriptive profiles for biomes and ecosystem functional groups. IUCN.
Klein, A. M., Vaissière, B. E., Cane, J. H., Steffan-Dewenter, I., Cunningham, S. A., Kremen, C., & Tscharntke, T. (2007). Importance of pollinators in changing landscapes for world crops. Proceedings of the Royal Society B: Biological Sciences, 274(1608), 303-313.
Kokulan, V. (2019). Environmental and Economic Consequences of Tile Drainage Systems in Canada. The Canadian Agri-Food Policy Institute.
Krzic, M., Walley, F.L., Diochon, A., Paré, M.C., & Farrell, R.E. (Eds.). (2021). Digging into Canadian soils: An introduction to soil science. Canadian Society of Soil Science.
La Notte, A., Vallecillo Rodriguez, S., Garcia Bendito, E., Grammatikopoulou, I., Czucz, B., Ferrini, S., Grizzetti, B., Rega, C., Herrando, S., Villero, D., Zurbaran Nucci, M. & Maes, J. (2021). Ecosystem Services Accounting – Part III - Pilot accounts for habitat and species maintenance, on-site soil retention and water purification. Publications Office of the European Union.
La Notte, A., Vallecillo, S., Grammatikopoulou, I., Polce, C., Rega, C., Zulian, G., Kakoulaki, G., Grizzetti, B., Ferrini, S., Zurbaran-Nucci, M., Garcia Bendito, E., Vysna, V., Paracchini, M. L. & Maes, J. (2022). The Integrated System for Natural Capital Accounting (INCA) in Europe: Twelve lessons learned from Empirical Ecosystem Service Accounting. One Ecosystem, 7.
Lindemann-Matthies, P., Briegel, R., Schüpbach, B., & Junge, X. (2010). Aesthetic preference for a Swiss alpine landscape: The impact of different agricultural land-use with different biodiversity. Landscape and Urban Planning, 98(2), 99-109.
Lobb, D.A, Li, S. & McConkey, B.G. (2016). Soil Erosion. In R. L., Clearwater, T. Martin & T. Hoppe (Eds.), Environmental sustainability of Canadian agriculture: Agri-environmental indicator report series – Report #4 (pp. 77- 89). Agriculture and Agri-Food Canada.
Martin, A. E., Collins, S. J., Crowe, S., Girard, J., Naujokaitis-Lewis, I., Smith, A. C., Lindsay, K., Mitchell, S. & Fahrig, L. (2020). Effects of farmland heterogeneity on biodiversity are similar to—or even larger than—the effects of farming practices. Agriculture, Ecosystems & Environment, 288, 106698.
Mitchell, M. G., Schuster, R., Jacob, A. L., Hanna, D. E., Dallaire, C. O., Raudsepp-Hearne, C., ... & Chan, K. M. (2021). Identifying key ecosystem service providing areas to inform national-scale conservation planning. Environmental Research Letters, 16(1), 014038.
National Resource Ecology Laboratory. (2007). Century Model Information. Retrieved December 6th, 2022.
National Sciences and Engineering Research Council of Canada. (2022). NSERC’s Awards Database. Retrieved April 1st, 2022.
Natural Resources Canada. (2019). Land Surface Evapotranspiration for Canada’s Landmass. Retrieved October 26, 2022.
Netlytic. (2022). About. Retrieved October 26, 2022.
Ontario Ministry of Agriculture, Food and Rural Affairs. (2022). Sod Production. Retrieved October 24, 2022.
Pejchar, L., Clough, Y., Ekroos, J., Nicholas, K. A., Olsson, O., Ram, D., Tschumi, M., Smith, H. G. (2018). Net effects of birds in Agroecosystems. BioScience, 68(11), 896-904
quintly. (2022). Social Media Analytics and competitive benchmarking tool. Retrieved October 26, 2022.
Rahman, M. A., & Ennos, A. R. (2016). What we know and don’t know about the cooling benefits of urban trees. Trees & Design Action Group.
Reid, D.K, Western, W., Rounce, T., Bogdan, D., Churchill, J., van Bochove, E., Thériault, G. & Denault, J.-T . (2016). Phosphorus. In R. L., Clearwater, T. Martin & T. Hoppe (Eds.), Environmental sustainability of Canadian agriculture: Agri-environmental indicator report series – Report #4 (pp. 131- 142). Agriculture and Agri-Food Canada.
Reilly, J. R., Artz, D. R., Biddinger, D., Bobiwash, K., Boyle, N. K., Brittain, C., Brokaw, J., Campbell, J. W., Daniels, J., Elle, E., Ellis, J. D., Fleischer, S. J., Gibbs, J., Gillespie, R. L., Gundersen, K. B., Gut, L., Hoffman, G., Joshi, N., Lundin, O., … Winfree, R. (2020). Crop production in the USA is frequently limited by a lack of pollinators. Proceedings of the Royal Society B: Biological Sciences, 287(1931), 20200922.
Renard, D., & Tilman, D. (2019). National food production stabilized by crop diversity. Nature, 571(7764), 257–260.
Running, S., Zhao, M. (2019). MOD17A3HGF MODIS/Terra Net Primary Production Gap-Filled Yearly L4 Global 500 m SIN Grid V006 [Data set]. NASA EOSDIS Land Processes DAAC.
Sanford, G. R., Jackson, R. D., Booth, E. G., Hedtcke, J. L., & Picasso, V. (2021). Perenniality and diversity drive output stability and resilience in a 26-year cropping systems experiment. Field Crops Research, 263, 108071.
Santoro, M., Cartus, O. (2021). ESA Biomass Climate Change Initiative (Biomass cci): Global datasets of forest above-ground biomass for the years 2010, 2017 and 2018 (V3). [Data set]. NERC EDS Centre for Environmental Data Analysis.
Sharp, R., Douglass, J., Wolny, S., Arkema, K., Bernhardt, J., Bierbower, W., Chaumont, N., Denu, D., Fisher, D., Glowinski, K., Griffin, R., Guannel, G., Guerry, A., Johnson, J., Hamel, P., Kennedy, C., Kim, C.K., Lacayo, M., Lonsdorf, E., Mandle, L., Rogers, L., Silver, J., Toft, J., Verutes, G., Vogl, A. L., Wood, S, and Wyatt, K. (2020). InVEST 3.12.0. The Natural Capital Project, Stanford University, University of Minnesota, The Nature Conservancy, and World Wildlife Fund.
Sheffield, C. S., Heron, J., Gibbs, J., Onuferko, T. M., Oram, R., Best, L., deSilva, N., Dumesh, S., Pindar, A., & Rowe, G. (2017). Contribution of DNA barcoding to the study of the bees (Hymenoptera: Apoidea) of Canada: Progress to date. The Canadian Entomologist, 149(6), 736–754.
Sindelar, M. (2015). Soils Clean and Capture Water. Retrieved October 26, 2022.
Sirami, C., Gross, N., Baillod, A. B., Bertrand, C., Carrié, R., Hass, A., Henckel, L., Miguet, P., Vuillot, C., Alignier, A., Girard, J., Batáry, P., Clough, Y., Violle, C., Giralt, D., Bota, G., Badenhausser, I., Lefebvre, G., Gauffre, B., … Fahrig, L. (2019). Increasing crop heterogeneity enhances multitrophic diversity across agricultural regions. Proceedings of the National Academy of Sciences, 116(33), 16442–16447.
Smukler, S. (2019). Managing Canadian Croplands to Maximize Carbon Sequestration and Minimize Other Ecosystem Service Trade-Offs. The Canadian Agri-Food Policy Institute.
Soil BON. (2022). Retrieved October 14, 2022.
Soil Landscapes of Canada Working Group. (2010). Soil Landscapes of Canada version 3.2. [Data set].
Sothe, C., Gonsamo, A., Arabian, J., Kurz, W. A., Finkelstein, S. A., & Snider, J. (2022). Large soil carbon storage in terrestrial ecosystems of Canada. Global Biogeochemical Cycles, 36(2).
Statistics Canada. (2001). Farms classified by certified organic products produced, by province, Census Agricultural Region (CAR) and Census Division (CD), 2001. Retrieved April 5th, 2023.
Statistics Canada. (2021a). Accounting for ecosystem change in Canada. Human Activity and the Environment. Retrieved March 8, 2022.
Statistics Canada. (2021b). Farm Financial Survey (FFS). Surveys and statistical programs. Retrieved October 26, 2022.
Statistics Canada. (2022a). Canada's 2021 Census of Agriculture: A story about the transformation of the agriculture industry and adaptiveness of Canadian farmers. The Daily. Retrieved October 26, 2022.
Statistics Canada. (2022b). Census of Agriculture: Agri-Environmental Spatial Data (AESD) [Data set]. Retrieved December 14th, 2022.
Statistics Canada. (2022c). Farm Management Survey (FMS). Retrieved October 20, 2022.
Statistics Canada. (2022d). Crop condition assessment program (CCAP). Interactive map application. Retrieved October 20, 2022.
Statistics Canada. Table 32-10-0034-01 Estimates of sod area, sales and resales [Data set]. Retrieved November 10, 2022.
Statistics Canada. Table 32-10-0153-01 Land use, Census of Agriculture historical data [Data set]. Retrieved November 10, 2022.
Statistics Canada. Table 32-10-0155-01 Selected livestock and poultry, Census of Agriculture historical data [Data set]. Retrieved November 10, 2022.
Statistics Canada. Table 32-10-0162-01 Land inputs and tillage and seeding practices, Census of Agriculture historical data [Data set]. Retrieved November 10, 2022.
Statistics Canada. Table 32-10-0212-01 Area, production and farm gate value of marketed organic fruits and vegetables [Data set]. Retrieved November 10, 2022.
Statistics Canada. Table 32-10-0244-01 Succession plan for the agricultural operation, Census of Agriculture [Data set]. Retrieved November 10, 2022.
Statistics Canada. Table 32-10-0359-01 Estimated areas, yield, production, average farm price and total farm value of principal field crops, in metric and imperial units [Data set]. Retrieved November 10, 2022.
Statistics Canada. Table 32-10-0363-01 Organic products, Census of Agriculture, 2021[Data set]. Retrieved November 10, 2022.
Statistics Canada. Table 32-10-0364-01 Area, production and farm gate value of marketed fruits [Data set]. Retrieved November 10, 2022.
Statistics Canada. Table 32-10-0365-01 Area, production and farm gate value of marketed vegetables [Data set]. Retrieved November 10, 2022.
Statistics Canada. Table 32-10-0368-01 Land inputs, manure and irrigation, Census of Agriculture, 2021 [Data set]. Retrieved November 10, 2022.
Statistics Canada. Table 32-10-0414-01 Organic products, Census of Agriculture, 2011 and 2016, inactive [Data set]. Retrieved November 10, 2022.
Statistics Canada. Table 32-10-0452-01 Estimates of field-grown cut flowers area, production and sales [Data set]. Retrieved November 10, 2022.
Swinton, S. M., Lupi, F., Robertson, G. P., Hamilton, S. K. (2007). Ecosystem Services and agriculture: Cultivating agricultural ecosystems for diverse benefits. Ecological Economics, 64(2), 245- 252.
Tamburini, G., Aguilera, G., & Öckinger, E. (2022). Grasslands enhance ecosystem service multifunctionality above and below-ground in agricultural landscapes. Journal of Applied Ecology, 59(12), 3061- 3071.
Thierry, H., Parrott, L., & Robinson, B. (2021). Next steps for ecosystem service models: integrating complex interactions and beneficiaries. FACETS, 6(1), 1649-1669.
Thiery, W., Davin, E. L., Lawrence, D. M., Hirsch, A. L., Hauser, M., & Seneviratne, S. I. (2017). Present‐day irrigation mitigates heat extremes. Journal of Geophysical Research: Atmospheres, 122(3), 1403-1422.
Tiemann, L. K., Grandy, A. S., Atkinson, E. E., Marin‐Spiotta, E., & McDaniel, M. D. (2015). Crop rotational diversity enhances belowground communities and functions in an agroecosystem. Ecology letters, 18(8), 761-771.
Tripathi, D., Singh, V., Chauhan, D., Prasad, S., Dubey, N. (2014). Role of Macronutrients in Plant Growth and Acclimation: Recent Advances and Future Prospective. In P., Ahmad, Wani, M., Azooz, M., Phan Tran, LS (Eds), Improvement of Crops in the Era of Climatic Changes (pp. 197- 216). Springer .
United Nations et al. (2021). System of Environmental-Economic Accounting— Ecosystem Accounting (SEEA EA). White cover publication, pre-edited text subject to official editing.
U.S. Department of Agriculture, Natural Resources Conservation Service (2005). National Soil Survey Handbook, title 430-VI. Soil Properties and Qualities (Part 618), Available Water Capacity (618.6).
U.S. Department of Agriculture, Natural Resources Conservation Service. (2008). Soil respiration.
Vallecillo Rodriguez, S., La Notte, A., Kakoulaki, G., Kamberaj, J., Robert, N., Dottori, F., Feyen, L., Rega, C. and Maes, J. (2019). Ecosystem services accounting. Part II-Pilot Accounts for Crop and Timber Provision, Global Climate Regulation and Flood Control, 165. Publications Office of the European Union.
Van Vooren, L., Reubens, B., Ampoorter, E., Broekx, S., Pardon, P., Van Waes, C., & Verheyen, K. (2018). Monitoring the impact of hedgerows and grass strips on the performance of multiple ecosystem service indicators. Environmental management, 62(2), 241-259.
Vandermeer, J. H. (2009). The ecology of agroecosystems. Jones & Bartlett Publishers.
Villa, F., Bagstad, K. J., Voigt, B., Johnson, G. W., Portela, R., Honzák, M., & Batker, D. (2014). A methodology for adaptable and robust ecosystem services assessment. PloS one, 9(3).
Wagg, C., Bender, S. F., Widmer, F., & Van Der Heijden, M. G. (2014). Soil biodiversity and soil community composition determine ecosystem multifunctionality. Proceedings of the National Academy of Sciences, 111(14), 5266-5270.
Wall, G.J., D.R. Coote, E.A. Pringle and I.J. Shelton (Eds.). (2002). RUSLEFAC — Revised Universal Soil Loss Equation for Application in Canada: A Handbook for Estimating Soil Loss from Water Erosion in Canada. Research Branch, Agriculture and Agri-Food Canada.
Wang, S. (2008). Simulation of evapotranspiration and its response to plant water and CO2 transfer dynamics. Journal of Hydrometeorology, 9(3), 426-443.
Weier, J., & Herring, D. (2000). Measuring Vegetation (NDVI & EVI). Retrieved October 20, 2022.
Wilson, L. M. and Hardestry, L. H. (2006). Targeted Grazing with Sheep and Goats in Orchard Settings. In K. Launchbaugh (Ed.), Targeted Grazing: A natural approach to vegetation management and landscape enhancement (pp. 99-106). American Sheep Industry Association.
Yang, J.Y., DeJong, R., Drury, C.F., Huffman, E.C., Kirkwood, V., and Yang, X.M. (2007). Development of a Canadian Agricultural Nitrogen Budget (CANB v2.0) model and the evaluation of various policy scenarios.Canadian Journal of Soil Science, 87, 153-165.
- Date modified: