
Latest Developments in the Canadian Economic Accounts
An overview of the Non-Profit Sector in Canada, 2010 to 2020

Archived Content
Information identified as archived is provided for reference, research or recordkeeping purposes. It is not subject to the Government of Canada Web Standards and has not been altered or updated since it was archived. Please "contact us" to request a format other than those available.
Skip to text
Text begins
Introduction
Non-profit institutions, such as labor unions, community food services, and hospitals are a crucial component of the Canadian economy. These institutions provide goods and services, including health care, education, and housing, especially to lower-income groups. They also improve the functioning of other sectors and enhance socio-economic well-being. Data on non-profit gross domestic product (GDP) and employment can be used to examine the role of non-profits in Canada.
Canada was the first country to establish a satellite account for non-profit institutions and volunteer work in 2004, as recommended by the UN's satellite account handbook, which classifies non-profit institutions into three broad categories:
Business non-profit institutions include organisations such as chambers of commerce, business associations, protection services, and condominium associations. These organizations do not fall under the direct control of the government, offer goods and services at low cost, and are constrained in their ability to redistribute any surplus they may generate. In standard macroeconomic measures, they are classified into the business sector.
Community non-profit institutions include organisations that provide services such as community food services, community housing, emergency relief, religious organisations, advocacy, and sports and recreation. These organisations are not heavily influenced by the government and provide goods and services to households for free or at minimal cost. They are referred to as non-profit institutions serving households (NPISH) in standard macroeconomic measures.
Government non-profit institutions include hospitals, universities, and colleges. These organisations are self-governing and exist independently of the government, but are heavily influenced by it. They are classified as part of the government sector by conventional macroeconomic measures.
The satellite account provides estimates that are derived from various data sources, including administrative files (tax records), Statistics Canada’s Business Register, the Monthly Survey of Employment Payroll and Hours, and information from the public accounts.
It estimates gross domestic product, gross output, employment, transfers from the government, businesses, and households, transfers to other sectors, sales of goods and services, and expenditures on goods and services for each non-profit institution's subsector.
Annual estimates have been prepared from 2007 to 2020 and quarterly estimates have been added from 2009 to present. A provincial dimension has also been added to the annual account, while a human resources module (HRM) provides annual employment data by demographic as well as a provincial and territorial breakdown.
Using data from the Satellite Account of Non-profit Institutions and Volunteering, this article analyses non-profit GDP and employment for the 2010 to 2020 period. The article is organized as follows: Section 2 discusses results of the annual satellite account, Section 3 discusses estimates from the human resources module, and Section 4 concludes the article.
Annual Satellite Account of Non-profit Institutions
Gross domestic product of non-profit sector has been rising since 2010
The gross domestic product (GDP) of total non-profit institutions was $185.8 billion in 2020, representing 9.0% of Canada’s total GDP. GDP of the non-profit institutions serving the government (such as universities and hospitals) was $139.4 billion, which accounted for 75.0% of the overall non-profit institutions, and 6.7% of Canada’s total GDP. In 2020, community non-profits made up $29.9 billion or 1.4% of the total economy, while business non-profits accounted for the remaining $16.4 billion or 0.8% of the total economy.
The economic contribution of the non-profit sector differed by province and territory. Non-profit institutions contributed 12.4% to Nova Scotia's GDP in 2020, well above the national average of 9.0% and the highest share of any province or territory. Non-profits in Newfoundland and Labrador, Prince Edward Island, New Brunswick, Quebec, Manitoba, and the Northwest Territories all outpaced the national average. In 2020, non-profit institutions’ share of GDP was 3.4% of Nunavut’s economy-wide GDP—the lowest share in Canada. The non-profit sectors in Ontario, Saskatchewan, Alberta, British Columbia, and the Yukon were all below the national average when expressed as a percentage of total GDP.
In 2020, real GDP of non-profit institutions declined by 1.7%, while real GDP of the Canadian economy declined by 4.8%. The non-profit sector’s higher reliance on health care resulted in a stronger than average GDP in 2020, as resources shifted to combat COVID-19. Over the 2010 to 2020 period, real GDP of non-profit institutions outpaced that of the overall Canadian economy in five out of eleven years. The real GDP of non-profit institutions grew by an annual average of 1.9% over the eleven-year period, which was faster than the total economy (+1.5%).

Data table for Chart 1
| 2011 | 2012 | 2013 | 2014 | 2015 | 2016 | 2017 | 2018 | 2019 | 2020 | |
|---|---|---|---|---|---|---|---|---|---|---|
| annual percent change (2012=100) | ||||||||||
| Total economy | 3.1 | 1.6 | 2.4 | 2.9 | 0.6 | 0.8 | 3.5 | 3.2 | 1.9 | -4.8 |
| Total non-profit institutions | 2.6 | 2.3 | 1.8 | 1.9 | 3.1 | 2.1 | 0.8 | 2.6 | 2.9 | -1.7 |
| Source(s): Statistics Canada, tables 36-10-0222-01 and 36-10-0616-01. | ||||||||||
The sharp decrease in 2020 was a result of the COVID-19 pandemic, which was declared in March 2020. To prevent the virus from spreading, the government implemented measures, such as mandatory closures of non-essential business, travel limitations, physical distancing rules, the closure of Canada's international borders, along with a shift by many Canadians to working from home. These measures had the greatest impact on business non-profit institutions (-10.4%) in 2020, as membership fees declined and in-person services declined as well. The government's non-profit institutions real GDP fell by 0.3%, while the real GDP of community non-profits fell by 2.4% in 2020.
Between 2010 and 2020, real GDP of non-profit institutions increased by 20.1% on a cumulative basis, community non-profits grew faster than government non-profit institutions and business non-profit institutions.
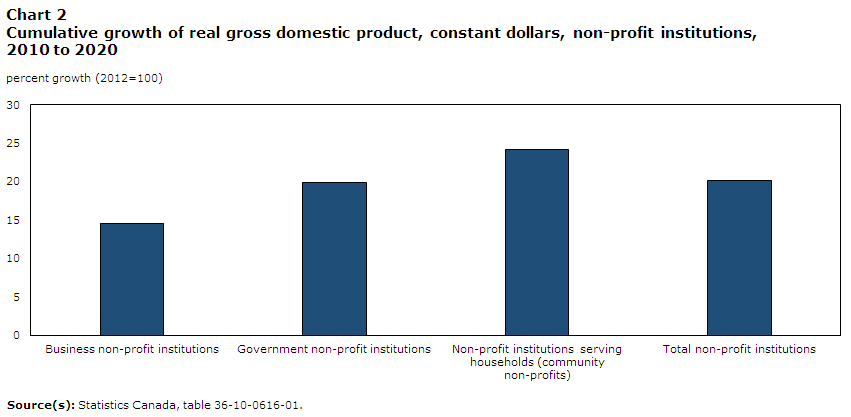
Data table for Chart 2
| 2010 to 2020 | |
|---|---|
| percent growth (2012=100) | |
| Business non-profit institutions | 14.5 |
| Government non-profit institutions | 19.9 |
| Non-profit institutions serving households (community non-profits) | 24.2 |
| Total non-profit institutions | 20.1 |
| Source(s): Statistics Canada, table 36-10-0616-01. | |
Employment declined in 2020
The COVID-19 pandemic had a significant negative impact on non-profit sector employment, as well as for the total economy. The number of jobs in non-profit institutions fell 4.6% to 2.4 million jobs in 2020, from 2.5 million jobs in 2019, compared with a decrease of 5.2% for the overall economy.
Government non-profit institutions accounted for 68.0% of total non-profit sector’s jobs in 2020, but were the least effected by the pandemic with employment in the sub-sector decreasing by 1.3% in 2020. Business non-profit institutions (-12.3%) and community non-profits (-10.6%) were the hardest hit by job losses in 2020 in the non-profit sector, facing a greater impact from government mandated closures. In 2020, business and community non-profits accounted for 7.5% and 24.5% of all non-profit institution jobs, respectively. Despite declines during the pandemic, employment in the non-profit sector grew by an annual average of 1.2% between 2010 and 2020, and outpaced the 0.5% average annual growth in employment for the overall economy.

Data table for Chart 3
| 2010 | 2011 | 2012 | 2013 | 2014 | 2015 | 2016 | 2017 | 2018 | 2019 | 2020 | |
|---|---|---|---|---|---|---|---|---|---|---|---|
| number of jobs in thousands | |||||||||||
| Business non-profit institutions | 166 | 176 | 179 | 184 | 185 | 198 | 202 | 201 | 203 | 204 | 179 |
| Government non-profit institutions | 1,451 | 1,467 | 1,477 | 1,501 | 1,519 | 1,535 | 1,555 | 1,557 | 1,614 | 1,656 | 1,634 |
| Non-profit institutions serving households (community non-profits) | 531 | 546 | 559 | 571 | 579 | 594 | 612 | 624 | 637 | 661 | 591 |
| Total non-profit institutions | 2,148 | 2,189 | 2,215 | 2,256 | 2,283 | 2,326 | 2,369 | 2,383 | 2,455 | 2,520 | 2,405 |
| Source(s): Statistics Canada, table 36-10-0617-01. | |||||||||||
The composition of the non-profit sector
In 2020, government non-profit institutions had the highest share of non-profit GDP (75.0%), followed by community non-profits (16.1%), while the GDP share of business non-profit institutions was 8.9%, the smallest share of non-profit GDP. These percentages have remained relatively stable since 2010.

Data table for Chart 4
| 2020 | |
|---|---|
| percent | |
| Business non-profit institutions | 8.9 |
| Government non-profit institutions | 75.0 |
| Non-profit institutions serving households (community non-profits) | 16.1 |
| Source(s): Statistics Canada, table 36-10-0616-01. | |
The economic profile of community non-profits
In 2020, GDP of the community non-profit sub-sector was $29.9 billion, representing 1.4% of the total economy. Over an eleven-year period, the real GDP of this subsector grew by 24.2%. Community non-profits provide goods and services in a variety of areas, including social services, advocacy, and culture.
In 2020, social services GDP accounted for one-fifth of GDP of non-profit institutions excluding government, while culture and recreation accounted for more than one-tenth of the non-profit sector' GDP, when excluding the government sub-sector.
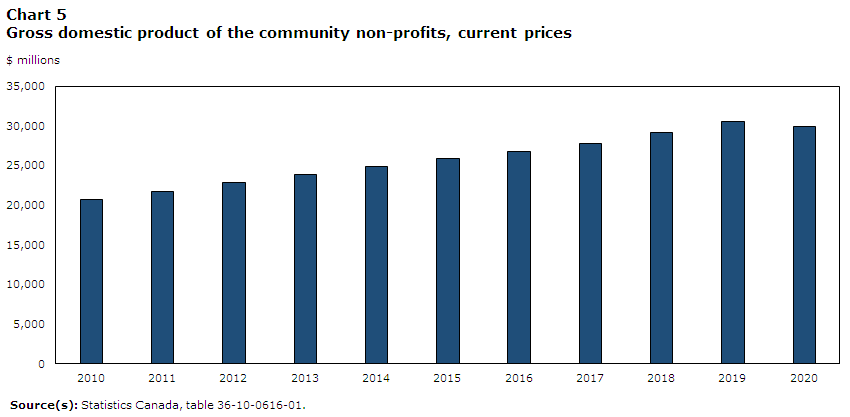
Data table for Chart 5
| 2010 | 2011 | 2012 | 2013 | 2014 | 2015 | 2016 | 2017 | 2018 | 2019 | 2020 | |
|---|---|---|---|---|---|---|---|---|---|---|---|
| $ millions | |||||||||||
| Non-profit institutions serving households (community non-profits) | 20,654 | 21,759 | 22,831 | 23,843 | 24,877 | 25,904 | 26,791 | 27,733 | 29,091 | 30,521 | 29,934 |
| Source(s): Statistics Canada, table 36-10-0616-01. | |||||||||||
Government non-profit institutions dominate the non-profit sector
In 2020, GDP of government non-profit institutions reached $139.4 billion, accounting for 6.7% of total GDP. Government non-profits are comprised of education and health activities. GDP of health activities in government non-profit institutions was $88.9 billion in 2020, accounting for 47.8% of total GDP of the whole non-profit sector. GDP of education activities in government non-profit institutions was valued at $50.5 billion in 2020, representing 27.2% of the sector's total GDP.
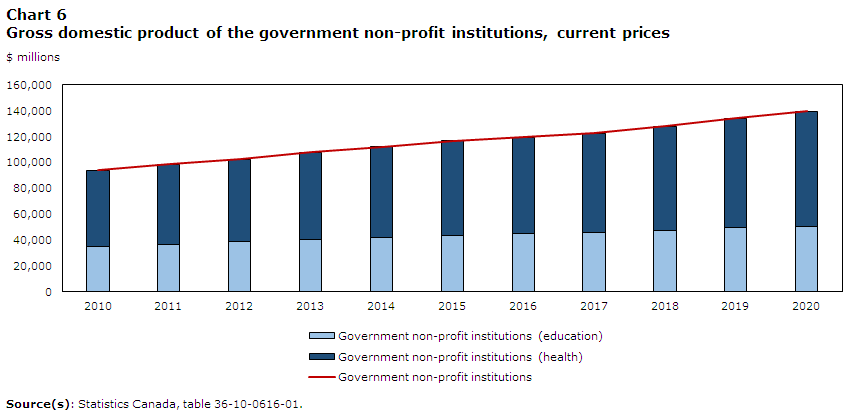
Data table for Chart 6
| 2010 | 2011 | 2012 | 2013 | 2014 | 2015 | 2016 | 2017 | 2018 | 2019 | 2020 | |
|---|---|---|---|---|---|---|---|---|---|---|---|
| $ millions | |||||||||||
| Government non-profit institutions | 93,750 | 98,590 | 102,444 | 107,668 | 111,924 | 116,748 | 119,632 | 122,479 | 127,844 | 134,060 | 139,393 |
| Government non-profit institutions (education) | 35,293 | 36,874 | 38,612 | 40,586 | 42,155 | 43,539 | 45,171 | 45,767 | 47,623 | 49,751 | 50,536 |
| Government non-profit institutions (health) | 58,457 | 61,716 | 63,832 | 67,082 | 69,769 | 73,209 | 74,461 | 76,712 | 80,221 | 84,309 | 88,857 |
| Source(s): Statistics Canada, table 36-10-0616-01. | |||||||||||
Business contributed the smallest share of GDP to the non-profit sector in 2020
In 2020, GDP of business non-profit institutions was $16.4 billion, representing 0.8% of the total economy. Business and professional associations and union activity comprise business non-profit institutions. The GDP share of business and professional associations and union activities accounted for 4.5% of the total non-profit sector and nearly one-fifth (19.6%) when excluding government non-profits in 2020.

Data table for Chart 7
| 2010 | 2011 | 2012 | 2013 | 2014 | 2015 | 2016 | 2017 | 2018 | 2019 | 2020 | |
|---|---|---|---|---|---|---|---|---|---|---|---|
| $ millions | |||||||||||
| Business non-profit institutions | 12,305 | 13,474 | 14,119 | 14,093 | 14,727 | 15,952 | 16,193 | 17,038 | 17,373 | 18,115 | 16,444 |
| Source(s): Statistics Canada, table 36-10-0616-01. | |||||||||||
Income in the non-profit sector has been rising since 2010
In 2020, total income in non-profit organizations was $316.2 billion, nearly doubling since 2010. The primary sources of income for non-profit organizations were government transfers and sales of goods and services. Current transfers from the government accounted for 55.7% of total income in 2020, up from 54.2% in 2010. In 2020, sales of goods and services accounted for 27.5% of total income, a decrease from 29.2% in 2010. Greater investment from governments and a decline in sales of goods and services during the pandemic resulted in this shift. Transfers from households, investment income, current transfers from other sectors, and income from membership fees made up 16.8% of total non-profit sector income in 2020, contributing $53.2 billion in total income.
Government non-profit institutions generated 61.8% of total income in 2020, accounting for the non-profit sector's largest share of total income, followed by community non-profits. The business non-profit sector made up 14.3% of total income, the smallest share of total income in the non-profit sector.
From 2010 to 2020, community non-profits (+4.4%) saw a faster annual average growth in income than government non-profit institutions (+4.2%) and business non-profit institutions (+4.0%). The rise in investment income over the years has been the primary driver of the faster income growth in community non-profits. Income in business non-profit institutions fell in 2020 (-1.3%). This decline was caused by the loss of income from membership fees as well as a slower increase in sales of goods and services, both of which were impacted by the government's COVID-19 control measures.
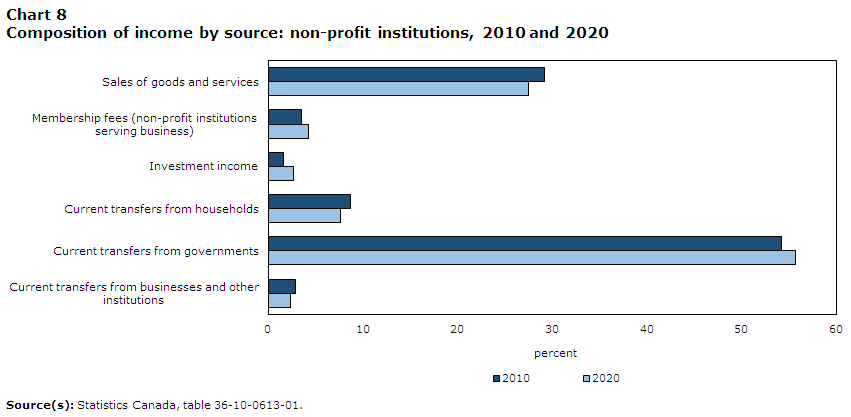
Data table for Chart 8
| 2010 | 2020 | |
|---|---|---|
| percent | ||
| Sales of goods and services | 29.2 | 27.5 |
| Membership fees (non-profit institutions serving business) | 3.5 | 4.2 |
| Investment income | 1.6 | 2.6 |
| Current transfers from households | 8.7 | 7.6 |
| Current transfers from governments | 54.2 | 55.7 |
| Current transfers from businesses and other institutions | 2.9 | 2.4 | Source(s): Statistics Canada, table 36-10-0613-01. |
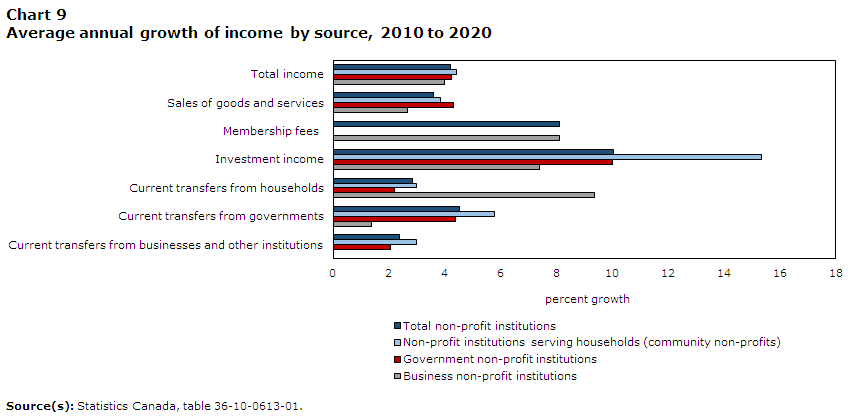
Data table for Chart 9
| Business non-profit institutions | Government non-profit institutions | Non-profit institutions serving households (community non-profits) | Total non-profit institutions | |
|---|---|---|---|---|
| percent growth | ||||
| Total income | 4.0 | 4.2 | 4.4 | 4.2 |
| Sales of goods and services | 2.6 | 4.3 | 3.8 | 3.6 |
| Membership fees | 8.1 | 0.0 | 0.0 | 8.1 |
| Investment income | 7.4 | 10.0 | 15.3 | 10.0 |
| Current transfers from households | 9.3 | 2.2 | 3.0 | 2.8 |
| Current transfers from governments | 1.4 | 4.4 | 5.8 | 4.5 |
| Current transfers from businesses and other institutions | 0.0 | 2.0 | 3.0 | 2.4 |
| Source(s): Statistics Canada, table 36-10-0613-01. | ||||
Income from membership fees in business non-profit institutions rose over the decade
Income from membership fees were generated by business non-profit institutions and contributed $13.3 billion to total income in 2020, almost doubling since 2010. Membership fees grew on average by 8.1% annually between 2010 and 2020. In 2020, membership fees contributed 29.4% to total income of business non-profit institutions, which represented 4.2% of the total income of all non-profit institutions.
Community non-profits generated more investment income than any other non-profit sub-sector
Investment income was $8.3 billion in non-profit institutions in 2020, up from $3.3 billion in 2010. Community non-profits received 53.4% of total investment income, contributing 5.8% to total income of the sub-sector in 2020. Business non-profit institutions generated the second largest portion of investment income, contributing 5.5% to its total income in 2020. In the same year, investment income contributed 0.7% to total income of the government non-profit sub-sector.
Investment income increased on average by 10.0% annually in the non-profit sector from 2010 to 2020. Over the eleven year period, investment income earned by community non-profits grew at a faster rate (+15.3%) than any other non-profit sub-sector.
The sales of goods and services have been a primary source of funds for business non-profit institutions over the years
Sales of goods and services generated $87.1 billion to total income of the non-profit sector, an increase of $25.7 billion since 2010. Government non-profit institutions generated the most funds from the sale of goods and services in the non-profit sector, contributing 19.8% of total government non-profit institutions income in 2020. Business non-profit institutions raised the second highest amount of money from the sale of goods and services in the non-profit sector, accounting for 63.2% of the total income of business non-profit institutions. Between 2010 and 2020, sales of goods and services grew an average of 3.6% per year in the non-profit sector.
Current transfers from businesses were generated by community non-profits and government non-profits institutions
Current business transfers were $7.6 billion for all non-profit institutions in 2020, up from $6.0 billion in 2010. In 2020, government non-profit institutions received 54.0% of current transfers from businesses, while community non-profit institutions received 46.0% of current transfers from businesses. In 2020, current transfers from businesses contributed 2.4% to the total income of the non-profit sector, 2.1% to the total income of the government non-profit subsector, and 4.6% to the total income of the community non-profit subsector. Between 2010 and 2020, current transfers from businesses (+2.4%) had the lowest average annual growth rate of any of the other income sources in the non-profit sector.
Non-profit institutions serving households remained the main recipients of household donations
Current transfers from households contributed $24.0 billion to total income in the non-profit sector in 2020, up from $18.3 billion in 2010. Community non-profits received 80.0% of total household donations to the sector, representing 25.5% of total community non-profit income in 2020. Government non-profit institutions received one-fifth of total household donations in 2020 while the remaining 0.9% went to business non-profit institutions. Between 2010 and 2020, transfers from household (+2.8%) had the smaller average annual growth rate than the majors’ source of income.

Data table for Chart 10
| 2020 | ||
|---|---|---|
| millions of dollars | percent | |
| Business non-profit institutions | 211 | 0.9 |
| Government non-profit institutions | 4,586 | 19.1 |
| Non-profit institutions serving households (community non-profits) | 19,241 | 80.0 |
|
Note(s): Transfers are in millions of dollars. Source(s): Statistics Canada, table 36-10-0613-01. |
||
The majority of government transfers came from the provincial government
Current transfers from the government to non-profit institutions were $176.0 billion in 2020, an increase of 54.4% since 2010. The largest transfers from the government came from the provincial government, while local governments contributed the least to non-profit institutions. The largest proportion of the government transfers went to government non-profit institutions, accounting for 75.1% of total income in the government non-profit sub-sector in 2020. Community non-profits received the second largest proportion of transfers from the government, representing 37.9% of total income in community non-profits in 2020. Current transfers from government accounted for 1.5% of total income in business non-profit institutions.
Current transfers from the government increased on average by 4.5% annually in the non-profit sector between 2010 and 2020. Community non-profits saw the fastest annual average increase of current transfers from the government.
Health, education and research activities dominated the non-profit sectorNote
Total income in non-profit organizations was $316.2 billion in 2020, which increased by 50.3% since 2010. In the non-profit sector, health as well as education and research activities accounted for nearly two-thirds of total income, 42.2% and 19.6% respectively. Between 2010 and 2020, that share has remained relatively constant. The remaining total income was allocated to various other activities, such as social services, business and professional activities, culture and recreation, development and housing, and religion.
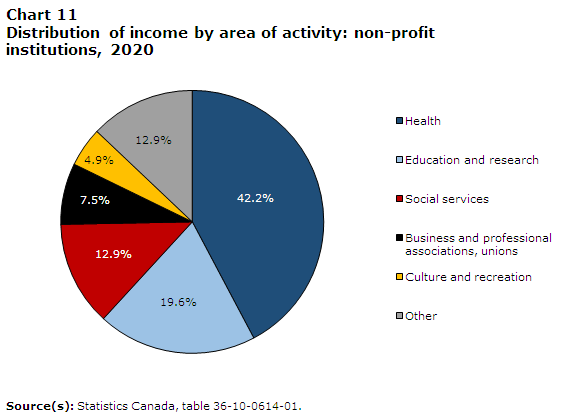
Data table for Chart 11
| 2020 | |
|---|---|
| percent | |
| Health | 42.2 |
| Education and research | 19.6 |
| Social services | 12.9 |
| Business and professional associations, unions | 7.5 |
| Culture and recreation | 4.9 |
| Other | 12.9 |
| Source(s): Statistics Canada, table 36-10-0614-01. | |
In 2020, health activities had the largest amount of income among non-profit institution activities. That year, health activities generated $133.6 billion of income, which was up from $85.8 billion in 2010. In general, health activities made up 41% of the non-profit sector's income over the past 11 years.
Education and research generated the second largest share of income in non-profit institutions, receiving $61.9 billion in 2020, up from $43.9 billion in 2010. Between 2010 and 2020, this activity generated an average of 21.0% of the income in non-profit institutions.
Another significant activity of non-profit organizations is social services, which generated $40.7 billion in income in 2020, almost doubling the level recorded in 2010. This activity accounted for an average of 11.8% of the income in the non-profit sector over the eleven-year period.
Average annual income in activities that were not elsewhere classified (+5.8%), law, advocacy, and politics (+5.4%), and social services (+5.3%) grew the fastest between 2010 and 2020, while development and housing (+3.1%), and culture and recreation (+2.2%) grew the slowest.
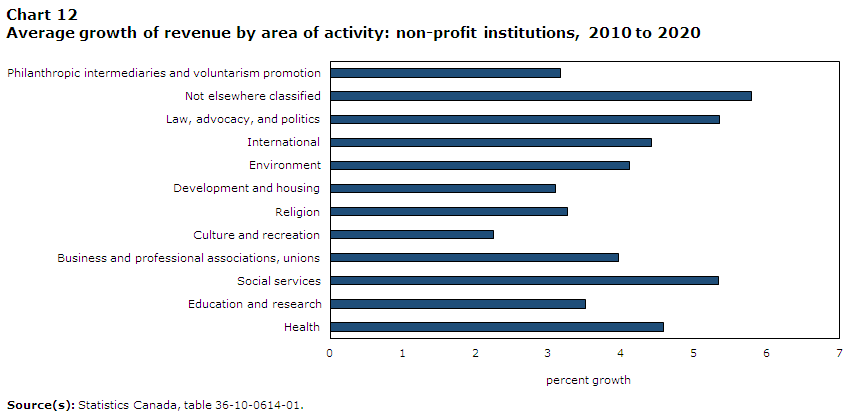
Data table for Chart 12
| Annual average | |
|---|---|
| percent growth | |
| Philanthropic intermediaries and voluntarism promotion | 3.2 |
| Not elsewhere classified | 5.8 |
| Law, advocacy, and politics | 5.4 |
| International | 4.4 |
| Environment | 4.1 |
| Development and housing | 3.1 |
| Religion | 3.3 |
| Culture and recreation | 2.2 |
| Business and professional associations, unions | 4.0 |
| Social services | 5.3 |
| Education and research | 3.5 |
| Health | 4.6 |
| Source(s): Statistics Canada, table 36-10-0614-01. | |
Government non-profit organizations spent more on wages than other non-profit institutions
Total outlays for non-profit institutions reached $278.6 billion in 2020, up from $ 197.3 billion in 2010. Gross current expenditure on goods and services accounted for 93.6% of total outlays, remaining relatively constant since 2010. Current transfers to other sectors accounted for 6.4% of total outlays in 2020 and have remained the same since 2010.
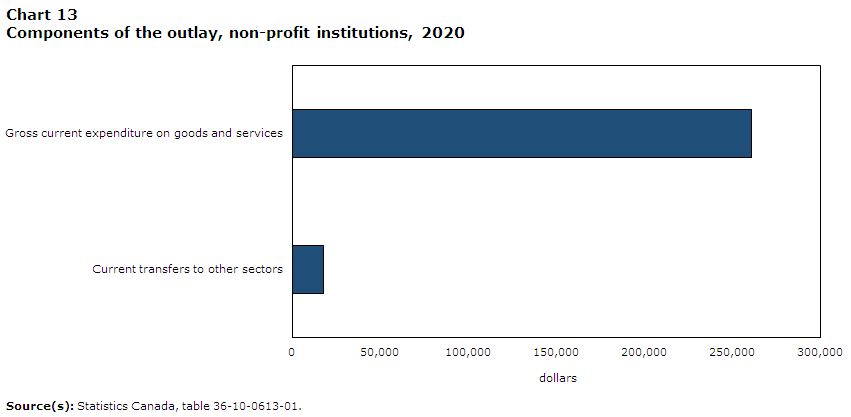
Data table for Chart 13
| 2020 | |
|---|---|
| dollars | |
| Current transfers to other sectors | 17,773 |
| Gross current expenditure on goods and services | 260,867 |
| Source(s): Statistics Canada, table 36-10-0613-01. | |
The share of operating expenses greatly differed between non-profits serving governments, non-profits serving businesses, and community non-profits. In 2020, labour compensation accounted for the largest share of operating expenses for non-profit institutions serving governments. Nearly sixty percent of operating expenses were recorded in employee wages and salaries in 2020, followed by intermediate purchases, which represented nearly one-third of expenses.
For non-profit institutions excluding governments, over half of the operating expenses were recorded as intermediate purchases of goods and services, followed by labour compensation, which represented 45.5% of total operating expenses.
Between 2010 and 2020, the composition of operating expenses remained relatively stable for each of the non-profit institutions subsectors. The expenses of community non-profit institutions (+4.1%) grew faster on average annually than those of government non-profit institutions (+3.8%) and business non-profit institutions (+0.5%).
Human Resources Module
This section presents the latest data on employment in the non-profit sector by type of worker and by demographic characteristic from 2010 to 2019 in Canada, and by province and territory.
In 2019, non-profit institutions accounted for approximately 2.2 million full-time jobs and over two-hundred thousand part-time jobs in Canada, an overall increase of 15.6% from 2010. Each of the provinces and territories recorded an increase in the number of employees working in the non-profit sector from 2010 to 2019. The largest number of jobs were added in Ontario, Quebec, Alberta, and British Columbia. Northwest Territories (+35.3%) and Yukon (+31.7%) recorded the highest relative percentage increases, while Newfoundland and Labrador (+1.6%) saw the smallest increase, from 2010 to 2019.
By subsector, government non-profit institutions made up 65.0% of total jobs in the non-profit sector in 2019, followed by community non-profits (26.6%), and business non-profits (8.4%).
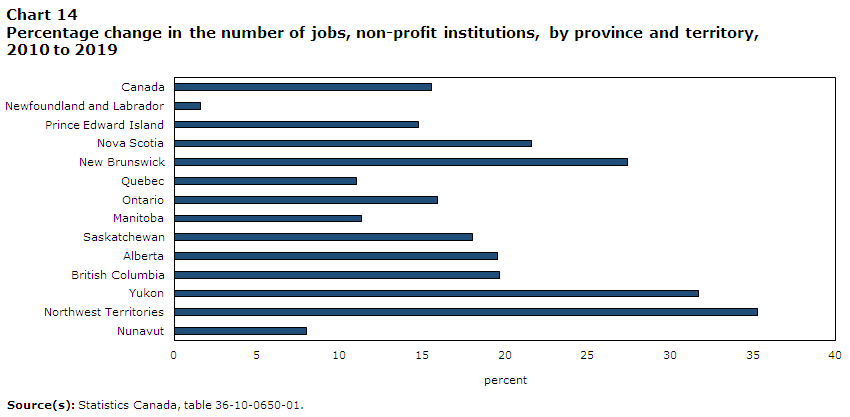
Data table for Chart 14
| 2010-2019 | |
|---|---|
| percent | |
| Canada | 15.6 |
| Newfoundland and Labrador | 1.6 |
| Prince Edward Island | 14.8 |
| Nova Scotia | 21.6 |
| New Brunswick | 27.4 |
| Quebec | 11.0 |
| Ontario | 15.9 |
| Manitoba | 11.3 |
| Saskatchewan | 18.0 |
| Alberta | 19.5 |
| British Columbia | 19.7 |
| Yukon | 31.7 |
| Northwest Territories | 35.3 |
| Nunavut | 8.0 |
| Source(s): Statistics Canada, table 36-10-0650-01. | |
Females were employed in larger numbers than males in non-profit institutions
In 2019, women held over three-quarters of non-profit jobs in Canada, a level that has remained stable since 2010. By sub-sector, women held 79.3% of the jobs in government non-profit institutions, 76.9% of the total jobs in community non-profits, and 58.8% in business non-profit institutions.
The province with the highest share of female employment in 2019 was Prince Edward Island, representing over eighty percent of the jobs in non-profit institutions. The province with the lowest percentage of female jobs was Nova Scotia, accounting for 68.5%.
Between 2010 and 2019, females' annual average wages and salaries in non-profit institutions increased faster than males'. In 2019, female employees earned an average annual wage of $46,950, up 20.3% from 2010. Male employees earned an annual average wage of $59,703, an increase of 8.3% from 2010.
The wage gap between males and females in non-profit institutions has narrowed slightly between 2010 and 2019, from an average of $16,127 per year in 2010 to $12,127 per year in 2019. The gender wage gap was greatest in government non-profit institutions, with male employees earning $16,303 more per year on average than female employees in 2019.
In 2019, government non-profit institutions ($51,290) had the highest average annual wage for females, while community non-profits ($36,940) had the lowest. Female employees' average annual wages and salaries ($46,950) in non-profit institutions were lower than female employees' average annual wages and salaries ($49,886) across all industries in Canada in 2019. Additionally, male employees ($59,703) at non-profit organizations earned less than the national average for male employees ($64,514) across all industries for the same year.
Between 2010 and 2019, the provinces of Prince Edward Island (+25.3%) and Quebec (+24.7%) saw the fastest average annual wage growth for women in non-profit institutions, while Nova Scotia (10.9%) saw the slowest wage growth. Male employees in New Brunswick (+29.3%) experienced the fastest annual wage growth in the non-profit sector between 2010 and 2019, while male employees in Prince Edward Island (-12.1%) recorded wage declines over the same time period.
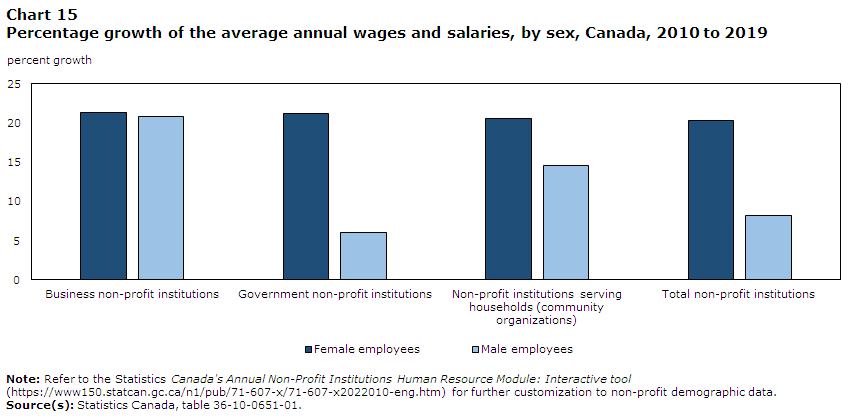
Data table for Chart 15
| Female employees | Male employees | |
|---|---|---|
| percent growth | ||
| Business non-profit institutions | 21.3 | 20.9 |
| Government non-profit institutions | 21.2 | 6.0 |
| Non-profit institutions serving households (community organizations) | 20.6 | 14.5 |
| Total non-profit institutions | 20.3 | 8.3 |
|
Note: Refer to the Statistics Canada's Annual Non-Profit Institutions Human Resource Module: Interactive tool for further customization to non-profit demographic data. Source(s): Statistics Canada, table 36-10-0651-01. |
||
The majority of the workers in non-profit organizations were college and university graduates
Throughout the decade, the majority of the workers in non-profit organizations were college and university graduates. In 2019, college graduates represented 34.4% of total non-profit employees and individuals with a university degree and higher represented 33.8%. Individuals with a high school diploma or less represented 24.7% of total employees in 2019, down from 25.9% of jobs in 2010. By sub-sector, business non-profit-institutions had the highest share of employees with a high school diploma or less, accounting for 36.7% of the jobs in 2019.

Data table for Chart 16
| 2010 | 2019 | |
|---|---|---|
| percent | ||
| University degree and higher | 31.5 | 33.8 |
| College diploma | 33.9 | 34.4 |
| Trade certificate | 8.7 | 7.1 |
| High school diploma and less | 25.9 | 24.7 |
| Source(s): Statistics Canada, table 36-10-0651-01. | ||
Individuals with university degrees and higher ($60,491) earned the highest average annual wages and salaries in 2019, up from $52,646 in 2010, an increase of 14.9%. Individuals with a high school diploma ($37,810) had the lowest average annual wages and salaries in 2019, up 18.5% since 2010. For university graduates compared with high school graduates, the wage gap has widened from an average of $20,738 per year in 2010 to $22,681 in 2019. By comparison with the total economy, the non-profit sector's average annual wage and salary by education was lower than the average annual wage and salary by education across all industries in 2019. Individuals with trade certificates ($47,532) in non-profit institutions had the largest gap of average annual wages and salaries compared to individuals with trade certificates ($58,413) across all industries.

Data table for Chart 17
| 2010 to 2019 | |
|---|---|
| percent growth | |
| High school diploma and less | 18.5 |
| Trade certificate | 13.6 |
| College diploma | 15.9 |
| University degree and higher | 14.9 |
| Source(s): Statistics Canada, table 36-10-0651-01. | |
Canadian territories had higher average annual wages and salaries than the provinces when broken down by education level in the non-profit sector, possibly reflecting a higher cost of living in northern Canada. Nunavut ($93,588) and Northwest territories ($77,483) had the highest average annual wages and salaries for individuals with university and higher degree in 2019, while Nova Scotia ($55,753) and Manitoba ($55,195) had the lowest.
Over time, the workforce composition in the non-profit sector has aged
Individuals aged 35 to 44 years old held 21.9% of total jobs in non-profit institutions in 2019, more than any other age group. Individuals aged 45 to 55 years old held the second highest share of non-profit jobs, at 21.5%. The workforce in non-profit institutions has also been aging over time. In 2019, the proportion of employees aged 55 and older was 22.7%, up from 19.5% in 2010. Moreover, the number of workers aged 65 and up increased by 80.2% between 2010 and 2019.
In 2019, the highest share of workers aged 65 and older in non-profit industries was observed in Prince Edward Island and Nova Scotia, representing 9.6% and 7.6%, respectively. Quebec and Ontario had the lowest share, accounting for 3.5% and 4.3%, respectively.

Data table for Chart 18
| 2010 | 2019 | |
|---|---|---|
| percent | ||
| 15 to 24 years | 13.2 | 12.5 |
| 25 to 34 years | 21.0 | 21.4 |
| 35 to 44 years | 21.6 | 21.9 |
| 45 to 54 years | 24.7 | 21.5 |
| 55 to 64 years | 16.5 | 18.0 |
| 65 years old and over | 3.0 | 4.7 |
| Source(s): Statistics Canada, table 36-10-0651-01. | ||
Workers aged 65 and older earned the highest average annual wages and salaries in 2019 ($60,216), which was moderately lower than the average annual wages and salaries of employees aged 65 and older ($61,646) across all industries. Workers aged 15 to 24 years old earned the lowest average annual wages and salaries ($29,342) in 2019. Between 2010 and 2019, the age group with the fastest annual wage growth (+19.1%) was workers aged 35 to 44 years old, while the age group with the slowest annual wage growth (+13.1%) was workers aged 25 to 34 years old.
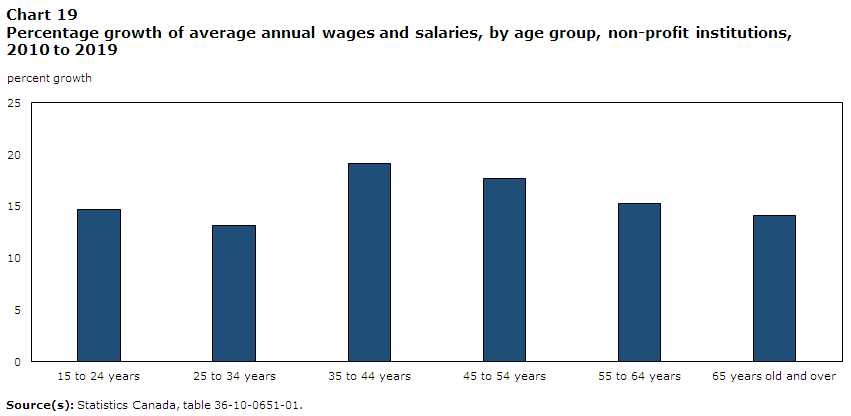
Data table for Chart 19
| 2010 to 2019 | |
|---|---|
| percent growth | |
| 15 to 24 years | 14.7 |
| 25 to 34 years | 13.2 |
| 35 to 44 years | 19.1 |
| 45 to 54 years | 17.7 |
| 55 to 64 years | 15.3 |
| 65 years old and over | 14.1 |
| Source(s): Statistics Canada, table 36-10-0651-01. | |
Visible minority employment is on the rise in non-profit institutions
From 2010 to 2019, the workforce in non-profit institutions has become increasingly diverse. The share of the number of jobs held by individuals who identified as a visible minority was 22.5% in 2010 and 28.6% in 2019. The Canadian territories had the highest percentage of visible minority employees in non-profit institutions in 2019, with 78.3% of employees in Nunavut and 50.3% of employees in the Northwest Territories identifying as a visible minority. The province with the largest proportion of visible minority employees was Manitoba, at 38.8%, while Prince Edwards Island had the lowest percentage, at 4.6%.
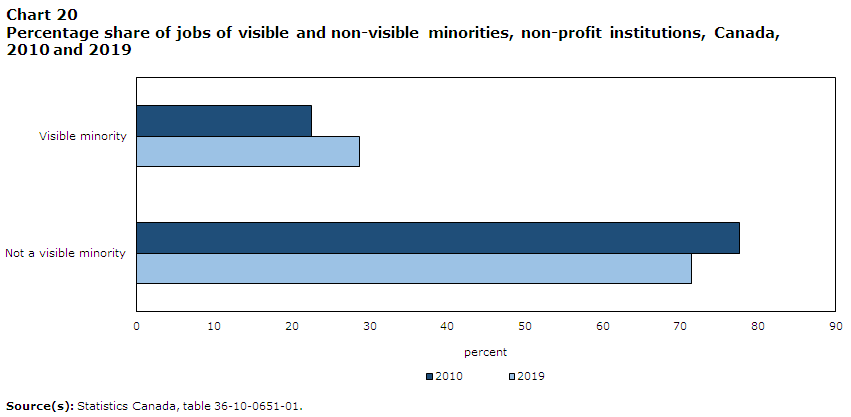
Data table for Chart 20
| 2010 | 2019 | |
|---|---|---|
| percent | ||
| Visible minority | 22.5 | 28.6 |
| Not a visible minority | 77.5 | 71.4 |
| Source(s): Statistics Canada, table 36-10-0651-01. | ||
In 2019, visible minority employees in non-profit organizations earned an average annual wage and salary of $50,868 in Canada, slightly higher than the annual wage and salary for visible minority employees across all industries. The average annual wage and salary of visible minority employees in the non-profit sector increased by 12.0% between 2010 and 2019. Non-visible minority employees earned an average annual wage and salary of $49,502 in the non-profit sector in 2019, lower than the average annual wage and salary of visible minority employees, and representing an 18.1% increase since 2010. When compared to visible minority employees, non-visible minority employees had a higher average annual wage growth over the last decade.
Visible minority employees in business and community non-profit institutions earned lower average annual wages and salaries than non-visible minority employees. In contrast, visible minority employees in government non-profit institutions earned more than non-visible minority employees.

Data table for Chart 21
| Not a visible minority | Visible minority | |
|---|---|---|
| percent growth | ||
| Total non-profit institutions | 18.1 | 12.0 |
| Non-profit institutions serving households (community organizations) | 20.4 | 16.5 |
| Government non-profit institutions | 18.1 | 10.6 |
| Business non-profit institutions | 22.7 | 18.6 |
| Source(s): Statistics Canada, table 36-10-0651-01. | ||
Nearly half of all non-profit jobs were held by immigrants in 2019
Immigrant workers accounted for 47.9% of all jobs in non-profit organisations in 2019, up from 41.8% in 2010. Community non-profit institutions had the highest percentage of immigrant employees at 54.7%, followed by business non-profit institutions while government non-profit institutions had the lowest share.
By province, Ontario had the most immigrant employees and the highest share of immigrant employees, at 59.9%, while Prince Edwards Island had the lowest share of immigrant employees, representing 6.2%.
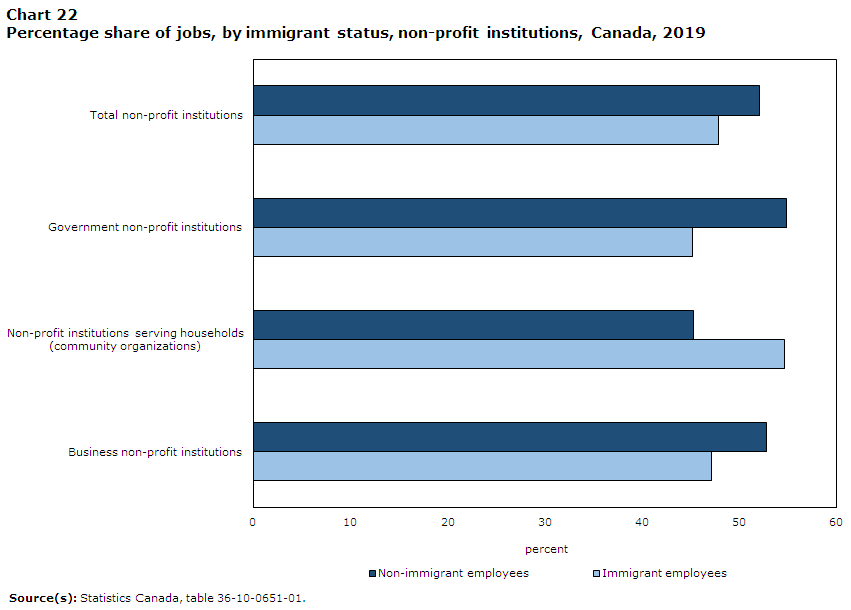
Data table for Chart 22
| Immigrant employees | Non-immigrant employees | |
|---|---|---|
| percent | ||
| Total non-profit institutions | 47.9 | 52.1 |
| Government non-profit institutions | 45.2 | 54.8 |
| Non-profit institutions serving households (community organizations) | 54.7 | 45.3 |
| Business non-profit institutions | 47.2 | 52.8 |
| Source(s): Statistics Canada, table 36-10-0651-01. | ||
Immigrant employees in non-profit institutions received an average annual wage and salary of $52,652 in 2019, which was less than the average annual wage and salary of immigrant employees across all industries in Canada ($57,671) and represented a 14.7% increase from 2010. Non-immigrant employees earned an average annual wage and salary of $47,360 in 2019, a 17.2% increase since 2010. Wages have grown at a quicker pace for non-immigrant employees than for immigrant employees between 2010 and 2019, although average wages remain higher for immigrant employees.

Data table for Chart 23
| Immigrant employees | Non-immigrant employees | |
|---|---|---|
| percent growth | ||
| Business non-profit institutions | 18.0 | 22.8 |
| Non-profit institutions serving households (community organizations) | 18.5 | 18.8 |
| Government non-profit institutions | 13.4 | 17.4 |
| Total non-profit institutions | 14.7 | 17.2 |
| Source(s): Statistics Canada, table 36-10-0651-01. | ||
Indigenous workers have increased in non-profit organizations since 2010
Indigenous employees made up 5.1% of non-profit employees in 2019, up from 4.2% in 2010. By sub-sector, government non-profit institutions had the highest percentage of indigenous employees at 5.4%, while business non-profit institutions had the lowest percentage, at 3.8%.
The Canadian territories had the highest percentage of indigenous employees in non-profit institutions in 2019, with 74.7% of employees in Nunavut and 33.0% of employees in the Northwest Territories identifying as indigenous. By province, Manitoba (15.0%) and Saskatchewan (11.6%) had the highest share of indigenous workers, while Prince Edward Island, Quebec, and Ontario, had 1.1%, 2.9% and 3.5%, respectively, accounting for the lowest shares.
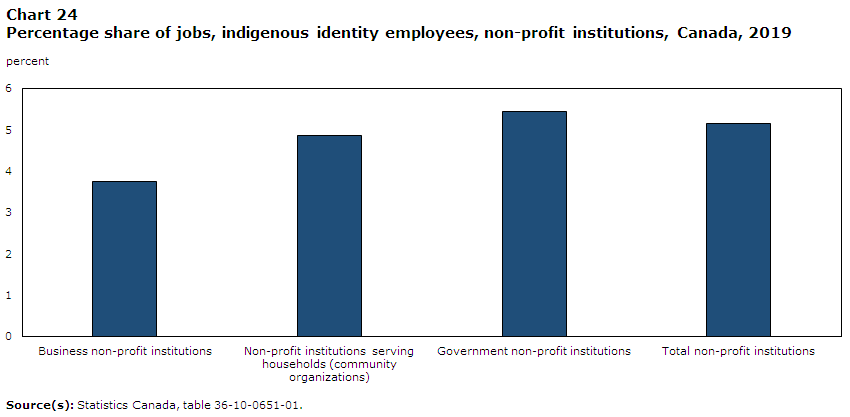
Data table for Chart 24
| 2019 | |
|---|---|
| percent | |
| Business non-profit institutions | 3.8 |
| Non-profit institutions serving households (community organizations) | 4.9 |
| Government non-profit institutions | 5.4 |
| Total non-profit institutions | 5.1 |
| Source(s): Statistics Canada, table 36-10-0651-01. | |
Indigenous employees in non-profit organizations earned an average annual wage and salary of $51,837 in 2019, which was above the annual average wage and salary for indigenous employees ($50,490) across all industries in Canada and marked a 12.8% increase from 2010. Non-indigenous employees earned an average annual wage and salary of $49,787 in the non-profit sector in 2019, below the average annual wage of indigenous employees, and a 16.9% increase since 2010. When compared to indigenous employees, non-indigenous employees had a higher average annual wage growth. By subsector, indigenous workers ($39,957) earned more in average annual wages and salaries than non-indigenous workers ($38,675) in community non-profits in 2019.
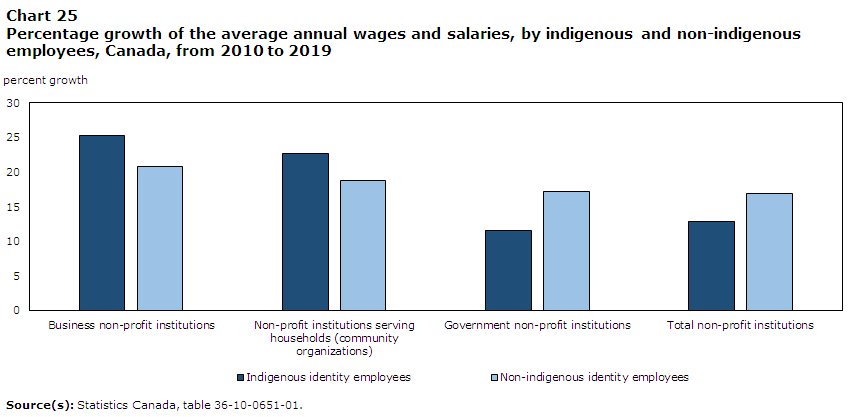
Data table for Chart 25
| Indigenous identity employees | Non-indigenous identity employees | |
|---|---|---|
| percent growth | ||
| Business non-profit institutions | 25.3 | 20.8 |
| Non-profit institutions serving households (community organizations) | 22.6 | 18.8 |
| Government non-profit institutions | 11.6 | 17.2 |
| Total non-profit institutions | 12.8 | 16.9 |
| Source(s): Statistics Canada, table 36-10-0651-01. | ||
Conclusion
Non-profit institutions make a significant contribution to the Canadian economy and also play an important role in providing services and improving the well-being of Canadians. The Satellite Account of Non-profit Institutions and Volunteering sheds light on the economic dimensions of the sector that were previously invisible in the existing National Accounts framework. The results of the Satellite Account revealed that non-profit institutions in Canada accounted for 9.0% of the country's total GDP in 2020 when including government non-profits and 2.2% when excluding them. The contribution of the non-profit sector to economic activity varied by province and territory.
Non-profit institutions are dominated by government non-profit institutions, such as hospitals, universities, and colleges. These organizations contributed two-thirds of the sector’s GDP in 2020. Business and community non-profit institutions span a diverse range of fields, such as social services, business and professional activities, culture and recreation, development and housing, religion, and others, contributing to one-third of the sector’s GDP in 2020.
In terms of total income, government non-profit institutions generated most of the non-profit sector's income, with a large portion of income coming from government current transfers, particularly at the provincial level, and from sales of goods and services.
Community non-profits generated the second largest portion of income, which came from diverse sources of revenues, with transfers from the government remaining their top contributor. The community non-profit sub-sector remained the primary recipient of transfers from households.
Business non-profit institutions generated the least amount of income in the non-profit sector, with a large portion of income coming from sales of goods and services. They were also the main recipients of income from membership fees.
Labour compensation accounts for the majority of current non-profit expenditure, particularly for government non-profit institutions. In contrast, intermediate purchases of goods and services account for the majority of total expenses in business non-profit institutions.
By 2019, the human resource modules revealed that non-profit institutions accounted for 2.2 million full-time jobs and over two hundred thousand part-time jobs in Canada. When excluding government non-profits, the sector employed approximately 630,000 full-time employees and 238,000 part-time employees.
Throughout the last decade, women held three-quarters of the non-profit jobs in Canada. However, the average annual salaries of women remained lower than males’ average annual wages, but have increased faster since 2010.
By education level, the majority of the workers in non-profit organizations were college and university graduates, representing over 65% of total non-profit employees—individuals with university degrees earned on average more than any other education group.
Over time, the workforce composition in the non-profit sector has aged, with workers aged 55 and older representing more than 20% of the workforce in 2019. Specifically, the number of workers aged 65 and older rose by 80.2% from 2010 to 2019, as seniors contributed significantly to employment growth. Annual wages and salaries have increased for each group, with workers aged 35 to 44 years seeing the fastest increases.
The share of the number of jobs held by individuals who identified as a visible minority was 22.5% in 2010 and 28.6% in 2019. Growth in wages for non-visible minorities has outpaced wage growth for visible minorities. In 2019, visible minority employees earned lower average annual wages and salaries than non-visible minority employees in business and community non-profit institutions, while visible minority employees earned higher in government non-profit institutions.
Immigrant workers accounted for 47.9% of all jobs in non-profit organisations in 2019, up from 41.8% in 2010. Wages have grown at a quicker pace for non-immigrant employees than for immigrant employees over the same time period, with non-immigrant average annual wages increasing 17.2% compared with 14.7% for immigrant workers.
The share of indigenous employees in non-profit organizations rose from 4.2% in 2010 to 5.1% in 2019, with the majority of the higher share attributable to an increase in Indigenous workers for government non-profit institutions. Non-indigenous annual wages have risen more quickly than those of indigenous employees over the last decade in the non-profit sector.
Appendix: Glossary of main terms
Capital consumption allowances
Allowances for the using up of fixed capital in the production process. Also referred to as depreciation expense.
Constant dollars
Refers to dollars of several years expressed in terms of their value ("purchasing power") in a single year, called the base year. This type of adjustment is done to eliminate the impact of widespread price changes.
Constant prices
Refer to constant dollars.
Current dollars
Refer to current prices.
Current expenditure
Expenses on current production (operating expenses) and current transfers to other sectors.
Current prices
Transactions, assets or liabilities are said to be expressed in current prices if the prices used in their valuation are the prices prevailing in the period of observation; that is both the quantity and the price components of the value series relate to the current period. Period-to-period changes in current price values may reflect changes in both quantities and prices.
Current transfers
Unilateral transfers between transactors for which there is no good or service provided in return. Household transfers to the non-profit sector are payments in the form of charitable donations. Governments transfers are in the form of grants.
Gross domestic product (GDP)
The total unduplicated value of goods and services produced during a given period. For the economy as a whole, GDP refers to all goods and services produced in Canada's economic territory. For the non-profit sector specifically, it refers to the sector's contribution to Canada's GDP, and is measured as its gross output less its intermediate purchases. Also referred to as value added, or economic activity.
Gross operating surplus
The surplus or deficit accruing from market production of non-profit institutions. Includes capital consumption allowances.
Gross output
The total value of gross production of goods and services by the non-profit sector, before the deduction of intermediate purchases.
Intermediate purchases
The value of goods and services used as inputs to a production process. The goods or services may be either transformed or used up in production. Excludes additions of fixed assets whose consumption is recorded as capital consumption allowances.
Investment income
Interest, dividends and other investment income received on assets held by the non-profit sector.
Membership fees
Memberships, dues and association fees received by business non-profit institutions.
Net indirect taxes on factors of production
Taxes less subsidies that apply to the employment of labour and ownership or use of land, structures and other assets used for production purposes.
Nominal gross domestic product
Gross domestic product at current price.
Operating expenses
Wages, salaries and supplementary labour income, intermediate purchases, capital consumption allowances and net indirect taxes on factors of production.
Other operating surplus
Operating surplus less capital consumption allowances. Also called net operating surplus.
Outlays
Equals current expenditure or expenses.
Real gross domestic product
Gross domestic product at constant dollars or at constant prices.
Sales of goods and services
Receipts derived from the sale of goods or the provision of services offered for sale in the course of operations. Receipts from charitable gaming, rental income and sales to government are included in this item.
Satellite account
Supplementary statistics that allow analysis of a particular aspect of the economy, such as statistic on non-profit sector.
Wages, salaries and supplementary labour income
Remuneration paid to employees in return for work done. Includes employers' social contributions, such as contributions to Employment Insurance, pension plans, workers' compensation, health and dental insurance schemes and disability insurance. Also referred to as compensation of employees or paid labour compensation.
- Date modified: