
Latest Developments in the Canadian Economic Accounts
An overview of revisions to the Financial and Wealth Accounts, 1990 to 2019

Archived Content
Information identified as archived is provided for reference, research or recordkeeping purposes. It is not subject to the Government of Canada Web Standards and has not been altered or updated since it was archived. Please "contact us" to request a format other than those available.
Background
Statistical revisions are carried out regularly in the Canadian System of Macroeconomic Accounts (CSMA) to incorporate the most current information available. Generally, these revisions are limited to the months or quarters within a given reference year, or, on an annual basis, to the preceding two to three years.
Periodically, comprehensive revisions are conducted, which generally entail revisions beyond the scope of the standard revision window. These provide an opportunity to enhance estimation methods and incorporate improved data sources and concepts.
A number of comprehensive revisions were incorporated in the third quarter 2019 release of the Financial and Wealth Accounts (FWA), which is comprised of the Financial Flow Accounts (FFA), the Other Changes in Assets Account (OCAA) and the National Balance Sheet Accounts (NBSA), and which represents an integrated set of accounts within the larger Canadian System of Macroeconomic Accounts (CSMA). The revisions were carried back to 1990 for certain instruments and sectors.
There were three main sources of revisions with the third quarter 2019 release of the FWA: the incorporation of new financial sectors, which resulted in new and restructured financial sub-sectors; the inclusion of additional instruments into a from-whom-to-whom (FWTW) framework; and statistical revisions arising from updates to specific concepts and methodologies. Altogether, these updates further align the FWA to international guidelines for compiling national accounts such as the System of National Accounts 2008 (SNA2008).
Extension to the existing classification of financial sectors
The FWA publishes a detailed set of accounts by institutional sector. The coverage of these sectors is comprehensive and greatly expands upon the five main institutional sectors that make up the domestic economy, namely non-financial corporations, financial corporations, general government, non-profit institutions serving households, and households. A detailed delineation of sub-sectors exists within the financial corporations sector. This is in recognition of their crucial role in the financial system at large and in their capacity as financial intermediaries and repositories of wealth.
The sector classification standard currently used in the CSMA is the Canadian Classification of Institutional Units and Sectors 2012 (CCIUS2012). This classification reflects many particularities of the Canadian economy and deviates to a degree from the SNA2008 recommendations. While the sector classification used in the FWA is generally aligned with the recommended Canadian and international standards, notable differences exist.
As a result, to improve sectoring within the FWA, selected financial sectors were re-aligned with the internationally standardized nomenclature and a catch-all sector was decomposed into more distinct and analytically useful sub-sectors where distinctive business models and intermediation activities could be better isolated. This will increase the analytical usefulness and transparency of the estimates by providing better distinctions between entities based on the risk they assume and the role they serve in the financial system. Additionally, many domestic and international stakeholders including policy makers, government departments and agencies, and international organizations require more detailed information to better understand and identify financial vulnerabilities within the financial system. More precise sector delineations help support these goals.
Table 1 presents the current classification of financial sectors used in the FWA, highlighting where changes have been made. Specifically, the previous sector “Other financial institutions” has been decomposed into four new sub-sectors. “Sales, finance and consumer loan companies” now includes other non-depository intermediaries and has been renamed to “Financial corporations engaged in lending”. “Asset-backed securities” has been re-titled “Financial vehicle corporations engaged in securitization transactions”. Finally, certain sectors have been grouped under the new aggregate “Other financial intermediaries, except insurance corporations and pension funds”.
| New sector classification for Financial corporations | Summary of changes |
|---|---|
| Financial corporations | No changes |
| Total monetary authorities | No changes |
| Total chartered banks and quasi-banks | No changes |
| Chartered banks | No changes |
| Quasi-banks | No changes |
| Insurance and pension funds | No changes |
| Life insurance business | No changes |
| Segregated funds of life insurance companies | No changes |
| Trusteed pension plans | No changes |
| Property and casualty insurance companies | No changes |
| Total other private financial institutions | No changes |
| Mutual funds | Improved coverage of closed-end funds |
| Money market funds | No changes |
| Other mutual funds | Improved coverage of closed-end funds |
| Other financial intermediaries, except insurance corporations and pension funds | New aggregation of sub-sectors |
| Financial vehicle corporations engaged in securitization transactions | Renamed from ''Issuers of asset-backed securities'' |
| Financial corporations engaged in lending | Renamed from “Sales, finance and consumer loan companies” and expanded to include other non-depository credit intermediaries. |
| Security and derivative dealers | The previously published sector “Other private financial institutions” has been decomposed into these new sectors. |
| Specialized financial corporations and other financial intermediaries | |
| Financial auxiliaries | |
| Captive financial institutions and money lenders | |
| Source: Statistics Canada. | |
Extension of the From-Whom-to-Whom framework
A complimentary approach for identifying systemic risk in the financial system and enhancing analytical usefulness in the FWA involves the compilation of financial transactions and balance sheet information within a From-Whom-To-Whom (FWTW) framework. This approach explicitly identifies the financial interconnectedness across all sectors of the economy by linking financial assets and liabilities with their corresponding counterparties (i.e., a debtor borrowing funds from a creditor represents the two sides of a contractual loan agreement). This greatly aids in the identification of financial vulnerabilities and how risk may impact the broader financial system.
With the third quarter 2019 release of the FWA three new instruments have been added to the FWTW data visualization tool: currency and deposits in both domestic and foreign currencies and consumer credit. In the case of currency and deposits there are multiple options for where depositors can place their money. This adds to the complexity of the counterparty relationships, but also provides a powerful tool for examining the coherence of estimates. For this reason, the development of FWTW estimates for certain instruments also resulted in statistical revisions at the aggregate level.
| Third quarter 2018 | Fourth quarter 2018 | First quarter 2019 | Second quarter 2019 | Third quarter 2019 | |
|---|---|---|---|---|---|
| millions of dollars | |||||
| Financial and Wealth Accounts | |||||
| Household currency and deposit assets | 1,335,149 | 1,371,200 | 1,381,226 | 1,402,089 | 1,417,911 |
| From-Whom-to-Whom | |||||
| Liabilities with households | 1,335,149 | 1,371,200 | 1,381,226 | 1,402,089 | 1,417,911 |
| Total monetary authorities | 57,931 | 58,881 | 58,718 | 59,918 | 60,091 |
| Chartered banks | 980,674 | 1,010,508 | 1,015,232 | 1,028,084 | 1,041,641 |
| Quasi-banks | 272,767 | 277,445 | 282,863 | 289,576 | 291,557 |
| Financial government business enterprises | 19,755 | 20,334 | 20,339 | 20,439 | 20,504 |
| Federal government | 4,022 | 4,032 | 4,074 | 4,072 | 4,118 |
| Source: Statistics Canada Table 36-10-0580-01 and Data Visualisation Financial accounts on a from-whom-to-whom basis (71-607-X2018015). | |||||
Other statistical, conceptual, and methodological revisions
Securities reconciliation and integration—equities
The International Accounts and Trade Division (IATD) at Statistics Canada produces information on securities statistics. This includes debt securities such as bonds and commercial paper and equities such as shares listed on public exchanges. As part of the comprehensive revision, updated information for debt securities, which had been previously incorporated into the FWA, was integrated across a number of instruments on the issuer (liability) side. Additionally, to coincide with IATD's release of detailed information on equities, the FWA conducted a reconciliation exercise to align listed share liabilities by institutional sector. Some differences exist between the FWA and IATD due to classification and methodological differences and these will be addressed going forward.
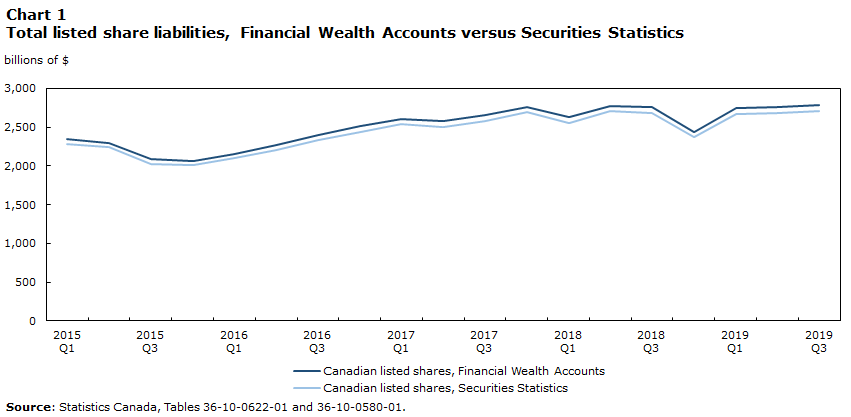
Data table for Chart 1
| Canadian listed shares, Financial Wealth Accounts | Canadian listed shares, Securities Statistics | |
|---|---|---|
| billions of $ | ||
| 2015 | ||
| Quarter 1 | 2,351 | 2,289 |
| Quarter 2 | 2,302 | 2,238 |
| Quarter 3 | 2,089 | 2,029 |
| Quarter 4 | 2,061 | 2,014 |
| 2016 | ||
| Quarter 1 | 2,148 | 2,100 |
| Quarter 2 | 2,266 | 2,210 |
| Quarter 3 | 2,400 | 2,337 |
| Quarter 4 | 2,510 | 2,443 |
| 2017 | ||
| Quarter 1 | 2,610 | 2,543 |
| Quarter 2 | 2,576 | 2,504 |
| Quarter 3 | 2,655 | 2,582 |
| Quarter 4 | 2,766 | 2,695 |
| 2018 | ||
| Quarter 1 | 2,631 | 2,560 |
| Quarter 2 | 2,779 | 2,708 |
| Quarter 3 | 2,760 | 2,680 |
| Quarter 4 | 2,442 | 2,373 |
| 2019 | ||
| Quarter 1 | 2,751 | 2,667 |
| Quarter 2 | 2,767 | 2,681 |
| Quarter 3 | 2,791 | 2,706 |
| Source: Statistics Canada, Tables 36-10-0622-01 and 36-10-0580-01. | ||
Revisions to other sectors and instruments
Table 3 summarizes other changes that were incorporated into certain FWA time series.
| Revision | Description of change |
|---|---|
| Revisions and reclassifications to currency and deposits | Statistics Canada uses aggregate information provided by Canadian chartered banks and other deposit-taking institutions to estimate the stock of currency and deposits by sector. This information follows prevailing business accounting rules in classifying chartered bank deposit liabilities. As such, it includes covered bonds, bearer-deposit notes, and other securities issued by chartered banks. In the past these bank liabilities have been re-classified to bonds and other short-term securities from currency and deposits to better align with recommended international macroeconomic accounting standards. With this revision additional amounts of negotiable securities contained in currency and bank deposit liabilities were identified and re-classified. Additionally, the information used to estimate non-resident currency and deposit assets held by Canadian banks also underwent significant reclassification to better delineate securities and ensure these securities were only being accounted for in one instrument. Additionally, the treatment of cash and coins in circulation was revisited resulting in re-allocations between primarily the household and non-financial corporations sectors. This was done to better reflect the distribution of physical cash and coins held by Canadian households and businesses such as retailers that have physical cash on premises. |
| Revised treatment of bankers' acceptances | Previously, the FWA did not fully articulate the role of banks as intermediaries regarding bankers’ acceptances. This treatment has been revised to identify the relationship between banks and non-financial corporations as one of lender and borrower with the latter having a loan liability with banks, who possess the corresponding loan asset and who are shown as issuers of these acceptances that can be bought and sold on financial markets. The end result was a reduction in short-term paper liabilities for non-financial corporations with a corresponding increase in their loan liabilities with banks. Overall, the total liabilities of non-financial corporations did not change because of this new methodology. For the chartered banking sector, total lending increased by the amount attributed to the loan aspect of bankers’ acceptances while short-term paper liabilities of banks increased by the amount of bankers’ acceptances issued by the institutions (i.e., excluding own acceptances purchased). |
| Revisions to household sector non-mortgage loans and consumer liabilities | Revisions to household non-mortgage and consumer credit liabilities were primarily due to the incorporation of updated information on student loans as well as data on credit unions. |
| Enhanced coverage of closed-end funds in the Other mutual funds sector | The Other mutual funds sector now includes closed-end funds that were not captured in existing data sources. While the levels of assets of these types of funds are relatively small this helps lay the groundwork for a more granular accounting of open versus closed-end funds. |
| Revisions to foreign direct investment in equity to better delineate listed from unlisted shares in the FWA | In the FWA a distinction is made between equities that are listed on public exchanges and those that are not. To improve the split between listed and unlisted shares in the FWA, work was undertaken to obtain information on the shares of foreign direct investment, previously considered as unlisted shares, that was in fact publically listed. These amounts were subsequently re-classified as listed equity in the FWA. |
| Source: Statistics Canada. | |
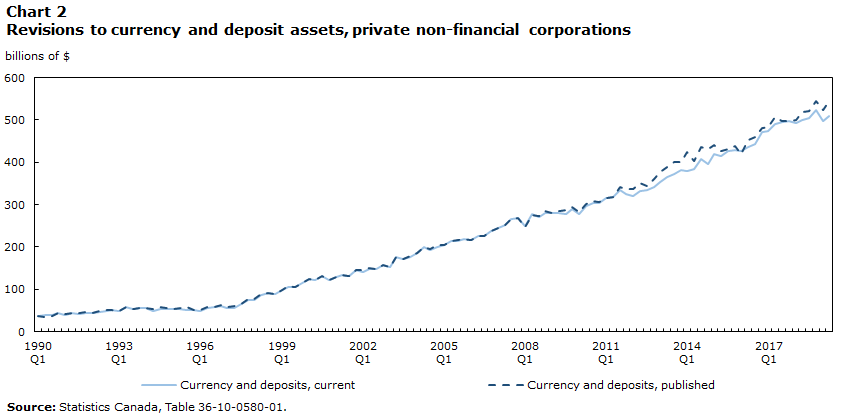
Data table for Chart 2
| Currency and deposits, current | Currency and deposits, published | |
|---|---|---|
| billions of $ | ||
| 1990 | ||
| Quarter 1 | 37,970 | 35,970 |
| Quarter 2 | 38,751 | 35,251 |
| Quarter 3 | 38,302 | 37,302 |
| Quarter 4 | 44,425 | 44,425 |
| 1994 | ||
| Quarter 1 | 39,525 | 40,525 |
| Quarter 2 | 43,493 | 43,993 |
| Quarter 3 | 42,152 | 43,152 |
| Quarter 4 | 44,488 | 45,988 |
| 1992 | ||
| Quarter 1 | 43,627 | 45,127 |
| Quarter 2 | 46,614 | 48,114 |
| Quarter 3 | 48,455 | 49,955 |
| Quarter 4 | 52,170 | 52,170 |
| 1993 | ||
| Quarter 1 | 48,176 | 48,176 |
| Quarter 2 | 57,430 | 57,430 |
| Quarter 3 | 53,385 | 53,385 |
| Quarter 4 | 55,236 | 55,236 |
| 1994 | ||
| Quarter 1 | 55,124 | 55,124 |
| Quarter 2 | 49,120 | 53,120 |
| Quarter 3 | 54,236 | 57,236 |
| Quarter 4 | 54,418 | 55,418 |
| 1995 | ||
| Quarter 1 | 52,770 | 53,770 |
| Quarter 2 | 52,573 | 55,573 |
| Quarter 3 | 51,522 | 57,522 |
| Quarter 4 | 51,061 | 52,061 |
| 1996 | ||
| Quarter 1 | 49,643 | 50,643 |
| Quarter 2 | 56,328 | 57,328 |
| Quarter 3 | 57,879 | 58,879 |
| Quarter 4 | 60,107 | 62,607 |
| 1997 | ||
| Quarter 1 | 55,420 | 57,420 |
| Quarter 2 | 56,869 | 61,369 |
| Quarter 3 | 65,478 | 65,478 |
| Quarter 4 | 74,558 | 76,558 |
| 1998 | ||
| Quarter 1 | 75,678 | 76,678 |
| Quarter 2 | 87,252 | 89,252 |
| Quarter 3 | 91,054 | 92,054 |
| Quarter 4 | 87,864 | 88,864 |
| 1999 | ||
| Quarter 1 | 97,450 | 97,450 |
| Quarter 2 | 104,726 | 106,726 |
| Quarter 3 | 105,697 | 105,697 |
| Quarter 4 | 115,145 | 115,145 |
| 2000 | ||
| Quarter 1 | 123,221 | 123,221 |
| Quarter 2 | 121,204 | 121,204 |
| Quarter 3 | 130,667 | 130,667 |
| Quarter 4 | 121,061 | 121,061 |
| 2001 | ||
| Quarter 1 | 127,880 | 127,880 |
| Quarter 2 | 133,800 | 133,800 |
| Quarter 3 | 130,327 | 130,327 |
| Quarter 4 | 145,876 | 145,876 |
| 2002 | ||
| Quarter 1 | 141,111 | 145,111 |
| Quarter 2 | 147,922 | 150,922 |
| Quarter 3 | 146,837 | 147,837 |
| Quarter 4 | 156,687 | 157,687 |
| 2003 | ||
| Quarter 1 | 153,783 | 153,783 |
| Quarter 2 | 175,254 | 175,254 |
| Quarter 3 | 170,877 | 171,877 |
| Quarter 4 | 175,519 | 178,519 |
| 2004 | ||
| Quarter 1 | 186,146 | 186,146 |
| Quarter 2 | 200,599 | 200,599 |
| Quarter 3 | 193,494 | 194,994 |
| Quarter 4 | 200,939 | 204,439 |
| 2005 | ||
| Quarter 1 | 204,983 | 204,983 |
| Quarter 2 | 212,928 | 212,928 |
| Quarter 3 | 215,043 | 215,543 |
| Quarter 4 | 218,701 | 218,701 |
| 2006 | ||
| Quarter 1 | 217,440 | 217,440 |
| Quarter 2 | 226,119 | 226,119 |
| Quarter 3 | 227,065 | 227,065 |
| Quarter 4 | 238,611 | 238,611 |
| 2007 | ||
| Quarter 1 | 244,327 | 244,327 |
| Quarter 2 | 252,059 | 252,059 |
| Quarter 3 | 265,394 | 265,394 |
| Quarter 4 | 268,088 | 268,088 |
| 2008 | ||
| Quarter 1 | 248,608 | 246,894 |
| Quarter 2 | 277,600 | 275,633 |
| Quarter 3 | 271,839 | 273,879 |
| Quarter 4 | 280,880 | 286,000 |
| 2009 | ||
| Quarter 1 | 279,643 | 279,424 |
| Quarter 2 | 279,925 | 284,547 |
| Quarter 3 | 278,548 | 286,571 |
| Quarter 4 | 290,360 | 294,018 |
| 2010 | ||
| Quarter 1 | 277,984 | 281,410 |
| Quarter 2 | 295,905 | 301,364 |
| Quarter 3 | 304,902 | 309,220 |
| Quarter 4 | 303,909 | 307,101 |
| 2011 | ||
| Quarter 1 | 314,566 | 316,588 |
| Quarter 2 | 317,648 | 319,160 |
| Quarter 3 | 335,132 | 341,156 |
| Quarter 4 | 325,638 | 337,691 |
| 2012 | ||
| Quarter 1 | 320,458 | 336,311 |
| Quarter 2 | 333,344 | 350,678 |
| Quarter 3 | 335,131 | 343,836 |
| Quarter 4 | 341,489 | 360,982 |
| 2013 | ||
| Quarter 1 | 353,907 | 375,942 |
| Quarter 2 | 365,803 | 389,212 |
| Quarter 3 | 372,772 | 400,083 |
| Quarter 4 | 381,402 | 399,898 |
| 2014 | ||
| Quarter 1 | 379,480 | 425,421 |
| Quarter 2 | 384,148 | 403,173 |
| Quarter 3 | 407,458 | 436,088 |
| Quarter 4 | 395,442 | 432,470 |
| 2015 | ||
| Quarter 1 | 419,229 | 440,781 |
| Quarter 2 | 415,531 | 425,815 |
| Quarter 3 | 426,135 | 430,501 |
| Quarter 4 | 429,481 | 438,433 |
| 2016 | ||
| Quarter 1 | 426,766 | 420,277 |
| Quarter 2 | 436,398 | 451,763 |
| Quarter 3 | 444,395 | 458,843 |
| Quarter 4 | 471,397 | 481,597 |
| 2017 | ||
| Quarter 1 | 473,476 | 484,186 |
| Quarter 2 | 491,486 | 505,871 |
| Quarter 3 | 495,125 | 498,507 |
| Quarter 4 | 496,577 | 497,858 |
| 2018 | ||
| Quarter 1 | 492,829 | 501,097 |
| Quarter 2 | 500,173 | 518,758 |
| Quarter 3 | 505,666 | 522,306 |
| Quarter 4 | 524,189 | 543,730 |
| 2019 | ||
| Quarter 1 | 496,542 | 510,459 |
| Quarter 2 | 522,459 | 545,189 |
| Source: Statistics Canada, Table 36-10-0580-01. | ||
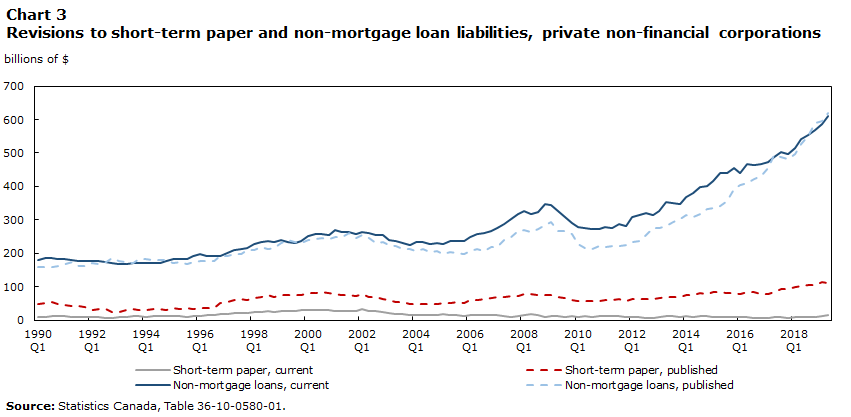
Data table for Chart 3
| Short-term paper, current | Short-term paper, published | Non-mortgage loans, current | Non-mortgage loans, published | |
|---|---|---|---|---|
| billions of $ | ||||
| 1990 | ||||
| Quarter 1 | 10,206 | 48,226 | 181,092 | 159,181 |
| Quarter 2 | 10,641 | 51,787 | 184,743 | 160,388 |
| Quarter 3 | 12,057 | 53,700 | 184,906 | 160,511 |
| Quarter 4 | 12,511 | 49,620 | 183,239 | 162,950 |
| 1994 | ||||
| Quarter 1 | 11,318 | 46,103 | 183,045 | 166,614 |
| Quarter 2 | 10,031 | 41,322 | 179,111 | 175,451 |
| Quarter 3 | 9,643 | 41,944 | 176,487 | 161,754 |
| Quarter 4 | 8,747 | 37,898 | 177,952 | 163,364 |
| 1992 | ||||
| Quarter 1 | 9,135 | 31,334 | 177,407 | 170,694 |
| Quarter 2 | 9,663 | 34,133 | 176,648 | 169,355 |
| Quarter 3 | 7,884 | 34,465 | 175,130 | 174,028 |
| Quarter 4 | 6,988 | 24,458 | 171,473 | 185,301 |
| 1993 | ||||
| Quarter 1 | 8,409 | 24,646 | 167,781 | 177,985 |
| Quarter 2 | 10,060 | 29,783 | 167,544 | 172,759 |
| Quarter 3 | 11,202 | 33,453 | 169,805 | 169,979 |
| Quarter 4 | 11,229 | 30,400 | 169,720 | 182,596 |
| 1994 | ||||
| Quarter 1 | 10,894 | 29,726 | 169,689 | 183,227 |
| Quarter 2 | 12,708 | 32,303 | 171,977 | 180,218 |
| Quarter 3 | 12,886 | 34,339 | 171,410 | 178,612 |
| Quarter 4 | 11,829 | 31,436 | 176,507 | 179,148 |
| 1995 | ||||
| Quarter 1 | 13,103 | 37,259 | 182,115 | 172,366 |
| Quarter 2 | 11,389 | 34,781 | 184,325 | 174,962 |
| Quarter 3 | 10,574 | 36,402 | 182,022 | 168,618 |
| Quarter 4 | 12,032 | 33,733 | 190,623 | 175,226 |
| 1996 | ||||
| Quarter 1 | 13,641 | 36,779 | 197,705 | 176,453 |
| Quarter 2 | 15,364 | 37,874 | 193,037 | 176,266 |
| Quarter 3 | 16,436 | 37,193 | 192,900 | 177,157 |
| Quarter 4 | 17,875 | 51,840 | 191,980 | 192,522 |
| 1997 | ||||
| Quarter 1 | 19,293 | 55,506 | 201,667 | 192,114 |
| Quarter 2 | 20,356 | 59,085 | 209,926 | 198,020 |
| Quarter 3 | 22,475 | 62,433 | 214,258 | 199,297 |
| Quarter 4 | 20,646 | 60,819 | 216,653 | 210,609 |
| 1998 | ||||
| Quarter 1 | 23,940 | 66,601 | 227,853 | 211,074 |
| Quarter 2 | 25,706 | 69,722 | 235,019 | 219,970 |
| Quarter 3 | 28,022 | 73,876 | 235,417 | 214,077 |
| Quarter 4 | 23,492 | 69,415 | 234,947 | 215,659 |
| 1999 | ||||
| Quarter 1 | 26,994 | 74,305 | 238,633 | 230,369 |
| Quarter 2 | 28,633 | 76,611 | 233,673 | 239,449 |
| Quarter 3 | 28,391 | 75,209 | 231,229 | 233,597 |
| Quarter 4 | 29,053 | 76,116 | 235,504 | 230,212 |
| 2000 | ||||
| Quarter 1 | 29,214 | 79,907 | 252,638 | 239,094 |
| Quarter 2 | 30,767 | 81,653 | 258,032 | 242,235 |
| Quarter 3 | 31,854 | 83,017 | 257,520 | 245,287 |
| Quarter 4 | 29,247 | 80,764 | 255,162 | 242,256 |
| 2001 | ||||
| Quarter 1 | 28,383 | 78,894 | 269,301 | 247,708 |
| Quarter 2 | 27,449 | 74,472 | 262,327 | 248,783 |
| Quarter 3 | 28,895 | 75,719 | 264,467 | 260,622 |
| Quarter 4 | 28,156 | 72,443 | 257,119 | 246,972 |
| 2002 | ||||
| Quarter 1 | 32,006 | 76,831 | 264,719 | 254,771 |
| Quarter 2 | 28,613 | 69,655 | 260,288 | 246,141 |
| Quarter 3 | 26,829 | 68,012 | 254,609 | 231,957 |
| Quarter 4 | 24,608 | 61,988 | 256,202 | 233,621 |
| 2003 | ||||
| Quarter 1 | 21,547 | 61,810 | 240,635 | 224,182 |
| Quarter 2 | 17,145 | 53,843 | 236,521 | 220,910 |
| Quarter 3 | 17,793 | 53,900 | 230,684 | 213,703 |
| Quarter 4 | 16,764 | 49,081 | 224,630 | 211,926 |
| 2004 | ||||
| Quarter 1 | 15,979 | 49,459 | 232,787 | 207,640 |
| Quarter 2 | 15,393 | 49,229 | 234,473 | 213,112 |
| Quarter 3 | 16,540 | 49,604 | 228,434 | 203,514 |
| Quarter 4 | 16,556 | 49,122 | 231,438 | 206,085 |
| 2005 | ||||
| Quarter 1 | 17,264 | 51,940 | 229,152 | 199,150 |
| Quarter 2 | 14,865 | 50,259 | 235,990 | 204,446 |
| Quarter 3 | 14,765 | 53,022 | 237,293 | 202,100 |
| Quarter 4 | 13,585 | 52,686 | 236,550 | 197,952 |
| 2006 | ||||
| Quarter 1 | 14,536 | 58,858 | 248,892 | 206,341 |
| Quarter 2 | 14,935 | 60,791 | 258,299 | 212,606 |
| Quarter 3 | 14,362 | 62,066 | 261,177 | 207,685 |
| Quarter 4 | 15,006 | 67,773 | 266,057 | 217,883 |
| 2007 | ||||
| Quarter 1 | 15,337 | 70,469 | 276,313 | 218,314 |
| Quarter 2 | 13,215 | 69,685 | 286,895 | 240,827 |
| Quarter 3 | 10,908 | 72,576 | 301,432 | 249,285 |
| Quarter 4 | 12,776 | 72,426 | 317,897 | 265,623 |
| 2008 | ||||
| Quarter 1 | 15,973 | 79,292 | 325,643 | 269,601 |
| Quarter 2 | 17,074 | 77,663 | 318,044 | 262,393 |
| Quarter 3 | 16,590 | 76,212 | 322,653 | 272,646 |
| Quarter 4 | 10,204 | 74,190 | 347,431 | 285,755 |
| 2009 | ||||
| Quarter 1 | 11,723 | 74,162 | 345,901 | 293,490 |
| Quarter 2 | 11,373 | 69,227 | 327,050 | 266,855 |
| Quarter 3 | 10,668 | 67,142 | 307,284 | 265,595 |
| Quarter 4 | 11,140 | 59,769 | 291,716 | 258,769 |
| 2010 | ||||
| Quarter 1 | 10,738 | 58,198 | 279,090 | 229,163 |
| Quarter 2 | 11,439 | 58,437 | 274,642 | 217,285 |
| Quarter 3 | 10,326 | 57,886 | 271,870 | 212,832 |
| Quarter 4 | 12,042 | 57,887 | 273,435 | 221,851 |
| 2011 | ||||
| Quarter 1 | 11,265 | 60,717 | 277,710 | 218,950 |
| Quarter 2 | 11,321 | 61,812 | 275,138 | 221,623 |
| Quarter 3 | 12,206 | 64,770 | 287,088 | 223,281 |
| Quarter 4 | 9,351 | 57,277 | 281,708 | 224,711 |
| 2012 | ||||
| Quarter 1 | 10,749 | 64,380 | 309,330 | 233,913 |
| Quarter 2 | 8,476 | 63,334 | 315,353 | 237,692 |
| Quarter 3 | 6,918 | 64,623 | 319,360 | 253,424 |
| Quarter 4 | 6,918 | 62,335 | 315,353 | 275,008 |
| 2013 | ||||
| Quarter 1 | 10,140 | 66,177 | 327,820 | 276,079 |
| Quarter 2 | 11,679 | 70,703 | 352,284 | 282,253 |
| Quarter 3 | 11,055 | 69,610 | 351,314 | 294,739 |
| Quarter 4 | 9,811 | 68,156 | 348,728 | 304,035 |
| 2014 | ||||
| Quarter 1 | 11,740 | 75,226 | 367,894 | 313,859 |
| Quarter 2 | 9,843 | 75,689 | 380,814 | 307,955 |
| Quarter 3 | 12,250 | 81,558 | 398,993 | 317,233 |
| Quarter 4 | 12,599 | 78,414 | 399,923 | 332,151 |
| 2015 | ||||
| Quarter 1 | 10,707 | 83,469 | 417,568 | 334,279 |
| Quarter 2 | 9,871 | 85,171 | 438,696 | 341,861 |
| Quarter 3 | 9,588 | 80,676 | 440,690 | 356,450 |
| Quarter 4 | 9,300 | 82,724 | 456,382 | 392,447 |
| 2016 | ||||
| Quarter 1 | 10,852 | 79,000 | 439,153 | 403,346 |
| Quarter 2 | 8,724 | 84,249 | 465,742 | 409,740 |
| Quarter 3 | 5,569 | 84,345 | 464,984 | 422,661 |
| Quarter 4 | 6,347 | 77,451 | 465,922 | 429,950 |
| 2017 | ||||
| Quarter 1 | 7,000 | 77,236 | 473,443 | 456,380 |
| Quarter 2 | 8,486 | 84,262 | 487,942 | 494,354 |
| Quarter 3 | 8,996 | 92,472 | 503,274 | 488,767 |
| Quarter 4 | 7,886 | 92,220 | 495,814 | 482,690 |
| 2018 | ||||
| Quarter 1 | 9,488 | 99,272 | 514,534 | 496,528 |
| Quarter 2 | 8,834 | 103,534 | 540,565 | 528,335 |
| Quarter 3 | 8,785 | 106,083 | 554,994 | 550,443 |
| Quarter 4 | 8,790 | 104,024 | 568,683 | 588,741 |
| 2019 | ||||
| Quarter 1 | 12,255 | 112,879 | 585,304 | 594,449 |
| Quarter 2 | 14,566 | 110,810 | 611,086 | 618,149 |
| Source: Statistics Canada, Table 36-10-0580-01. | ||||
Future directions
There are other future developments planned for the FWA, including further incorporation of instruments into a from-whom-to-whom framework. Additionally, further alignment of the current FWA sector and category classification with international standards is under review. Lastly, the portion of the NBSA covering lending to both households and non-financial corporations will be expanded and estimated on a monthly basis as the Monthly Credit Aggregates program.
- Date modified: