Canada at a Glance 2017
Education
Archived Content
Information identified as archived is provided for reference, research or recordkeeping purposes. It is not subject to the Government of Canada Web Standards and has not been altered or updated since it was archived. Please "contact us" to request a format other than those available.
| 2006 | 2011 | 2016 | |
|---|---|---|---|
| thousands | |||
| Working-age population | 26,116 | 27,913 | 29,587 |
| % | |||
| 0 to 8 years of study | 8.1 | 6.4 | 5.2 |
| Some high school | 15.2 | 13.4 | 11.7 |
| High school graduate | 19.9 | 19.8 | 20.0 |
| Some postsecondary | 8.1 | 8.0 | 6.7 |
| Postsecondary certificate or diploma | 29.9 | 31.2 | 31.6 |
| University degree | 18.8 | 21.2 | 24.7 |
| Bachelor's degree | 13.1 | 14.6 | 16.8 |
| Above bachelor's degree | 5.7 | 6.7 | 7.9 |
|
Note: Population aged 15 and older based on Labour Force Survey estimates. Source: Statistics Canada, CANSIM table 282-0004. |
|||
| 2014/2015 | 2015/2016 | 2016/2017Note p: preliminary | |
|---|---|---|---|
| average (dollars) | |||
| Canada | 5,998 | 6,201 | 6,373 |
| Newfoundland and Labrador | 2,660 | 2,759 | 2,759 |
| Prince Edward Island | 5,849 | 6,130 | 6,288 |
| Nova Scotia | 6,483 | 6,834 | 7,218 |
| New Brunswick | 6,298 | 6,379 | 6,682 |
| Quebec | 2,740 | 2,797 | 2,851 |
| Ontario | 7,562 | 7,865 | 8,114 |
| Manitoba | 3,857 | 4,013 | 4,058 |
| Saskatchewan | 6,693 | 6,978 | 7,177 |
| Alberta | 5,738 | 5,739 | 5,750 |
| British Columbia | 5,201 | 5,397 | 5,534 |
|
p preliminary Note: Weighted averages are calculated using the most current enrollment data available. Source: Statistics Canada, Tourism and Centre for Education Statistics. |
|||

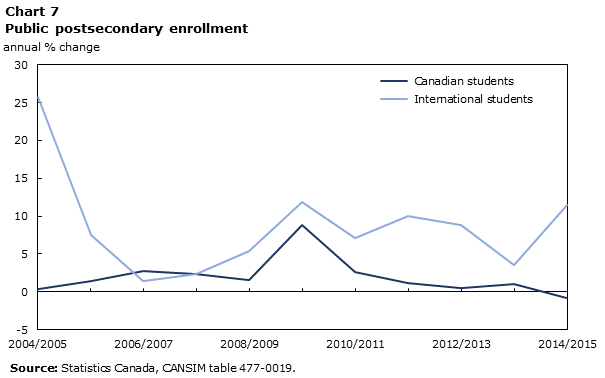
Data Table for Chart 7
| Canadian students | International students | |
|---|---|---|
| annual % change | ||
| 2004/2005 | 0.4 | 25.8 |
| 2005/2006 | 1.4 | 7.5 |
| 2006/2007 | 2.8 | 1.4 |
| 2007/2008 | 2.3 | 2.4 |
| 2008/2009 | 1.6 | 5.4 |
| 2009/2010 | 8.8 | 11.8 |
| 2010/2011 | 2.6 | 7.1 |
| 2011/2012 | 1.2 | 10 |
| 2012/2013 | 0.5 | 8.8 |
| 2013/2014 | 1 | 3.6 |
| 2014/2015 | -0.8 | 11.4 |
| Source: Statistics Canada, CANSIM table 477-0019. | ||
- Date modified:
