Canada at a Glance 2016
Environment
Archived Content
Information identified as archived is provided for reference, research or recordkeeping purposes. It is not subject to the Government of Canada Web Standards and has not been altered or updated since it was archived. Please "contact us" to request a format other than those available.
Table
| 2007 | 2009 | 2011 | 2013 | |
|---|---|---|---|---|
| % | ||||
| Applied chemical or organic fertilizer | 51 | 51 | 49 | 52 |
| Applied only chemical fertilizer | 18 | 14 | 13 | 15 |
| Applied only organic fertilizer | 24 | 29 | 28 | 27 |
| Applied both chemical and organic fertilizers | 18 | 7 | 8 | 10 |
| Applied chemical or organic pesticide | 33 | 27 | 27 | 32 |
| Applied only chemical pesticide | 21 | 12 | 12 | 16 |
| Applied only organic pesticide | 8 | 12 | 12 | 13 |
| Applied both chemical and organic pesticides | 3 | 2 | 3 | 3 |
|
Note: As a percentage of all households that had a lawn or garden. Source: Statistics Canada, CANSIM table 153-0064. |
||||
Charts

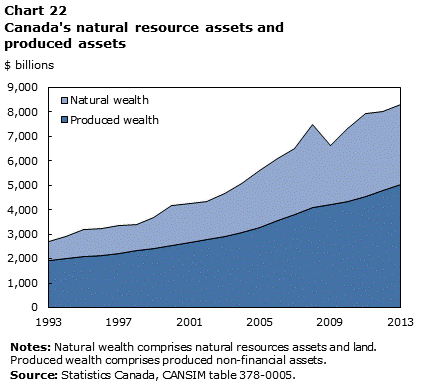
Description for Chart 22
| Produced wealth | Natural wealth | |
|---|---|---|
| 1993 | 1,909 | 770 |
| 1994 | 1,991 | 899 |
| 1995 | 2,069 | 1,098 |
| 1996 | 2,127 | 1,079 |
| 1997 | 2,209 | 1,131 |
| 1998 | 2,308 | 1,070 |
| 1999 | 2,410 | 1,261 |
| 2000 | 2,526 | 1,649 |
| 2001 | 2,646 | 1,587 |
| 2002 | 2,763 | 1,574 |
| 2003 | 2,889 | 1,750 |
| 2004 | 3,057 | 2,023 |
| 2005 | 3,262 | 2,317 |
| 2006 | 3,542 | 2,537 |
| 2007 | 3,815 | 2,683 |
| 2008 | 4,091 | 3,395 |
| 2009 | 4,212 | 2,415 |
| 2010 | 4,341 | 2,960 |
| 2011 | 4,543 | 3,366 |
| 2012 | 4,799 | 3,190 |
| 2013 | 5,020 | 3,261 |
Notes:
Natural wealth comprises natural resources assets and land. Produced wealth comprises produced non-financial assets.
Source:
Statistics Canada, CANSIM table 378-0005.

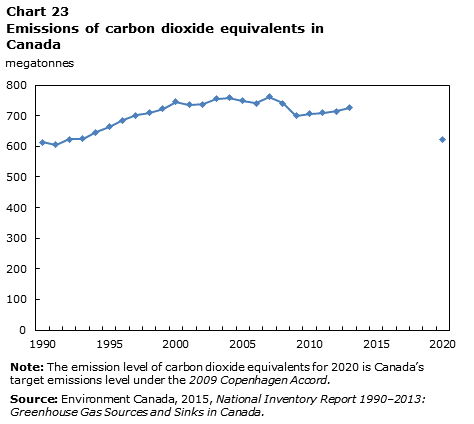
Description for Chart 23
| megatonnes | |
|---|---|
| 1990 | 613 |
| 1991 | 605 |
| 1992 | 623 |
| 1993 | 625 |
| 1994 | 646 |
| 1995 | 664 |
| 1996 | 685 |
| 1997 | 701 |
| 1998 | 709 |
| 1999 | 722 |
| 2000 | 745 |
| 2001 | 735 |
| 2002 | 738 |
| 2003 | 756 |
| 2004 | 758 |
| 2005 | 749 |
| 2006 | 740 |
| 2007 | 761 |
| 2008 | 741 |
| 2009 | 699 |
| 2010 | 707 |
| 2011 | 709 |
| 2012 | 715 |
| 2013 | 726 |
| 2014 | Data not yet available for 2014 to 2019. |
| 2015 | Data not yet available for 2014 to 2019. |
| 2016 | Data not yet available for 2014 to 2019. |
| 2017 | Data not yet available for 2014 to 2019. |
| 2018 | Data not yet available for 2014 to 2019. |
| 2019 | Data not yet available for 2014 to 2019. |
| 2020 | 622 |
Notes:
The emission level of carbon dioxide equivalents for 2020 is Canada's target emissions level under the 2009 Copenhagen Accord.
Data not yet available for 2014 to 2019.
Data not yet available for 2014 to 2019.
Source:
Environment Canada, 2015, National Inventory Report 1990–2013: Greenhouse Gas Sources and Sinks in Canada.
- Date modified:
