Common menu bar links
Archived Content
Information identified as archived is provided for reference, research or recordkeeping purposes. It is not subject to the Government of Canada Web Standards and has not been altered or updated since it was archived. Please "contact us" to request a format other than those available.
Crime
Tables
Charts
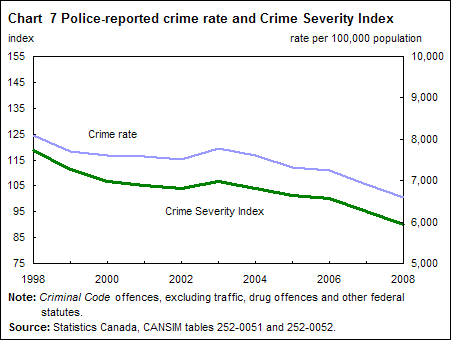
- Chart 7 Police-reported crime rate and Crime Severity Index
View tables
| 1988 | 1998 | 2008 | |
|---|---|---|---|
| actual incidents | |||
| Criminal Code offences, excluding traffic offences | 2,390,008 | 2,440,650 | 2,194,968 |
| Property crimes | 1,457,361 | 1,377,901 | 1,025,813 |
| Crimes of violence | 232,607 | 300,058 | 310,398 |
| Other crimes | 700,040 | 762,691 | 858,757 |
| Selected offences | |||
| Homicide | 576 | 558 | 611 |
| Assault (levels 1 to 3) | 163,890 | 223,926 | 237,901 |
| Sexual assault (levels 1 to 3) | 24,898 | 25,553 | 21,483 |
| Prostitution | 10,721 | 5,969 | 3,874 |
| Break and enter | 359,198 | 350,774 | 209,755 |
| Motor vehicle theft | 89,454 | 165,920 | 125,274 |
| Fraud | 124,772 | 94,819 | 90,932 |
| Drugs | 59,430 | 70,920 | 101,965 |
| Source: Statistics Canada, CANSIM table 252-0013. | |||
| Under 25 | 25 to 49 | 50 and older | |
|---|---|---|---|
| % | |||
| All Canadian workers | 16 | 57 | 27 |
| Workers in justice-related occupations | 9 | 61 | 30 |
| Police officers | 5 | 79 | 16 |
| Private security personnel | 18 | 47 | 35 |
| Courts personnel | 5 | 62 | 33 |
| Correctional services personnel | 4 | 71 | 25 |
| Source: Statistics Canada, Catalogue no. 85-002-X. | |||


