Statistics Canada
www.statcan.gc.ca
Common menu bar links

Archived Content
Information identified as archived is provided for reference, research or recordkeeping purposes. It is not subject to the Government of Canada Web Standards and has not been altered or updated since it was archived. Please "contact us" to request a format other than those available.
Health
Tables
- Table 6 Selected health indicators, 2008
- Table 7 Life expectancy
- Table 8 Mortality rates, by selected causes, 2005
- Table 9 New cancer cases, by selected primary site
Charts
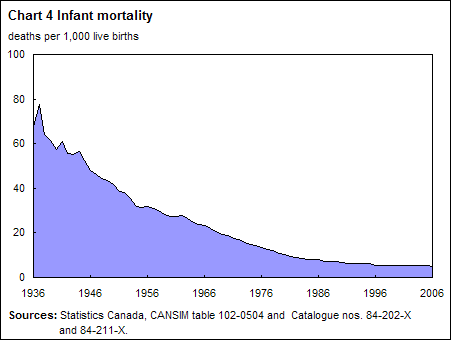
- Chart 4 Infant mortality
View tables
| Both sexes | Males | Females | |
|---|---|---|---|
| % of population | |||
| Arthritis | 15.3 | 12.0 | 18.5 |
| Diabetes | 5.9 | 6.3 | 5.4 |
| Asthma | 8.4 | 7.3 | 9.5 |
| High blood pressure | 16.4 | 15.9 | 16.9 |
| Current smoker, daily or occasional | 21.4 | 24.3 | 18.5 |
| BMI (18 and older), overweight | 33.8 | 40.2 | 27.4 |
| BMI (18 and older), obese | 17.2 | 18.3 | 16.2 |
| Influenza immunization, in past year | 31.7 | 28.3 | 34.9 |
| Perceived mental health, very good or excellent | 74.4 | 75.3 | 73.4 |
| Perceived mental health, fair or poor | 5.1 | 4.7 | 5.5 |
| Life satisfaction, satisfied or very satisfied | 91.4 | 91.5 | 91.2 |
| Pain or discomfort that prevents activities | 12.4 | 10.1 | 14.7 |
| Has a regular medical doctor | 84.4 | 80.4 | 88.3 |
| Contact with a medical doctor in past 12 months | 79.5 | 73.0 | 85.9 |
| Notes: Population aged 12 and older. BMI = Body mass index. |
|||
| Source: Statistics Canada, CANSIM table 105-0501. | |||
| 1931 | 1961 | 1992 | 2006 | |
|---|---|---|---|---|
| years | ||||
| Females | ||||
| At birth | 62.1 | 74.2 | 81.2 | 83.0 |
| At 65 | 13.7 | 16.1 | 20.1 | 21.4 |
| Males | ||||
| At birth | 60.0 | 68.4 | 74.8 | 78.4 |
| At 65 | 13.0 | 13.5 | 16.0 | 18.2 |
| Note: Starting with 2005 data, life expectancy is calculated using a three-year average of age-specific mortality rates. | ||||
| Source: Statistics Canada, CANSIM table 102-0511 and Catalogue no. 84-518-X. | ||||
| Both sexes | Males | Females | |
|---|---|---|---|
| rate per 100,000 population | |||
| All causes of death | 563.7 | 696.7 | 460.7 |
| Septicemia | 4.1 | 4.8 | 3.6 |
| Viral hepatitis | 1.0 | 1.3 | 0.6 |
| Human immunodeficiency virus | 1.3 | 2.1 | 0.6 |
| Malignant neoplasms | 170.3 | 207.7 | 143.8 |
| Diabetes mellitus | 19.1 | 23.7 | 15.6 |
| Alzheimer's disease | 12.7 | 10.7 | 13.6 |
| Heart diseases | 121.5 | 160.1 | 91.5 |
| Cerebrovascular diseases | 32.5 | 35.2 | 30.2 |
| Influenza and pneumonia | 13.2 | 15.8 | 11.5 |
| Chronic lower respiratory diseases | 25.1 | 34.1 | 19.8 |
| Chronic liver disease and cirrhosis | 6.1 | 8.5 | 3.9 |
| Renal failure | 8.3 | 11.3 | 6.5 |
| Certain conditions originating in the perinatal period | 4.4 | 4.7 | 4.0 |
| Congenital malformations, deformations and chromosomal abnormalities | 3.2 | 3.4 | 3.1 |
| Accidents (unintentional injuries) | 25.6 | 35.6 | 16.5 |
| Suicide | 10.9 | 16.9 | 5.1 |
| Homicide | 1.9 | 2.8 | 0.9 |
| Note: Rates are age-standardized to the 1991 Census of Population. | |||
| Source: Statistics Canada, CANSIM table 102-0552. | |||
| 1996 | 2001 | 2006 | |
|---|---|---|---|
| number | |||
| Males | |||
| Total, all primary sites of cancer1 | 63,072 | 74,769 | 82,133 |
| Colon (excluding rectum) | 5,252 | 6,119 | 6,754 |
| Rectum and rectosigmoid | 2,899 | 3,684 | 4,000 |
| Lung and bronchus | 11,306 | 11,913 | 12,053 |
| Prostate | 14,849 | 20,488 | 22,480 |
| Females | |||
| Total, all primary sites of cancer1 | 57,949 | 66,901 | 75,061 |
| Colon (excluding rectum) | 5,268 | 6,169 | 6,472 |
| Rectum and rectosigmoid | 1,907 | 2,302 | 2,453 |
| Lung and bronchus | 7,144 | 8,591 | 10,032 |
| Breast | 16,598 | 18,823 | 20,337 |
| Note: International Classification of Diseases for Oncology, 3rd edition (ICD-O-3) and the International Agency for Research on Cancer rules for determining multiple primary sites. | |||
| 1. Included are all invasive sites and in situ for bladder. | |||
| Source: Statistics Canada, Canadian Cancer Registry Database (June 2007 file), CANSIM table 103-0553. | |||
View charts