
Analytical Studies: Methods and References
Longitudinal Immigration Database (IMDB) Technical Report, 2016

Archived Content
Information identified as archived is provided for reference, research or recordkeeping purposes. It is not subject to the Government of Canada Web Standards and has not been altered or updated since it was archived. Please "contact us" to request a format other than those available.
by Rose Evra and Elena Prokopenko
Social and Aboriginal Statistics Division
Skip to text
Text begins
Revision notice
Revisions have been made to this product. Please take note of the following changes:
July 11, 2019
Section 3.4.1 of the Longitudinal Immigration Database (IMDB) Technical Report, 2016 was updated. A new section (7.6) on the quality assessment of the Province of residence variable (PRCO_) was added, this section includes a new table.
January 11, 2019
A new section (7.1.1.1) was added to the Longitudinal Immigration Database (IMDB) Technical Report, 2016. Figures of table 14 from the English PDF were updated.
Acknowledgements
We would like to mention the special contribution of the following people: Laetitia Martin of the Social and Aboriginal Statistics Division (SASD), who wrote sections 3.3.1 to 3.3.3 of this report; Alexandr Diaz-Papkovich of the Social Survey Method Division (SSMD), who validated the sections of this report relating to the methodology behind the production of the IMDB; and Tristan Cayn, Caroline Li, Ian Marrs, Scott McLeish, and Eric Mongrain, members of the Administrative Data team, who produced the IMDB and contributed to the content of several sections of the report.
Many thanks to the following people for reviewing the report prior to its publication: Margareta Dovgal, Benoît St-Jean, Winnie Chan, Hélène Maheux and Tiana Major (Statistics Canada); Yoko Yoshida (Department of Sociology and Social Anthropology, Dalhousie University); Michael Haan (Canada Research Chair in Migration and Ethnic Studies and the Department of Sociology of Western University); and Ian Clara (Manitoba Research Data Centre).
Abstract
The Longitudinal Immigration Database (IMDB) is a comprehensive source of data that plays a key role in the understanding of the economic behaviour of immigrants. It is the only annual Canadian dataset that allows users to study the characteristics of immigrants to Canada at the time of admission and their economic outcomes and regional (inter-provincial) mobility over a time span of more than 30 years.
The IMDB combines administrative files on immigrant admissions and non-permanent resident permits from Immigration, Refugees and Citizenship Canada (IRCC) with tax files from the Canada Revenue Agency (CRA). Information is available for immigrant taxfilers admitted since 1980. Tax records for 1982 and subsequent years are available for immigrant taxfilers.
This report will discuss the IMDB data sources, concepts and variables, record linkage, data processing, dissemination, data evaluation and quality indicators, comparability with other immigration datasets, and the analyses possible with the IMDB.
Key words: Administrative data, Immigration, IMDB, Longitudinal data, non-permanent residents, Taxfilers
Glossary of terms
Following are the description of acronyms that will be used serveral times in the report.
| Acronym | Definition |
|---|---|
| CPI | Consumer Price Index |
| CRA | Canada Revenue Agency |
| ILF | Immigrant Landing File |
| IMDB | Longitudinal Immigration Database |
| IRCC | Immigration, Refugees and Citizenship Canada |
| LAD | Longitudinal Administrative Databank |
| LSIC | Longitudinal Survey of Immigrants to Canada |
| NHS | National Household Survey |
| NPR | Non-permanent resident |
| NRF | Non-permanent Resident File |
| NRF, Permits | Non-permanent resident, Permit File |
| PNRF | Integrated Permanent and Non-permanent Resident File |
| PR | Permanent resident |
| SDLE | Social Data Linkage Environment |
| T1FF | T1 Family File |
1 Introduction
The Longitudinal Immigration Database (IMDB) is a comprehensive source of data that plays a key role in the understanding of the economic behaviour of immigrants. It is the only annual Canadian dataset that allows users to study the characteristics of immigrants to Canada at the time of admission and their economic outcomes and regional (inter-provincial) mobility over a time span of more than 30 years.
The IMDB combines administrative files on immigrant admissions and non-permanent resident permits from Immigration, Refugees and Citizenship CanadaNote 1 (IRCC) with tax files from the Canada Revenue Agency (CRA). Information is available for immigrant taxfilers admitted since 1980. Tax records for 1982 and subsequent years are available for immigrant taxfilers.
The IMDB was designed to provide detailed and reliable data on the performance and impact of immigration programs. Being a database of immigrant taxfilers, the IMDB can be used to answer both broad and very specific research questions. The database also provides information on pre-admission experience, such as work or study permits. Its major strength is that it allows for the analysis of socio-economic outcomes over a period long enough to assess the impact of immigrant characteristics upon admission, including admission category, education, and knowledge of French or English, on outcomes. Moreover, annual information on place of residence allows for the investigation of secondary migration (immigrants' subsequent relocation in Canada). It is to be noted that yearly updates of the IMDB are independent from one another. From year to year, there have been changes to data processing, including updates to the unique person identifier (IMDB_ID).
As created, the IMDB includes multiple files: one file for each tax year since 1982, two files containing immigration characteristics at the person level, and one permit file for non-permanent residents. The IMDB is updated annually via record linkage techniques described in this report. Each year an additional tax year is added, and new admission and non-permanent resident permit data are added to the database.
The IMDB files are available only to the members of the Research Data Centres (RDC), Statistics Canada researchers and deemed employees. This is to ensure that proper confidentiality measures are taken to protect privacy and ensure confidentiality. Information from the IMDB is available to the public through annual aggregated summary tables produced and published by Statistics Canada. Additionally, external researchers may request ad hoc tables and analyses; Statistics Canada provides these services on a cost-recovery basis.
This report will discuss the IMDB data sources (Section 2), concepts and variables (Section 3), record linkage (Section 4), data processing (Section 5), dissemination (Section 6), data evaluation and quality indicators (Section 7), comparability with other immigration datasets (Section 8), and the analyses possible with the IMDB (Section 9).
2 Data sources
Several files are required in order to produce the IMDB. These files, which will be described in this section, consist of immigration data, immigrant tax files and auxiliary files covering many years.
2.1 Immigration data
Every year, Statistics Canada (StatCan) receives admission data on new recipients of permanent residency permits and non-permanent residency permits from IRCC.
2.1.1 Integrated Permanent and Non-permanent Resident File (PNRF)
Every year, landing data is added to create the Immigrant Landing File (ILF). This file contains information such as landing date, date of birth, and immigration category. The ILF could be seen as a census of the people who have immigrated to Canada as permanent residents since 1980; it holds information on their characteristics at landing. This file, however, is not directly available to IMDB users. The IMDB covers only immigrants who have filed taxes at least once since 1982. Landing data for these immigrant taxfilers is available in the Integrated Permanent and Non-permanent Resident File (PNRF).
Because it is an administrative record of permanent residency, the ILF overestimates the number of immigrants currently living in Canada. This overestimation occurs for two reasons. First, the ILF does not identify the individuals who have left the country. Immigrants who landed in Canada may have left Canada since landing. Second, the death of immigrants who landed in 1980 and thereafter is only partially reported. Further information on mortality data can be found in Section 7.2.
Researchers can access the Integrated Permanent and Non-permanent Resident File (PNRF), which combines information from the Immigrant Landing File (ILF) and the NRF at the person level. The PNRF provides users with the ability to follow the migration history of immigrants, including their pre-landing experience in Canada. The PNRF covers all the admission data (except emigration and mortality) as well as detailed information on the sociodemographic characteristics of immigrants who landed in Canada in 1980 or thereafter, making it possible, for example, to determine whether a person was a non-permanent resident prior to landing. It is to be noted that records of non-permanent residents who have not become permanent residents are not included in this file. This file contains the number of permits for each non-permanent resident who became a permanent resident, and includes landing dates. The PNRF also includes a date of death when a link to a death record has been made (see Section 7.2.2). For more details on the content of this file, please refer to the immigration component of the IMDB dictionary, in sections 3.3 and 3.4 of this report.
Data of immigrants who have not filed taxes since 1982 or were not linked are available in the file PNRF_Nonfilers. In addition, a file named PNRF_EXTRA is available to data users; it includes variables that have been retired, have little analytical value, or for which no metadata are available. The complete list of variables can be found on the IMDB immigration data dictionary.
2.1.2 Non-permanent Resident File (NRF)
Data of individual who were granted non-permanent resident permits since 1980 were used to create the Non-permanent Resident File (NRF_Permit). This file includes the type of permits (work or study, for example) and the last valid date of a permit for example. The file is updated each year with new annual non-permanent permits data.
A given person can have multiple permits, since the same person can be issued many permits at different times. The NRF_Person stores such information at the person level; this file includes among other things the number of permits and the first year of temporary residence permit.
The data can be linked to the PNRF by means of the IMDB unique person identifier (IMDB_ID). For more details on the variable included on these files, please refer to the immigration component of the IMDB dictionary.
2.2 T1 Family File (T1FF)
The tax files used to create the IMDB_T1FF files are those contained in the T1 Family FileNote 2 (T1FF). Statistics Canada takes the annual individual T1 file, T4 tax file and Canada Child Tax Benefit (CCTB)Note 3 file from the CRA and creates the T1 Family File for that year. Processing consists of many steps, ranging from geographical coding to the formation of families (for example, when the taxfiler mentions a spouse and this spouse is also a taxfiler, the spouse is linked via a common identifier to the original taxfiler). T1FF data go back to the 1982 tax year. With the experience gained from many years of T1FF processing, edit rules have been created to reduce the number of inconsistencies in the database and ensure that data quality continues to improve.
The availability of the tax variables depends on the information collected in a given year. The T1FF produced annually for the IMDB includes individual and family incomes as well as family composition variables, such as the number of kids and the spouse identification number. The IMDB contains IMDB_T1FFs for 1982 and subsequent years for immigrant taxfilers. The creation process of these files is described in Section 5.1. For more details on variables available on the IMDB_T1FFs, refer to the tax component of the IMDB dictionary.
2.3 Social Data Linkage Environment (SDLE)
To create the IMDB, the Social Data Linkage Environment (SDLE) is used to facilitate record linkages. The SDLE at Statistics Canada promotes the innovative use of existing administrative and survey data to address important research questions and inform socio-economic policy through record linkage. The SDLE expands the potential of data integration across multiple domains, such as health, justice, education and income, through the creation of linked analytical data files without the need to collect additional data from Canadians.
3 Concepts and variables
3.1 Immigrant status in Canada
The IMDB provides data on a subset of the immigrant population as described in Section 2. Following are the Statistics Canada definitions of the terms "immigrant" and "non-permanent resident."
The term "immigrant" refers to persons who are, or who have been at any time, landed immigrants or permanent residents. Such persons have been granted the right to live in Canada permanently by immigration authorities. Immigrants who have obtained Canadian citizenship by naturalization are included in this category.
"Non-permanent residents" are not considered immigrants, although they are a population of interest for the IMDB as described in Section 2. In the IMDB, the term "non-permanent resident" refers to persons from another country who have a work or study permit or who are refugee claimants.They are allowed to be in Canada for the period of time indicated on their permit.
3.1.1 Immigration to Canada: An overview
A Canadian Megatrends article, 150 years of immigration in Canada,Note 4 released in 2016, summarizes the fluctuation in immigration levels and source countries over the past century. Migration to Canada has been continuous since the country's foundation. More than 17 million immigrants have settled in Canada since 1867. The number of landed immigrants has been increasing from the low 200,000s in the 1990s to over 250,000 in the early 2010s. The proportion of Canadians who are foreign-born has increased from 14.7% in 1951 (2.06 million people) to 21.9% in 2016 (7.5 million people).
As per section 95 of the Constitution Act, 1867 federal and provincial governments have shared jurisdiction over immigration. Additional guidelines are set out in the 2002 Immigration and Refugee Protection Act (IRPA),Note 5 which provides the goals and strategic direction for immigration policy adopted by the Government of Canada and administered in part by Immigration, Refugees and Citizenship Canada (IRCC). Prior to 2002, the Immigration Act, 1976 served as the primary legislation regulating Canadian immigration.
Under IRPA, the Government of Canada is in charge of "establishing admission requirements, setting national immigration levels, defining immigration categories, determining refugee claims within Canada, reuniting families and establishing eligibility criteria for settlement programs"Note 5 in all provinces and territories except Quebec. The province of Quebec has full responsibility of its immigration levels, programs, and policies under the Canada-Quebec Accord Relating to Immigration and Temporary Admission of Aliens. However, the federal government continues to select and process immigrants sponsored by family and protected persons in Canada and refugee claimants to Quebec.Note 5
Permanent residents are defined as "persons who have been admitted to live in Canada on a permanent basis and who have the right to work and study in Canada, but have not become Canadian citizens."Note 6 Under IRPA, there are three overarching categories of immigrants: economic immigrants, family members, and refugees.
Permanent residents are eligible to become citizens of Canada when they meet certain requirements. The first is a residency requirement, whereby the permanent resident must have been physically in Canada for a set period of time. Permanent residents must also be older than 18 years of age; in the case of minors, the application must be made simultaneously (concurrent) with one or both parents or after one or both parents have become a Canadian citizen (non-concurrent). Permanent residents must have fulfilled their tax filing obligations to Canada. Permanent residents aged 14 to 64 years must also show proof of proficiency in at least one of Canada's official languages and must pass a citizenship test (IRCC 2016; Government of Canada 2016).
The IRPA stipulates that all foreign nationals, except permanent residents, who enter Canada must have a temporary resident visa. Temporary resident visas are issued to workers and students "in a way that maximizes their contribution to Canada's economic, social and cultural development and protects the health, safety and security of Canadians" (IRCC 2015, p. 7). Non-permanent residents are able to apply for permanent residency through different programs, and may have an advantage over applicants abroad if they have Canadian education credentials and/or work experience.
As regards refugee claimants, "the Refugee Protection Division (RPD) is the division of the Immigration and Refugee Board of Canada (IRB) that hears claims for refugee protection made in Canada and decides whether to accept them" (IRB 2015 p. 16). In the IMDB, these claimants are classified as non-permanent residents with a refugee claimant permit.
3.2 Target population and coverage period
The IMDB is a database that includes:
- All immigrants admitted to Canada between 1980 and 2017;
- All non-permanent resident permits since 1980;
- All tax files between 1982 and 2016 for linked immigrants.
The database also provides information on permits for immigrants who were non-permanent residents prior to their admission as permanent residents.
The T1FF covers "all persons who completed a T1 tax return for the year of reference or who received CCTB (Canada Child Tax Benefits), their non-filing spouses (including wage and salary information from the T4 file), their non-filing children identified from three sources (the CCTB file, the births files, and an historical file) and filing children who reported the same address as their parent". Family information is created based on a census family concept: parent(s) and children living at the same address (Statistics Canada 2018).
The IMDB brings together, via probabilistic record linkage (Section 4), administrative data from Immigration, Refugees and Citizenship Canada (IRCC) and the tax files from the T1 Family File (T1FF).
3.3 Admission variables
Immigrants are admitted into Canada under a number of programs, each of which has specific objectives. These programs specify the conditions under which immigrants are admitted into the country and the type of settlement assistance they may receive. Consequently, analyses that guide public policy should usually take this information into consideration. To answer a variety of research questions, the IMDB comprises a number of variables related to the admission of immigrants, which are all derived from two main concepts: admission category and type of applicant.
3.3.1 Admission category
The admission category refers to the name of the immigration program or group of programs under which an immigrant was first granted the right to live in Canada permanently by immigration officials since 1980. Over the years, immigrants have been admitted into the country under several dozen different programs. In an effort to make these data easier to use, the IMDB provides users with a number of variables that comprise aggregate programs with similar objectives. The highest level of aggregation is based on the three main objectives of Canada's immigration policy: contribute to the country's economic development, reunite families, and protect refugees.
3.3.1.1 Economic immigrants
The purpose of admitting economic immigrants is to help achieve the first immigration policy objective stated above: contribute to the Canadian economy. Economic immigrants are covered under three main program groups: worker programs; business programs; and provincial and territorial nominee programs.
Immigrants selected for their ability to participate in the labour market are admitted under worker programs. Once their skills and professional experience have been evaluated, they are divided into four main categories:
- Skilled workers selected based on their skills and experience working in management or professional positions, in technical jobs, or in skilled trades.
- Skilled tradespeople selected based specifically on their skills and work experience in an eligible skilled trade. This category differs from the skilled workers category as applicants are required to have a valid offer of employment from a Canadian employer or a certificate of qualification from a Canadian provincial or territorial organization.
- Immigrants admitted under the Canadian Experience Class differ from the two first groups in that they are required to have work experience in Canada acquired in a managerial or professional position, a technical job, or a skilled trade.
- Live-in caregivers and caregivers can obtain permanent resident status if they have provided in-home care in Canada for a given period to children or people with special needs such as the elderly, people with a physical handicap, or someone suffering from a chronic illness.
Economic immigrants admitted into Canada under a business program are divided into three main categories:
- Entrepreneurs selected for their skills and their ability to either own and manage a business, or to establish an eligible business in Canada. Some have a minimum net worth, while others are required to have the backing of a designated organization for their business idea.
- Investors given permanent resident status provided they make a significant investment in Canada. These investments are allocated to participating provinces and territories in order to stimulate economic development and create jobs.
- Self-employed workers who are given permanent resident status provided they have the ability—and the intention—to create their own job in Canada and to make a significant contribution to the Canadian economy. This is a broad category that also includes people who intend to make an important contribution to the country's sporting or cultural landscape (i.e., as an artist, actor, writer, or professional athlete).
The final main category under which economic immigrants are admitted into Canada are provincial and territorial nominee programs. As the name implies, this category is for immigrants selected by a province or a territory for their ability to contribute to the local economy by meeting specific labour needs. They are assessed based on selection criteria relating to education, work experience, and their specific skills. All participating provinces and territories have their own selection criteria for their fields of interest (students, business people, skilled workers, or semi-skilled workers).
3.3.1.2 Family sponsorship
The admission of immigrants sponsored by family members is intended to reunite families; this allows Canadian citizens and permanent residents to sponsor their relatives. Immigrants admitted under these programs can be given permanent resident status on account of their relationship as spouse, partner, parent, grandparent, or child.
Under certain conditions, immigrants admitted under these programs can also be sponsored by reason of another family relationships, such as young siblings, nieces and nephews, and orphaned grandchildren. Canadian citizens and permanent residents living in Canada can also sponsor someone on the basis of a relationship other than the ones listed above.
Finally, there are cases in which immigrants who would not otherwise have qualified under any other program were sponsored by a Canadian citizen or a permanent resident living in Canada, and who were exceptionally granted permanent resident status on humanitarian grounds.
3.3.1.3 Refugees
The third and final objective of Canada's immigration policy is the protection of refugees, or people who have a well-founded fear of returning to their country of origin. This category includes people who have good reason to fear persecution based on race, religion, nationality, membership in a particular social group, or political opinions (refugees as defined by the Geneva Convention). It also includes people who have been seriously and personally affected by civil war, armed conflict or a massive violation of human rights. Some refugees were already in Canada when they applied for refugee status for themselves and for family members who were with them in Canada or abroad. Others were abroad and were referred for resettlement to Canada by an office of the United Nations High Commissioner for Refugees (HCR) or another referral organization. Referred immigrants receive resettlement support from government sources, organizations, individuals, or private sector groups, or combined support from the Government of Canada and private sector stakeholders.
3.3.1.4 Other immigrants
In addition to the three key objectives listed above, Canada's immigration policy gives immigration officials a certain degree of discretion to grant permanent resident status under a program for people who are neither economic immigrants, sponsored by a family member nor refugees. This program is for applicants such as immigrants who are exceptionally granted permanent resident status on humanitarian grounds or on the basis of public interest considerations.
3.3.2 Type of applicant
In addition to the admission category, the IMDB gives users access to information on applicant types. This information indicates whether the immigrant is listed as principal applicant, spouse or dependent on the application for a permanent resident visa.
As a general rule, information on the type of applicant is used for analyses to study economic immigrants. Since the principal applicants admitted under these programs are selected on the basis of their ability to contribute to the Canadian economy, it is helpful to separate them from their spouse and dependents, who were not assessed for this ability. Isolating principal applicants from other types of applicants makes it possible to study the efficiency of these programs more directly.
However, with regard to family reunification and refugee protection, the purpose of the immigration policy is the same for all applicants, regardless of type. In the case of immigrants admitted under these two objectives, the concept of "applicant type" takes on more of an administrative value.
This value is particularly pronounced for immigrants with principal applicant status, which does not systematically depend on the legal relationship between the applicants requesting permanent residence. For instance, for the "sponsored spouses and partners" admission category, the spouse is listed as the principal applicant, although "spouse" does not appear as the type of applicant on the application for residence. In addition, for the "sponsored children" admission category, principal applicant status is assigned to one of the children, while the others are listed as dependents. Finally, in certain circumstances, applications for permanent residence can be processed on two fronts: from Canada for the principal applicant and from abroad for the other family members. This type of process exists for live-in caregivers and protected persons in Canada. In these cases, a family member applying from abroad is given principal applicant status, even if he or she is the spouse of an immigrant whose application submitted in Canada has been previously approved.
3.3.3 Changes over time
The IMDB contains over 30 years' worth of data on immigrants admitted to the country. However, policies and programs underwent many changes during that time. New programs were created, others were abolished, and in some cases, selection and eligibility criteria were changed. Therefore, a person admitted as a skilled worker in 1980 was not necessarily assessed on the same criteria as a skilled worker admitted in 2000. Although every effort was made to create aggregate programs that are as similar as possible, IMDB users should be aware of these differences when drawing conclusions about various landing cohorts.
The most striking change implemented during the period covered by the IMDB is undoubtedly the replacement of the Immigration Act, 1976, by the Immigration and Refugee Protection Act, which came into force in 2002. While both these laws cover the same three key groups (economic immigrants, family sponsorship, and refugees), administration of these programs underwent many changes under these laws. In addition, program administration was also modified based on sociodemographic needs and priorities set by successive governments within these two legislative frameworks. As a result, it is strongly recommended that data users with an interest in a specific program or a number of landing cohorts find out more about policy and program changes relevant to their field of study.
It should be noted that it may take a few years for the impact of an administrative change to be observed in the database. For instance, when a new program is created, it may take several months or years from implementation (i.e., the date on which applicants can apply) to the time immigrants are first admitted into the country under the new program. The same can be said about abolished programs. There may well be a delay between the time all the applications have been studied and all eligible applicants have entered the country, and the time when abolished programs vanish completely from the statistics on annual admissions.
3.3.4 PNRF admission category variables
A variety of admission category variables exist in the PNRF. These are described in the immigration component of the IMDB dictionary. This section provides additional information on some of these variables.
The most detailed is IMMIGRATION_CATEGORY, which includes over 100 categories that existed at any point from 1980 to the present IMDB. An aggregated version of the information available in the variable IMMIGRATION_CATEGORY is available in the derived variable IMMIGRATION_CATEGORY_CENSUS, which contains fewer categories.
The aggregate variable IMMIGRATION_CATEGORY_CENSUS is a categorization in line with Statistics Canada's standard used in the Census of Population. However, it does not make clear that some immigrants were admitted through the Backlog Clearance and Administrative Review programs. These programs expedited the processing of immigrants in the late 1980s, in response to geopolitical crises abroad that affected temporary residents' ability to return to their countries (e.g., Tiananmen Square protests and dissolution of the USSR and Yugoslavia). The result of not separating these categories is that these individuals, processed quickly and with distinctive criteria, are not comparable to other immigrants processed in the same categories. To identify immigrants admitted through these programs, users should refer to the variables BACKLOG_CLEARANCE_IND and ADMINISTRATIVE_REVIEW_IND (available in the PNRF_extra, for landing years prior to 2014).
The user may also use the immigration aggregate information from the IMMIGRATION_CATEGORY_ROLLUP2, available in the PNRF_extra for immigrants landed up to 2013. This variable was designed to provide consistent reporting across different policy / regulation changes (i.e., Immigration and Refugee Protection Act (2002) and Immigration Act, 1976) and to maintain specific immigration programs (i.e., skilled workers) over time. This variable offers the detailed information on backlog clearance and administrative review. Detailed grouping information for derived variables is available in the IMDB immigration data dictionary.
Another consideration with the admission category variables is their relation to type of applicant (PNRF variable FAMILY_STATUS). As a general rule, the principal applicants are the individuals being assessed on admission criteria under each of the categories, while their accompanying spouse and dependents are admitted automatically with the principal applicant (although the spouse's language skills can be an asset to economic category immigrants' applications as well). In the rollup variable, some of the admission categories explicitly state whether they represent (1) principal applicants or (2) spouses and dependents, while other categories (i.e., Immigrant sponsored by family) must be cross-referenced with the FAMILY_STATUS variable to determine an individual's status as a principal applicant or as a spouse / dependent.
Two categories constitute exceptions to the above: Live-in Caregiver Dependents and Refugee Dependents. When cross-referenced with FAMILY_STATUS_ROLLUP, these variables contain principal applicants as well as dependents. This can happen when the principal applicant is already in the country and his or her dependents submit a separate application for permanent residence from abroad. As each separate application must have a principal applicant, even a nominal one, one of the dependents (usually the spouse) is considered the "principal applicant" for the dependents' application. There is, however, no difference in processing between the principal applicants, spouses, and dependents in these two admission categories.
3.4 Variables of interest
The IMDB is an extensive database, providing researchers with a myriad of variables to study outcomes related to immigrant characteristics and various long-term impacts. The number of variables exceeds 600 variables on the largest tax files (with roughly half at the individual level and half at the family level of aggregation). The Integrated Permanent and Non-permanent Resident File (PNRF) contains over 50 variables. While the exact definitions of these variables are covered in the immigration component of the IMDB dictionary, some of the more nuanced concepts warrant elaboration in this report. The following sections discuss geography, time, education and intended-occupation variables to provide further insight into the meaning and use of these variables. More detailed information on income variables can be found in the tax component of the IMDB dictionary. New variables were added to the 2016 IMDB, which include Syrian refugee resettlement waves (SYRIAN_RRW), Express Entry (EXPRESS_ENTRY_IND) and the year and month of citizenship (CITIZEN_YEAR and CITIZEN_MONTH).
Variables in the PNRF refer to immigrants' characteristics at landing or upon reception of a temporary resident document, while variables in the tax files refer to characteristics at taxation year. Whereas some variables are available in both files, the taxation variables are subject to changes over time. For example, age is available in both files and is expected to change in the tax file each year. Immigrants' marital status (MARITAL_STATUS) and destination province (DESTINATION_PROVINCE) upon application for permanent residence can also be different from the marital status (MSTCO) and province of residence (PRCO) when tax returns are filed. For variables not expected to change through time, the PNRF should be used for consistency.
3.4.1 Geography variables
The IMDB enables the study of immigrant taxfiler mobility and retention in Canada over time. It is to be noted that complete outmigration cannot be captured, as there is no requirement for immigrants or filers to declare that they have left, or will be leaving, the country. Both the PNRF and tax files contain various measures of geographic location that allow researchers to establish an intended destination at admission and subsequent area of residence for immigrants. In the PNRF, intended destination is measured at the provincial, census metropolitan area, census division, and census subdivision levels. These variables originate from a self-reported destination at landing on the immigration application. Unlike the T1FF geography variables, the landing file variables are available only for the geographies defined in the latest available census; this means that they reflect only the most recent census boundaries.
The other geography available on the landing file is province of nomination, available for provincial nominees. The province indicated is the one under whose criteria the applicant has been admitted; however, it does not necessarily correspond to the province-of-destination variable.
Under geographies of origin, the country variables on the landing file indicate the individual's country of birth, country of citizenship, and last residence at the time of landing. It should be noted that these geographies may not be comparable over time, as national boundaries change from year to year. Some examples include the dissolution of the USSR, Yugoslavia, and Czechoslovakia; the union of Sikkim and India and of Vietnam and North Vietnam; and the creation of South Sudan.
Some individuals in the landing file report their country of birth as Canada. Normally, those who are born in Canada are granted citizenship at birth and do not need to apply for permanent residency. Those on the landing file who are born in Canada are most likely individuals born to foreign diplomats while residing in Canada who later chose to apply for permanent resident status.
A number of geographic variables in the T1FF datasets refer to slightly different notions of geographical location from the landing file. The most detailed geography in the T1FF is available at the census tract level; it is derived from the postal code of the mailing address (PSCO_). The postal code generally indicates the address of residence at tax filing in the spring of the following year. The mailing address may also refer to a business, such as an accounting firm or a law firm, and is not necessarily the person's current address. As a result, the province of residence on December 31 of the tax year (PRCO_) may not be the same as the province (PR__) derived from the mailing address. This distinction is important, since the derived census geography variables (e.g. CMA, CSD) may not correspond to the province of residence on December 31 (PRCO_; however, they should correspond to the province code (PR__). The PRHO_ variable indicates an alternative to the mailing address and exists only for 2008 and subsequent years. Moreover, while the variable named taxing province code (TXPCO_) is, by definition, the same as the province of residence on December 31 (PRCO_), the taxing province code (TXPCO_) is less reliable (a known data quality issue exists with this variable, where both missing values and Newfoundland and Labrador are coded as "0"). For more information regarding the quality of geography variables please refer to Section 7.6.
Using the tax file variables to study geographic mobility amongst immigrants requires careful consideration of timing in making inferences about relocation and location of work. A researcher's guide to studying mobility and retention is included in Appendix D.
3.4.2 Time variables
"Landing year" and "tax year" are time variables often used to produce tables and perform analyses using the IMDB. The landing year is the year when the immigrant was granted permanent resident status, while the tax year is the tax filing year.
It is recommended that "landing year + 1" be counted as the first year of income, as it is the first full year in which the person will be in the country. Taxes filed in the year of admission should be interpreted with caution. First, about 50% of each landing cohort first files taxes in the landing year (proportion based on taxfilers from linked immigrants). Secondly, taxes filed in the same year as admission may not represent a full year of income. An individual who landed in October 2010 will have only three months of income to declare in the spring of 2011, while an individual who landed in January 2010 will have 12 months of income to declare.
It is also possible to see taxes filed for individuals after their year of death, for example, in cases where the deceased person's relatives file taxes on his / her behalf. The variable Family Type (FCMP_) from the T1FF would be used in such cases. Please refer to the data dictionary for more details.
For example, Table 1 illustrates possible scenarios and describes which records should be included in a study to evaluate the socio-economic outcomes of the 1995-to-2000 immigrant cohort five years after landing. In order for a record to be included, the immigrant must have landed in any year from 1995 to 2000 and filed taxes five years after landing. This analysis would include the following IMDB records: IM19952 and IM19963.
| IMDB_ID | Landing_Year | Available tax years | Included in scope of study |
|---|---|---|---|
| IM19801 | 1980 | 1982 to 2013 | No, landed prior to 1995 |
| IM19952 | 1995 | 1988 to 2011 | Yes |
| IM19963 | 1996 | 1996 to 2013 | Yes |
| IM19974 | 1997 | 2010 to 2013 | Yes, but no tax files available 5 years after landing |
| IM20095 | 2009 | 2011 to 2013 | No, landed after 2000 |
|
Note: This example is based on fictitious data. Source: Statistics Canada, example from the Longitudinal Immigration Database. |
|||
One of the shortfalls of using administrative tax data is a lack of precision with respect to timing. Apart from the year for which taxes are declared, no timing variables exist in the T1FF. This presents difficulties for studying job and unemployment spells, timing of relocation, and marriage. It also makes it difficult to distinguish self-employed individuals who are also seasonal employees from those who concurrently earn income from both sources. Despite these limitations, decisions about timing can still be informed by keeping in mind the following considerations.
Since the previous year's taxes are typically filed in the spring of the subsequent calendar year, some uncertainty may arise with respect to the specific year in which a change in address occurred. For example, Person A could file 2011 taxes with a mailing address in Toronto, and could then file his or her 2012 taxes with an Ottawa mailing address. It may be inferred that Person A lived in Toronto when filing 2011 taxes in the spring of 2012 and lived in Ottawa in the spring of 2013. Person A could have moved either in 2012, after filing the previous year's taxes, or in the first few months of 2013 prior to filing his or her 2012 taxes. If Person A moved between provinces, the variable for the province of residence on December 31 (PRCO_) could be useful in narrowing down the year of the move, since it relates to this person's province of residence as at December of the tax year. It should be noted that the mailing address does not necessarily correspond to the location of residence.
3.4.3 Education variables
Several variables in the landing file, such as years of schooling and education qualifications, allow education at landing to be measured. The former takes the form of a write-in answer to the question "How many years of formal education do you have?" The latter is phrased as "What is your highest level of completed education?" options are provided. The derived "Level of Education" variable combines information from the two.
Data quality issues were identified with these education variables since 2011. For example, a significant proportion of individuals in these years did not state their education qualifications or years of schooling and were coded as "0" ("None") on EDUCATION_QUALIFICATIONS and YEARS_OF_SCHOOLING instead of "Missing." In 2011, up to 35% of immigrants stated that they had no education qualifications, compared to roughly 10% in the 1990s. The education variables for 2011 to 2017 were imputed to resolve data quality issues. For more details on the imputation, see Section 7.3.
3.4.4 Intended-occupation variables
IRCC collects the intended occupation from the record of landing and assigns it a classification according to 2011 National Occupational Classification (NOC) codes in the landing file. These are broadest at the skill level, with a five-digit NOC codes being the most specific (see dictionary appendix for full definitions).
While intended occupation is also considered to be a good proxy of the individual's source-country occupation, caution is recommended. In order to list a specific intended occupation, applicants must prove that they have obtained the necessary education qualifications, as well as at least one year of experience in the field. As a result, this is considered to be a conservative measure for the intended variable after arrival by IRCC, as these requirements are quite stringent. For example, students completing a degree in engineering cannot list their intended occupation as engineer (given their lack of work experience) and are instead classified as students. Additional variables such as labour market intention (LM_INTENTION) and skill level (SKILL_LEVEL) can be used to obtain information on an individual's source-country field of work. Also, it should be noted that the intended occupation field is mandatory for principal applicant immigrants within the economic categories. For all other immigrants, the information may not be as reliable as a measure of their intended occupation.
3.4.5 Other IMDB variables
Only variables that require detailed explanation and can present the most difficulty for analysts were included in Section 3.4. For further details on the variables included in the IMDB, please refer to the IMDB dictionaries. The tax component describes the variables included in the IMDB_T1FF files while the immigration component describes the variables included in the other files. These dictionaries are available to data users, or can be obtained upon request by writing to Statistics Canada at STATCAN.infostats-infostats.STATCAN@canada.ca.
IMDB data users should be aware that data from the immigration files and the tax files are collected at different times and that, in some instances, individuals' characteristics evolve with time. As a result, the marital status and the composition of a person's family might change through the years and consequently differ between the PNRF and the T1FF. The variables to use for analysis depend on the subject of the study.
4 Record linkageNote 7
As described in this document, the IMDB is the product of numerous record linkages. It was created for the purpose of providing statistical information in an anonymous format. This section gives an overview of the record linkage methods used to create the IMDB. For more details regarding data processing related to record linkage, see Section 5.
Record linkage is the process of matching records between or within databases. This approach is commonly used to fill data gaps and create a dataset with broad applications (Rotermann and al. 2015).
To produce the IMDB the Social Data Linkage Environment (SDLE) was used. It is a highly secure linkage environment that facilitates the creation of linked population data files for social analysis.
At the core of the SDLE is a Derived Record Depository (DRD or Depot), a national dynamic relational database containing only basic personal identifiers. The DRD is created by linking selected Statistics Canada source index files for the purpose of producing a list of unique individuals. These files, which contain personal identifiers without analysis variables, are brought into the environment, processed and linked only once to the DRD. Updates to these data files are linked to the DRD on an ongoing basis.
In 2018, the linkage rate to the depot for the landed immigrants was 97.6% (Cascagnette, 2018).The probabilistic method was used to link IRCC's immigration data to CRA's tax data. To perform the record linkage G-Link was used.
The generalized record linkage system used at Statistics Canada, G-Link, is based on the mathematical theory of record linkage developed by Ivan P. Fellegi and Alan B. Sunter. Probabilistic record linkage methodology compares non-unique identifiers (e.g., name and birth date) and estimates the likelihood that records being matched refer to the same entity (e.g. individual). Probabilistic record linkage is especially valuable when the identifiers are prone to change (e.g. surnames of females who get married), error-prone and frequently missing.
Comparisons between records are done field-by-field using comparison rules with outcomes such as exact match, string proximity, missing information or fields disagreement generated by each rule based on the similarity of values in a pair of records. Each pair of records is assigned a comparison result pattern and that pattern is evaluated to classify pairs as linked, possibly linked or not linked.
The theory of probabilistic record linkage is based on the premise that the results of certain comparison result patterns are characteristic of truly linked pairs, while others are characteristic of truly unlinked pairs. Therefore, each rule outcome is assigned a weight based on the ratio of the estimated probability of the outcome occurring for true matches to the estimate probability of the outcome occurring for non-matches.
The composition of the linked set is not known in advance, so the probabilities of result patterns for truly linked records are not known. Linked weight components are estimated from prior knowledge and early iterations of the linkage process, and refined by treating successive iterations of the linkage process.
The unlinked weight components are calculated based on the frequency with which the rule outcomes were observed among record pairs that do not belong together, which is approximately equal to the frequency with which the rule outcomes would be observed among randomly paired records. After repeated iteration of the linkage process, linked weight components stabilize and final weights are ready for use.
The strategy for the probabilistic record linkage involves the following six steps:
- Generate potential pairs using initial criterion
- Develop and apply comparison rules to potential pairs to derive probability ratios
- Apply frequency weights
- Assign linkage states to the pairs using probability ratios and thresholds
- Form groups
- Resolve conflicts using mapping.
Steps 2 to 4 are repeated iteratively.
Users of a dataset created as a result of record linkage need to be aware that linkage errors are possible. Record linkages will have one of four outcomes: true matches correctly classified as matches, true matches falsely classified as non-matches, true non-matches falsely classified as matches, or true non-matches correctly classified as non-matches (Winkler, W.E. 2009). As shown in the example in Table 2, where records from file 1 are linked to records from file 2, the result of the record linkage between two variables will be either a match or a non-match. A good record linkage will maximize the proportion of true matches correctly classified as matches and the proportion of true non-matches correctly classified as non-matches, and minimize the other record linkage outcomes.
| Record | File 2 | Type of Outcome | |||
|---|---|---|---|---|---|
| A | B | D | |||
| File 1 | A | Match | Non-match | Non-match | True match |
| C | Non-match | Match | Non-match | False match | |
| D | Non-match | Non-match | Non-match | False non-match | |
| E | Non-match | Non-match | Non-match | True non-match | |
| Source: Statistics Canada, example of record linkage outcomes. | |||||
The results of probabilistic record linkage are dependent on the quality of the linkage variables. For example, misspelled names or typos in the date of birth can create missed or erroneous matches. A non-match does not necessarily mean that the person did not file taxes. The record linkage rates for the most recent IMDB are available in Section 7.2.1.
5 Data processing
5.1 Processing
A number of government agencies are involved in the creation and processing of the IMDB. From initial data collection, to processing and dissemination, their cooperation is required to ensure the high standard of data quality that data users expect from Statistics Canada. At each step in the processing sequence, thorough manual and automated data quality checks are performed, and feedback loops are in place to correct any detected errors at the source. The following section briefly describes the annual processing that updates the IMDB.

Description for Figure 1
Figure 1 is a summary of the IMDB process flow. Input files are received. Immigration data, namely the Immigrant Landing File, the Non-permanent Resident File, and the Citizenship File are received from IRCC. Tax data, namely the T1 file, the Canada Child Tax Benefit (CCTB) and T4, are received from CRA. After the reception of the files, record linkages are done using Social Data Linkage Environment (SDLE) to identify tax filers. Then the final files of the Longitudinal Immigration Database (IMDB) are produced. From the immigration data, the PNRF, PNRF_Nonfilers, PNRF_Extra, NRF_Permit and NRF_Person datasets are created. From the tax data, the T1FF are created for years 1982 to 2016. Note: See glossary of terms for definitions of acronyms. The source for this figure is Statistics Canada.
As shown in Figure 1, Statistics Canada first receives from the Canada Revenue Agency (CRA) the T1 data, in a file called "Personal Master File" (PMF), and other tax files. The tax files are then used to create the T1 Family File (T1FF), where individuals are linked to spouses and children via a common identifier, and geographic variables are created. Statistics Canada performs manual quality checks, and compares estimates from the T1FF with other data sources, such as the census (in census years) and the Survey of Labour and Income Dynamics, as well as annual income statistics produced by the CRA.Note 8
On the immigration side, IRCC provides the data on landed immigrants, non-permanent residents and citizens used to produce the IMDB. These data serve to create the Immigrant Landing File (ILF) and the Non-permanent Resident File (NRF). The ILF and NRF are assumed to be complete censuses of permanent and temporary resident permits issued by IRCC since 1980.
In addition to adding the information for the most recent tax year, a full back-sweep of previous years is done in order to add tax information for any new individuals that have been linked. This could mean that a landed immigrant's or non-permanent resident's filed tax records are not linked in the IMDB one year but that their subsequent tax filings could still be linked in a later year. As methodology improves, the back-sweep could ensure that all their previous tax filings, if they are on the T1FF, can become linked as well. This is how, after the processing of the most recent tax data, individuals who had landed and filed taxes many years earlier could still be added to the IMDB. For individuals with multiple landings since 1980, data from the time of the first landing are retained.
Although taxes for a given year are usually filed in the spring of the following year (i.e., claiming 2014 income in 2015), there are exceptions. At times, someone may have filed taxes later in the year, and would not be included in that year's T1 processing done by Statistics Canada. When that file is handed down for IMDB processing, these late-filers are excluded and will not be included in the next year's processing, as the T1FF is not updated. Similarly, individuals who file taxes for previous years are not added to the IMDB for those years, as previous years' T1FF is not updated. In that case, a person's first on-time filing will show up as their first year in the database.
At this point, a series of programs are run to assess the data quality and linkage rates, ensuring that there are no duplicates and flagging outliers. Once the database is linked, it is deemed complete and dissemination is ready to take place. In the end, the database consists of SAS files, one tax file per year since 1982 (IMDB_T1FF_&year), and Immigration data files (PNRF_&year, PNRF_EXTRA_&year and NRF_PERMIT_&year). All these files are described in Section 2. The IMDB Unique Person Identifier (IMDB_ID) is used to connect all these files (see Appendix D.1 for programming tips).
5.2 Non-permanent Resident File (NRF) Linkage
The Non-permanent Resident File (NRF), provided by IRCC, covers records of temporary resident permits issued for 1980 and subsequent years. It provides some demographic information about non-permanent residents as well as detailed information regarding their permits, such as permit type and the valid-date range.
The NRF contains millions of observations. These, however, include duplicates, whereby a single individual may have a number of different IDs. This issue is due mainly to records from the late 1980s where the original person identification number was lost. These records have been removed by linking the NRF to itself. This has resulted in approximately 220,000 records (roughly 400,000 observations) being identified as duplicates. In cases where both non-permanent resident records had their own landing record, the duplication link has been nullified (applicable to fewer than 1,000 records), as it is assumed that the landing file contains unique identifiers. After cleaning, only distinct non-permanent residents remain.
Both immigration files (ILF and NRF) contain some demographic information. However, the demographic information contained in the two files may not always be consistent. This is the case when more than one source is available or when there is a conflict. It has been decided that information in the ILF on the Integrated Permanent and Non-permanent Resident File (PNRF) shall be retained in light of data quality issues with the NRF in its earlier years.
5.3 Derived variables included in T1FF
Once record linkages have been performed, immigration-specific variables for immigrants and temporary residents are added to the T1FF.
A flag that identifies a taxfiler's immigration status on the basis of the linkage to IRCC's immigration data is created. To determine whether a tax record belongs to a taxfiler who was a non-permanent resident, the flag TR_IND is available (1: yes; 0: no).
Derived variables that identify and describe families are also created. In each annual T1FF, it is possible to have an estimate of the number of immigrants in a family who landed in 1980 or thereafter (variable IMM80F&year). However, this can be an underestimation as this variable includes only filers and not imputed records, therefore children are under-estimated. It is also possible to determine whether the immigrant has a spouse (in the given taxation year) and whether this spouse is an immigrant or a non-permanent resident (variable SP_IDI&year). Data users can identify immigrants in the same family, each tax year, by using the variable Family Identification Number (FIN_). All members of a family have the same value for this variable, namely the IMDB_ID of the oldest family member who landed in 1980 or thereafter. The quality of these variables depends on the quality of the record linkage and the T1FF files, since only linked individuals will be counted (see Section 7.2.5).
The variables with the prefix TNK are counts of the number of claimed children of a given age in the families of immigrants and non-permanent residents (see the tax component of the data dictionary for more details). The term "children" ("child") is defined as any person who is single and living with one or two parents; a child can be of any age. For example, in Table 3, the family of immigrant identified as IM19801 has two children aged 1 in 2011 (TNK01I2011), while family IM19873 has a total of three children in 2011 (TNKIDI2011), one aged 0 (TNK00I2011), one aged 1 (TNK01I2011), and one who is older than 18 years of age (TNK19I2011). The immigrant IM20105 has no children in 2011.
| IMDB_ID | TNK00I2011 | TNK01I2011 | TNKxxI2011 | TNK19I2011 | TNKIDI2011 |
|---|---|---|---|---|---|
| number | |||||
| IM19801 | 0 | 2 | 0 | 0 | 2 |
| IM19802 | 0 | 1 | 0 | 0 | 1 |
| IM19873 | 1 | 1 | 0 | 1 | 3 |
| IM19994 | 0 | 0 | 0 | 1 | 1 |
| IM20105 | 0 | 0 | 0 | 0 | 0 |
|
Note: Not all variables are presented in this table. This example is based on fictitious data. Source: Statistics Canada, example from the Longitudinal Immigration Database. |
|||||
Another variable added to the T1FF is OUTLIER_IND (1: outlier; 0: no). It is a flag added to identify records with extreme incomes (see Section 5.5 for more details) and to be removed from any tables or calculation. Records identified as outliers have some extreme incomes that could bias analysis results.
5.4 Derived variables included in PNRF
When the PNRF is produced, some variables relating to tax filing patterns are derived and included in the file. The variable FIRST_TAX_YEAR indicates the first year for which a tax record was available for a given individual, while LAST_TAX_YEAR indicates the last year for which a tax file is available. It is to be noted that a tax record does not necessarily exist for every year between the first tax year and the last tax year. For example, a case where First_tax_year=1982 and Last_tax_year=2012 does not necessary indicate that the taxfiler has filed taxes continuously, as the tax file for 2006 may be missing, for example.
The variable PREFILER_IND is used to identify immigrants who have T1FF data prior to their landing year. Most have been linked to a non-permanent resident record, as expected (see Section 7.2.4 for more details).
5.5 Outlier detection
After creating the IMDB_T1FFs, outlier detection is performed on all tax files to identify outlier records. A record is deemed to be an outlier when it is determined to contain one or some extreme income values compared to other records. The criteria used to identify the outliers are confidential. The variable OUTLIER_IND is created to identify the records with extreme values.
The outlier flag, OUTLIER_IND, is in the tax files, but is not in the PNRF. A given person's record may be flagged as an outlier in a specific year without necessarily being found to be an outlier for all years for which the person filed taxes. All outliers are to be removed from analysis. As shown in Table 4, for person IM19802, only the 1983 record has been flagged as being an outlier, while person IM19801 has no tax files flagged as outlier. No outlier flag is available in 2012 for IM19994 because no tax records are available for that person in 2012.
| IMDB_ID | OUTLIER_IND1982 | OUTLIER_IND1983 | OUTLIER_INDyyyy | OUTLIER_IND2012 | OUTLIER_IND2014 |
|---|---|---|---|---|---|
| IM19801 | 0 | 0 | 0 | 0 | 0 |
| IM19802 | 0 | 1 | 0 | 0 | 0 |
| IM19873 | 1 | 1 | 1 | 0 | Note ...: not applicable |
| IM19994 | 0 | 0 | 0 | Note ...: not applicable | 0 |
|
... not applicable Note: Not all variables are presented in this table. This example is based on fictitious data. Source: Statistics Canada, example from Longitudinal Immigration Database. |
|||||
The outliers are removed from tabulations and any analysis. The IMDB excludes (the very few) large incomes as they would skew averages and give users an incorrect impression of the income situation for certain types of immigrants. Consider a fictitious example where the average income of Czech-Canadians is $40,000 in a given year and, the next year, it suddenly jumps to $500,000 because, by chance, a Czech hockey player landed. This would bias the "real" income situation for Czech-Canadians. For that reason, the "un-representative" Czech hockey player's income would be removed from calculations. There is a confidentiality component to this example, as well. If such a jump in average income were observed, one could deduce the Czech hockey player's income, which would be a breach of confidentiality. Incidentally, in some IMDB products, median income, which is more resistant to the changing influence of large individual values, is also provided as a measure.
When one is producing tables or analyzing data, records deemed to be outliers for a given year have to be removed from calculations relating to the year in question for the reasons mentioned above. For further details, see Appendix D.6.
6 Dissemination
Once the linkage is complete, the data files (see Section 6.3) are stored on Statistics Canada servers for data users to create customized tables and model output. Statistics Canada disseminates output via tabular and analytical products while maintaining strict adherence to the confidentiality of the data. Users who would like to obtain information pertaining only to the immigrant landing file (ILF) should contact IRCC, as the IMDB has data on immigrant taxfilers only. Members of the Research Data Centres (RDC) have direct access to administrative microdata files (see Section 6.2).
6.1 Analytical products
At Statistics Canada, the common repository is an online database which holds data tables that report immigrants' income by various individual characteristics and geographies. From the main page of the Data search engine at Statistics Canada website, the IMDB tables can be accessed by selecting "Immigration and ethnocultural diversity", "Immigrants and non-permanent residents", and then "Longitudinal Immigration Database" under "Survey or statistical program". It should be noted that Statistics Canada has replaced the Canadian Socioeconomic Information Management System (CANSIM) tables with a common repository in June 2018, where the IMDB tables can be found. It is to be noted that yearly updates of the IMDB are independent from one other. From year to year, there may have been changes to data processing. The income measures (averages and median) available on the tables are wages, salaries and commissions, employment insurance, investment incomes, self-employment earnings, and social welfare benefits (for details on how these measures are derived, see Appendix D.8).
For the 2016 IMDB, four tables based on IMDB data were produced at both national and provincial level, where incomes are in 2016 constant dollars:
Table 1 (43-10-0009): Income of immigrants, by sex, immigrant admission category, landing age group, years since landing, and landing year;
Table 2 (43-10-0010): Income of immigrants, by sex, immigrant admission category, pre-landing experience, years since landing, and landing year;
Table 3 (43-10-0011): Income of immigrants, by sex, immigrant admission category, pre-landing experience, world area, knowledge of official languages, and landing year for tax year 2016; and
Table 4 (43-10-0012): Mobility measures of immigrant, by province, sex, immigrant admission category, pre-landing experience, landing year and tax year.
All tables offer provincial breakdown. Atlantic Provinces are regrouped into one category, except for table 4. It is to be noted that the province is based on the province of residence on December 31 of the tax year (variable PRCO).
In addition, several analytical articles related to the IMDB have been written over the years (see Appendix C). Moreover, Statistics Canada analysts take ad hoc data requests from researchers and data users. These are filled on a cost-recovery basis.
6.2 Requesting analytical files
Once the IMDB has been released, all the analytical files described in this report (PNRF, PNRF_Nonfilers, PNRF_Extra, T1FF, NRF_Person and NRF_Permit) are also available to on-site researchers, who are granted access once they have deemed employee status with Statistics Canada. These individual micro-data are stripped of all identifying information (such as exact date of birth, landing date, Social Insurance Number (SIN), and name). Researchers unable to be physically present at Statistics Canada's headquarters can access files through the Research Data Centres (RDC) throughout the country. The RDCs provide researchers with direct access to a wide range of population and household surveys, as well as administrative data in a secure university setting. IMDB users can request custom tabulations from Statistics Canada; such requests are filled on a cost-recovery basis, and cost will vary according to the nature and type of each request.
Before any output can be released, results are vetted for confidentiality by Statistics Canada. Minimum cell size requirements and rounding minimize the risk of breach of confidentiality.
6.3 Other statistical programs using IMDB data
IMDB data are used in many Statistics Canada programs for a variety of purposes. The Longitudinal Administrative Databank (LAD) uses IMDB data to include a sample of 20% of IMDB records in its sample. The LAD also uses IMDB records to add immigrant-specific variables, such as landing year, to its databank.
The Canadian Employer-Employee Dynamics Database (CEEDD) is a set of longitudinal analytical data files maintained by Statistics Canada to provide matched data between employees and employers of the Canadian labour market for 2001 and subsequent years. The CEEDD files cover all individuals that can be identified from the T1 and T4 files as well as employer or self-employment information that individuals can be linked to. The IMDB is one of the component files of CEEDD, and this linkage allows researchers to conduct analysis related to labour market outcomes and job dynamics with respect to the immigrant population in Canada.
The 2013 General Social Survey (GSS) on Social Identity (SI) collects detailed information on the social networks and civic participation and engagement of Canadians. The 2013 GSS on SI was linked to the IMDB for the purpose of selecting a representative sample of the immigration population to support and evaluate immigrant policies and programs. In particular, Immigration, Refugees and Citizenship Canada (IRCC) used this linked data file to develop a descriptive profile of the social connections and civic engagement of immigrants across admission categories.
DEMOSIM,Note 9 a Statistics Canada microsimulation model, uses the IMDB-LAD for population projections for the provinces, territories, census metropolitan areas, and selected smaller geographies, on the basis of a number of characteristics. Census programs use the database for certification of immigration data.
The IMDB has been linked to multiple surveys, including the Longitudinal Survey of Immigrants to Canada (LSIC), the Longitudinal and International Study of Adults (LISA), and the Canadian Community Health Survey (CCHS). As a result of the IMDB integration to SDLE, there will be future linkages to other statistical programs.
6.4 ConfidentialityNote 10
Statistics Canada is committed to respecting the privacy of individuals. All personal information created, held, or collected by Statistics Canada is protected by the Privacy Act, as well as by the Statistics Act in the case of respondents to the agency's surveys.
In view of its unique mandate as the national statistical agency in collecting personal information solely for statistical and research purposes, Statistics Canada has prepared privacy impact assessments that address privacy issues associated with its survey activities.
Statistics Canada initiated a privacy impact assessmentNote 11 following approval by its Policy Committee (the agency's senior executive committee, chaired by the Chief Statistician) of significant changes to the Longitudinal Immigration Database. The purpose of this assessment was to determine whether there were any privacy, confidentiality or security issues associated with these changes and, if there were, to make recommendations for their resolution or mitigation.
This assessment concluded that, given existing Statistics Canada safeguards as well as the additional measures put into place for the Longitudinal Immigration Database, the risk of inadvertent disclosure is extremely low. The importance of the data to public policy outweighs the privacy implications. The governance mechanisms in place constitute safeguards against inappropriate use of the data. Through the periodic review by its Policy Committee, Statistics Canada regularly assesses the continued relevance of the IMDB and the value of the information against the implied privacy invasion.
The agency's statistical work involves record linkage projects that bring together information about individual respondents for research purposes. This is a recognized source of valuable statistical information, but the linkage must always serve a public good. To address possible privacy intrusions from this type of research, Statistics Canada not only has a directive in place, but also practices a well-defined review and approval process for all record linkages.
To ensure confidentiality, it is mandatory to round tabular and descriptive output when producing tables with IMDB data (see Appendix D.5).
7 Data evaluation and quality indicators
7.1 Error sources
Because the IMDB is the product of several record linkages, it is subject to different sources of errors, including record linkage errors, measurement errors and coverage errors. In this section, the sources of errors are explained and the prevalence of some of these errors is presented.
It is to be noted that, given that it is a census of immigrant taxfilers who landed in 1980 or thereafter, no weights are created in the IMDB. No adjustments are made for the missing tax years of filers or for linkage errors; no sampling is performed; and every linked taxfilers is kept in the final dataset. However, the linkage itself presents a form of sampling error when links are missed.
7.1.1 Record linkage errors
Datasets produced from the results of record linkages are subject to record linkage errors. Two types of errors are possible—false positives (false matches) and false negatives (false non-matches). A link is considered a false positive when two records not belonging to the same person are deemed a match. A link is considered a false negative when two records belonging to the same person are deemed a non-match.
It is possible to miss part of an immigrant's fiscal history since some immigrants have more than one social insurance number (SIN) through time (a temporary SIN assigned at arrival to the individual as a non-permanent resident, and later a permanent SIN assigned after landing). Both SINs are required in order to have a complete fiscal history from arrival in Canada. The LCF (described in Section 2.3) allows for identification of these SINs. It is possible that, in a few instances, some SIN connections are missed or false connections are made.
7.1.1.1 Duplicate records
Duplicates can occur during the integration of multiple analytical files, such as tax family files (T1FF), administrative records for admission (permanent residency), temporary resident permits, citizenship records, and others. While there are no identified duplicates on the final immigration files, there are identified duplicates on the final tax files affecting a total of 480 immigrant tax filers, out of 6,517,060 immigrant tax filers (0.007%). Identified duplicates are flagged in the IMDB tax files using the variable DUP_REC. To remove duplicates from analysis, users should filter the data with variable DUP_REC=0 (DUP_REC=1 provides the duplicated cases).
The IMDB is a large dataset of administrative nature. The identified duplicates have a negligible effect on resulting analysis of the IMDB. No immigrants admitted since 2011 are affected and the identified duplicates are not clustered to any specific subpopulation.
7.1.2 Measurement errors
Measurement error is the difference between a variable's measured value and its true value. This type of error can be attributed to a number of factors, including data capture (e.g., typos) and respondent error (e.g., misinterpretation of the question asked). This type of error was taken into account in the creation of the Integrated Permanent and Non-permanent Resident File (PNRF) to avoid conflicting information for any individual. For example, when a person has a record on both the ILF and the NRF, and the sociodemographic variables have inconsistent values, the values at landing (in the ILF) are kept. See sections 7.2 and 7.5 for some counts.
7.1.3 Coverage errors
Coverage errors are the result of omissions, erroneous additions, duplicates, and errors of classification of records in the database. Coverage errors can result from inadequate coverage of the population. They can create biased estimates, and the impact can vary for different sub-groups of the population. These errors often result in undercoverage. Undercoverage in the IMDB is in part the result of the exclusion of tax files of immigrant taxfilers from the database. Immigrants who do not file taxes for a given year or who file late would not have an IMDB_T1FF record although linked to tax and part of the population of interest. If, for any reason, an immigrant record was not included in the Immigrant Landing File (ILF), it would not be part of the IMDB. Overcoverage is the result of the addition to the database of records excluded from the target population. An immigrant could have more than one ILF record as a result of multiple landings not identified as such, for example. Please refer to Section 7.4 and Appendix B for more information on IMDB coverage.
7.2 Data accuracy
This section will discuss the accuracy of the immigration data. For details on the accuracy of the T1 Family File (T1FF), please refer to the T1FF entry (record number 4105).
The accuracy of the IMDB is dependent on the representativeness of the population included in it. A study conducted in the first years of the IMDB concluded that the IMDB "appears to be representative of the population most likely to file tax returns. Therefore, the results obtained from the IMDB should not be inferred to the immigrant population as a whole, but rather to the universe of tax-filing immigrants" (Carpentier and Pinsonneault 1994).
The reasons for the differences between taxfilers and the entire foreign-born population are explained in an article by Badets and Langlois (2000) describing the challenges of using the IMDB:
The characteristics of the immigrant taxfiler population will differ from those of the entire foreign-born population because the tendency or requirement to file a tax return will vary in relation to a person's age, family status, and other factors. One would expect a higher percentage of males to file a tax return, for example, because males have higher labour force participation rates than females. The extent to which immigrants are "captured" in the IMDB will also be influenced by changes to the income tax. For example, the introduction of federal and provincial non-refundable tax credit programs encourage individuals with no taxable income to file a return to qualify for certain tax credits. (Badets and Langlois 2000)
These statements on the representativeness of the IMDB are still relevant.
7.2.1 2016 IMDB: Linkage rates
This section is based on the 2016 IMDB. The overall linkage rate between IRCC immigration files and the SDLE Derived Record Depository was 97.6% (see Section 4). A link does not necessarily mean that a tax file is available since it is possible to link dependents of taxfilers or immigrants who have yet to file taxes. This SDLE theoretical linkage rate mostly informs on how well IRCC files could be associated within a larger repository environment.
Of the immigrants who landed in any year from 1980 to 2016, 83.0% were linked to at least one T1FF record. This rate represents the effective coverage of immigrant linkage to tax files. As presented in the following statistics, this coverage rate may change according to gender and age.The proportion of linked taxfilers by age group at landing and sex is shown in Table 5. The lower rates for the 0-to-14 age group are expected since those in this age group are not of working age. See Appendix B for rates by sex, age group and landing cohort.
| Age at landing | |||||||
|---|---|---|---|---|---|---|---|
| 0 to 14 | 15 to 24 | 25 to 34 | 35 to 44 | 45 to 64 | 65 and older | Total | |
| percent | |||||||
| Male | 54.1 | 90.3 | 92.7 | 92.5 | 89.3 | 77.7 | 82.9 |
| Female | 53.3 | 89.2 | 92.5 | 92.8 | 87.1 | 75.3 | 83.0 |
| Total | 53.7 | 89.7 | 92.6 | 92.7 | 88.1 | 76.3 | 83.0 |
| Source: Statistics Canada, 2016 Longitudinal Immigration Database. | |||||||
As immigrants become older, they start filing taxes and are included in the IMDB. Chart 1 shows that, among immigrants who landed at any age from birth to age 14, the proportion of linked taxfilers is higher for immigrants who landed prior to 2000 than for immigrants who have landed since 2000. Recent immigrants also have lower linkage rates. See Appendix B for table showing the proportion of linked taxfilers by age group at landing, sex and landing decade.

Data table for Chart 1
| Cohorts | Age groups | |||||
|---|---|---|---|---|---|---|
| 0 to 14 years | 15 to 24 years | 25 to 34 years | 35 to 44 years | 45 to 64 years | 65 years and older | |
| proportion | ||||||
| 1980 to 1989 cohorts | 0.72 | 0.85 | 0.91 | 0.91 | 0.80 | 0.58 |
| 1990 to 1999 cohorts | 0.80 | 0.92 | 0.93 | 0.93 | 0.89 | 0.76 |
| 2000 to 2009 cohorts | 0.53 | 0.93 | 0.92 | 0.93 | 0.93 | 0.88 |
| 2010 to 2016 cohorts | 0.09 | 0.86 | 0.94 | 0.93 | 0.89 | 0.83 |
| Source: Statistics Canada, 2016 Longitudinal Immigration Database. | ||||||
Chart 2 illustrates the proportion of filers, and the number of filers and non-filers by landing year, where the term "non-filer" means that no T1FF records are available. For the 2016 IMDB, the filing rate varies by landing year, ranging from 64.6% for those who landed in 2016 to 90.3% for those who landed in 1993. The filing rates increase with the number of years that immigrants stay in Canada; this may explain why the linkage rates are higher for those who landed in the 1980s and 1990s. See Appendix B, tables 14 and 15, for detailed distribution numbers by landing year.

Data table for Chart 2
| Landing Year | Taxfilers | Non-taxfilers | Rates |
|---|---|---|---|
| number of immigrants | percent | ||
| 1980 | 106,500 | 36,700 | 74.4 |
| 1981 | 98,500 | 30,000 | 76.7 |
| 1982 | 96,300 | 24,800 | 79.5 |
| 1983 | 71,200 | 17,900 | 79.9 |
| 1984 | 71,300 | 16,700 | 81.0 |
| 1985 | 69,400 | 14,500 | 82.7 |
| 1986 | 84,000 | 14,800 | 85.0 |
| 1987 | 130,700 | 20,400 | 86.5 |
| 1988 | 142,300 | 18,500 | 88.5 |
| 1989 | 170,000 | 20,700 | 89.1 |
| 1990 | 192,300 | 23,200 | 89.2 |
| 1991 | 208,700 | 23,100 | 90.0 |
| 1992 | 228,900 | 25,100 | 90.1 |
| 1993 | 230,800 | 24,900 | 90.3 |
| 1994 | 198,600 | 25,000 | 88.8 |
| 1995 | 188,500 | 23,600 | 88.9 |
| 1996 | 198,200 | 27,100 | 88.0 |
| 1997 | 188,800 | 26,600 | 87.7 |
| 1998 | 154,900 | 18,800 | 89.2 |
| 1999 | 167,800 | 21,600 | 88.6 |
| 2000 | 200,800 | 25,900 | 88.6 |
| 2001 | 219,500 | 30,200 | 87.9 |
| 2002 | 197,500 | 30,700 | 86.5 |
| 2003 | 188,800 | 37,700 | 83.4 |
| 2004 | 199,100 | 36,300 | 84.6 |
| 2005 | 217,700 | 44,100 | 83.2 |
| 2006 | 208,400 | 42,700 | 83.0 |
| 2007 | 193,700 | 42,500 | 82.0 |
| 2008 | 198,900 | 47,700 | 80.7 |
| 2009 | 202,200 | 49,400 | 80.4 |
| 2010 | 218,000 | 62,100 | 77.8 |
| 2011 | 190,800 | 57,300 | 76.9 |
| 2012 | 198,500 | 58,700 | 77.2 |
| 2013 | 198,000 | 60,500 | 76.6 |
| 2014 | 197,000 | 62,500 | 75.9 |
| 2015 | 197,200 | 73,800 | 72.8 |
| 2016 | 190,770 | 104,600 | 64.6 |
| Source: Statistics Canada, 2016 Longitudinal Immigration Database. | |||
7.2.2 Availability of date of death
The year and month of death, as well as a death flag, are included in the PNRF. In the 2016 IMDB, these variables were linked by using the Canadian Mortality Database (CMDB). In the past, these variables were based on Statistics Canada's Amalgamated Mortality Database (AMDB), which is a retired dataset that combined records between CMDB and vital statistics and tax files. The CMDB is an administrative database that collects information on death dates and cause of death from all provincial and territorial vital statistics registries in Canada. Some undercoverage, while minimal, exists in the database as it does not include deaths of Canadians (1) who died outside of Canada, with the exception of United States; (2) who served as members of the Canadian military, or (3) whose bodies were unidentified. Note that the CMDB does not include deaths which were reported in the tax files.
Individuals who died prior to 1981 or never filed taxes are less likely to be linked as a result of the files used for the linkages.
Chart 3 describes the general trend in the number of deaths per year since 1980. "Permanent resident" deaths refer to the deaths of all immigrants who landed in 1980 or thereafter and who did not have pre-landing experience. "Permanent resident with pre-landing permit" deaths refer to the deaths of all immigrants with pre-landing experience. The value "9999" represents the records of deceased immigrants for which the year of death is not available.

Data table for Chart 3
| Year | Permanent resident | Permanent resident and non-permanent resident |
|---|---|---|
| number of deaths | ||
| 1981 | 1 | 0 |
| 1982 | 130 | 0 |
| 1983 | 280 | 5 |
| 1984 | 350 | 20 |
| 1985 | 460 | 30 |
| 1986 | 610 | 40 |
| 1987 | 820 | 80 |
| 1988 | 970 | 80 |
| 1989 | 1,300 | 90 |
| 1990 | 1,500 | 130 |
| 1991 | 1,900 | 160 |
| 1992 | 2,200 | 210 |
| 1993 | 2,700 | 280 |
| 1994 | 3,200 | 340 |
| 1995 | 3,600 | 400 |
| 1996 | 4,000 | 440 |
| 1997 | 4,300 | 510 |
| 1998 | 4,700 | 560 |
| 1999 | 5,100 | 580 |
| 2000 | 5,200 | 590 |
| 2001 | 5,700 | 680 |
| 2002 | 6,000 | 770 |
| 2003 | 6,700 | 890 |
| 2004 | 6,900 | 910 |
| 2005 | 7,300 | 980 |
| 2006 | 7,600 | 1,100 |
| 2007 | 8,300 | 1,200 |
| 2008 | 8,600 | 1,300 |
| 2009 | 9,000 | 1,400 |
| 2010 | 9,200 | 1,600 |
| 2011 | 9,900 | 1,700 |
| 2012 | 10,000 | 1,800 |
| 2013 | 10,900 | 1,900 |
| 2014 | 11,700 | 2,100 |
| 2015 | 12,346 | 2,300 |
| 2016 | 12,900 | 2,500 |
| 9999 | 130 | 170 |
|
Note: The value 9999 is assigned when the date of death is missing. Source: Statistics Canada, 2016 Longitudinal Immigration Database. |
||
7.2.3 Prefilers compared to records on the Non-permanent Resident File (NRF)
The results included in this section are drawn from a study based on the 2014 IMDB. Prefilers are immigrants who filed taxes prior to their landing year. It is sometimes assumed that all prefilers are immigrants who were non-permanent residents prior to landing. This section discusses why it is not the case. A total of 1.26 million individuals filed taxes before officially landing in 1980 or a subsequent year—of these, 212,500 are not linked to a non-permanent resident record as may otherwise be expected. Upon further investigation, it has been discovered that most permanent resident prefilers not linked to a non-permanent resident record are likely immigrants who have filed taxes when not required: 96% of these prefilers filed taxes only for the year prior to landing, and 75% reported no income (96% had no employment income). As shown in Chart 4, most of these prefilers landed in the first months of the year, prior to the deadline to file taxes for the previous year. It appears some immigrants who landed prior to the month of May filed taxes for the year prior to their landing year, for which they were not required to file.
Given these findings, whether it is appropriate to remove records with Prefiler_ind=1 and TR_IND=0 from studies on immigrants with pre-landing experience depends on the analysis since TR_IND=0 means no record is available on the non-permanent permit file.

Data table for Chart 4
| Landing month | Number of immigrants |
|---|---|
| January | 32,300 |
| February | 36,100 |
| March | 35,500 |
| April | 24,100 |
| May | 20,500 |
| June | 18,200 |
| July | 16,100 |
| August | 11,200 |
| September | 9,800 |
| October | 5,500 |
| November | 2,000 |
| December | 1,200 |
| Source: Statistics Canada, 2014 Longitudinal Immigration Database. | |
Not all immigrants with pre-landing experience are identified as prefilers: 478,100 immigrants have non-permanent resident records with Prefiler_ind=0. Depending on the subject of interest, using the TR_IND=1 or the number of temporary resident permits (variable NUMBER_ALL_PERMITS) is more appropriate to study immigrants with pre-landing experience. Prefiler_ind=0 indicates that no tax records have been filed prior to landing, but this does not mean that the individual had no pre-landing Canadian experience.
7.2.4 Spouse indicator
The IMDB contains variables that enable data users to obtain information on marital status and spouses. The following section contains results of a study done on the 2012 IMDB. No major changes have occurred since then in the marital status codes or family flag.
The spouse identification number (SP__IDI) is derived from tax files. This information can be derived only when the respondent claims his or her spouse or common-law partner while filing taxes; this causes an underestimation of couples as compared to the marital status declared in the tax files. From the T1FF, it is also possible to obtain the marital status at time of filing.
Prior to 1991, the "single" category was not available as marital status (MSTCO). The "common-law" status was made available as of 1992 for all datasets (1982 to 2012). Since 1992, the proportion of IMDB records indicating marital status as "single" has ranged from 20% to 30%. The proportion of "separated" has declined from 30% prior to 1992 to 4% after. The other marital status categories have not been affected by pattern changes.
Analysis done on the distribution of marital status (MSTCO from tax files) and the spouse ID (SP__IDI) shows differences between the two variables. This is because values for marital status are missing for some records. In a perfect situation, the records of all married persons would have spousal information, and the records of all single persons would have no spousal information. This analysis shows data quality to be better after 1992, when separate statuses for "common-law" and "single" were introduced.
Presence of spouse reporting gaps
Further to a review of the longitudinal history of immigrants on the 2012 IMDB, some cases where the spouse or common-law partner is missing (or different) for a given year and the same spouse is declared two or three years later have been found. The Chart 5 gives a summary of these gaps.
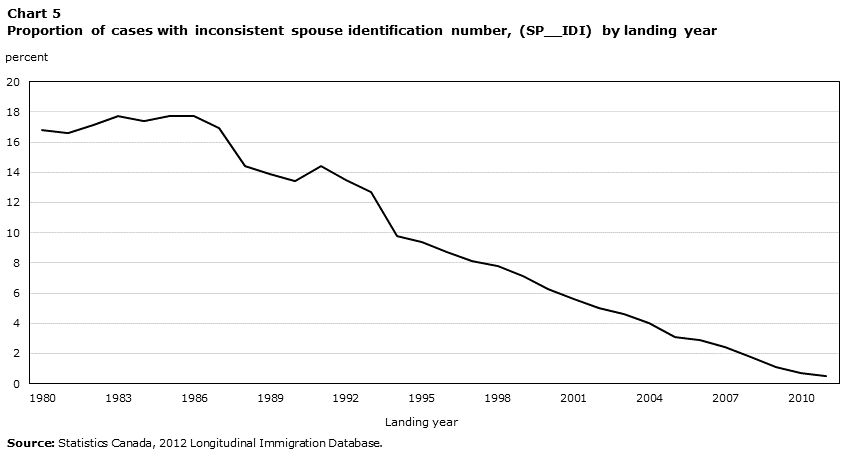
Data table for Chart 5
| Tax year | Percent |
|---|---|
| 1980 | 16.8 |
| 1981 | 16.6 |
| 1982 | 17.1 |
| 1983 | 17.7 |
| 1984 | 17.4 |
| 1985 | 17.7 |
| 1986 | 17.7 |
| 1987 | 16.9 |
| 1988 | 14.4 |
| 1989 | 13.9 |
| 1990 | 13.4 |
| 1991 | 14.4 |
| 1992 | 13.5 |
| 1993 | 12.7 |
| 1994 | 9.8 |
| 1995 | 9.4 |
| 1996 | 8.7 |
| 1997 | 8.1 |
| 1998 | 7.8 |
| 1999 | 7.1 |
| 2000 | 6.3 |
| 2001 | 5.6 |
| 2002 | 5.0 |
| 2003 | 4.6 |
| 2004 | 4.0 |
| 2005 | 3.1 |
| 2006 | 2.9 |
| 2007 | 2.4 |
| 2008 | 1.8 |
| 2009 | 1.1 |
| 2010 | 0.7 |
| 2011 | 0.5 |
| Source: Statistics Canada, 2012 Longitudinal Immigration Database. | |
Most immigrants on the file have one or no spouse in the years from 1980 to 2012 according to the IMDB_T1FF files. It is to be noted that no marital status (and no spouse info) is available for 1.2 million immigrants out of approximately 6 million immigrants.
7.3 Imputation of education variables
A data quality issue regarding the variables for education qualifications and years of schooling was identified. A non-negligible proportion of individuals who did not state their education qualifications or years of schooling were coded as "0" or "None" instead of "Missing" on EDUCATION_QUALIFICATIONS and YEARS_OF_SCHOOLING. This problem was prevalent from 2011 to 2014. In 2011, 35% of immigrants stated that they had no education qualifications, compared to roughly 10% in the 1990s.
This issue was resolved by imputing the education variables by means of values for education variables from 2008 to 2010 to model the most recent year's education variables. For the imputation, variables such as landing age, immigration_category_rollup2, intended occupation, gender and country of last permanent residence were used. The nearest-neighbour imputation method was employed. The variable Education_imputation_ind (0: no; 1: yes), available in the PNRF, was created to identify records with imputed education variables.
For immigrants admitted in 2015 and 2016, the number of cases where a non-stated education was coded to "0" or "None" instead of "Missing" was reduced. However, a non-negligible number of records had a missing education qualification with a valid number of years of schooling. For these records, years of schooling was used to impute a value for education qualifications.
For the 2016 IMDB, the data quality issue remains due to the increase of missing education qualification and years of schooling. As a result, data on education has been suppressed for admission year 2017.
7.4 Coverage
7.4.1 Coverage of the Integrated Permanent and Non-permanent Resident File (PNRF)
The 2016 Integrated Permanent and Non-permanent Resident File (PNRF) contains over 7.7 million records (Table 6); of these, over 6.4 million records (83.0%) are linked to at least one tax file. It is to be noted that immigration data belonging to non-taxfilers are included in a file named PNRF_NONFILERS_2016 while the taxfilers immigration data are in a file named PNRF_2016. The following table shows the distribution of records depending on their presence in the different immigration and tax files. About 1.7 million records belong to immigrants who were temporary residents prior to becoming permanent residents; over 1.6 million of these records are linked to at least one tax file. See Appendix B for detailed distribution numbers by landing year.
| Permanent resident | Permanent resident with non-permanent resident permit | Total | |
|---|---|---|---|
| number | |||
| Total filers | 4,812,700 | 1,601,900 | 6,414,600 |
| Total non-filers | 1,221,900 | 92,800 | 1,314,700 |
| Total | 6,034,600 | 1,694,700 | 7,729,300 |
| percent | |||
| Percent taxfilers | 79.8 | 94.5 | 83.0 |
| Source: Statistics Canada, 2016 Longitudinal Immigration Database. | |||
Data on immigrants with non-permanent resident permits are available. The proportion of immigrants with pre-landing experience varies by landing year (Chart 6); it ranges from 4% in 1980 to 35% in 1992. As mentioned in Section 2.1.2, non-permanent permits issued prior to 1980 are not available in the IMDB. As a result, the proportion of immigrants with pre-landing experience in the early 1980s is underrepresented. The proportion of immigrant filers with pre-landing experience (solid line) is higher than the overall proportion of immigrants with pre-landing experience (dotted line) because the linkage rate for these immigrants is higher than that for immigrants without pre-landing experience.

Data table for Chart 6
| Landing Year | All immigrants | Taxfilers | Non-taxfilers |
|---|---|---|---|
| percent | |||
| 1980 | 3.8 | 4.3 | 2.5 |
| 1981 | 11.3 | 12.8 | 6.5 |
| 1982 | 14.2 | 15.8 | 7.9 |
| 1983 | 17.3 | 19.4 | 8.8 |
| 1984 | 19.8 | 22.2 | 9.7 |
| 1985 | 19.5 | 22.1 | 8.5 |
| 1986 | 24.8 | 27.0 | 11.6 |
| 1987 | 23.4 | 25.4 | 10.4 |
| 1988 | 11.5 | 12.0 | 7.4 |
| 1989 | 13.6 | 14.4 | 7.4 |
| 1990 | 16.6 | 17.7 | 7.5 |
| 1991 | 32.0 | 34.2 | 12.0 |
| 1992 | 34.7 | 37.0 | 13.8 |
| 1993 | 26.8 | 28.4 | 11.5 |
| 1994 | 18.1 | 19.5 | 7.3 |
| 1995 | 19.9 | 21.5 | 7.1 |
| 1996 | 19.6 | 21.4 | 6.4 |
| 1997 | 17.4 | 19.1 | 5.6 |
| 1998 | 19.3 | 20.8 | 6.9 |
| 1999 | 19.0 | 20.6 | 6.4 |
| 2000 | 18.2 | 19.8 | 5.8 |
| 2001 | 16.3 | 17.8 | 5.0 |
| 2002 | 15.1 | 16.8 | 4.4 |
| 2003 | 15.7 | 17.7 | 4.0 |
| 2004 | 19.1 | 21.7 | 4.9 |
| 2005 | 20.0 | 23.0 | 5.4 |
| 2006 | 22.7 | 26.1 | 5.9 |
| 2007 | 23.3 | 27.1 | 6.0 |
| 2008 | 23.2 | 27.5 | 5.2 |
| 2009 | 24.2 | 28.7 | 5.6 |
| 2010 | 23.0 | 27.9 | 5.7 |
| 2011 | 23.6 | 28.6 | 6.8 |
| 2012 | 25.4 | 30.9 | 6.9 |
| 2013 | 26.9 | 32.8 | 7.6 |
| 2014 | 34.1 | 42.1 | 8.9 |
| 2015 | 33.2 | 42.4 | 8.6 |
| 2016 | 30.0 | 42.2 | 7.8 |
| Source: Statistics Canada, 2016 Longitudinal Immigration Database. | |||
7.4.2 T1 Family File (T1FF) size and coverage by year
Tax files for 1982 and subsequent years are available for linked permanent residents. Some permanent residents were non-permanent residents prior to landing. Table 7 gives details on the distribution of linked permanent residents with and without non-permanent permits prior to landing, by tax year. At least one tax file is available for the 79.8% of permanent residents without a non-permanent permit prior to landing and for the 94.5% of permanent residents who were non-permanent residents prior to landing. The fact that permanent residents with pre-landing temporary permits have a higher rate of filing taxes than permanent residents without pre-landing permits can be explained by a requirement in the permanent resident application process with respect to non-permanent residents. Non-permanent residents who apply for permanent residency are required to fulfil their obligation to file tax in Canada. The number of taxfilers on the IMDB_T1FF increases as the years pass since the size of the in-scope population increases.
| Permanent resident | Permanent resident with non-permanent resident permit | Number of taxfilers | |
|---|---|---|---|
| number | |||
| 1982 | 175,900 | 53,900 | 229,800 |
| 1983 | 209,700 | 63,600 | 273,400 |
| 1984 | 246,000 | 77,700 | 323,700 |
| 1985 | 277,900 | 92,700 | 370,500 |
| 1986 | 332,200 | 122,100 | 454,300 |
| 1987 | 388,600 | 155,300 | 543,900 |
| 1988 | 477,800 | 196,900 | 674,700 |
| 1989 | 588,600 | 260,500 | 849,100 |
| 1990 | 708,500 | 308,200 | 1,016,700 |
| 1991 | 805,800 | 357,100 | 1,162,900 |
| 1992 | 911,100 | 401,200 | 1,312,300 |
| 1993 | 1,051,700 | 440,300 | 1,492,000 |
| 1994 | 1,172,000 | 465,900 | 1,637,900 |
| 1995 | 1,283,100 | 491,300 | 1,774,400 |
| 1996 | 1,389,800 | 512,300 | 1,902,100 |
| 1997 | 1,503,200 | 532,900 | 2,036,100 |
| 1998 | 1,602,200 | 553,100 | 2,155,300 |
| 1999 | 1,725,500 | 588,900 | 2,314,400 |
| 2000 | 1,868,300 | 629,300 | 2,497,600 |
| 2001 | 2,024,900 | 678,300 | 2,703,300 |
| 2002 | 2,155,000 | 715,900 | 2,870,900 |
| 2003 | 2,277,300 | 753,000 | 3,030,200 |
| 2004 | 2,408,500 | 794,800 | 3,203,200 |
| 2005 | 2,524,900 | 828,400 | 3,353,300 |
| 2006 | 2,674,500 | 885,200 | 3,559,700 |
| 2007 | 2,798,100 | 953,200 | 3,751,300 |
| 2008 | 2,923,400 | 1,029,500 | 3,953,000 |
| 2009 | 3,039,100 | 1,093,900 | 4,133,000 |
| 2010 | 3,165,200 | 1,147,500 | 4,312,600 |
| 2011 | 3,295,600 | 1,207,400 | 4,503,000 |
| 2012 | 3,413,700 | 1,265,300 | 4,678,900 |
| 2013 | 3,546,200 | 1,322,000 | 4,868,300 |
| 2014 | 3,664,900 | 1,367,000 | 5,031,900 |
| 2015 | 3,791,100 | 1,387,500 | 5,178,600 |
| 2016 | 3,906,100 | 1,397,100 | 5,303,200 |
| Total taxfilers | 4,812,700 | 1,601,900 | 6,414,600 |
| Total non-taxfilers | 1,221,900 | 92,800 | 1,314,700 |
| percent | |||
| Percent taxfilers | 79.8 | 94.5 | 83.0 |
| Source: Statistics Canada, 2016 Longitudinal Immigration Database. | |||
Chart 7 shows that the proportion of permanent residents who were non-permanent residents prior to landing varies by tax year from a low of 23.3% for the 1983 tax year to a high of 30.7% for the 1991 tax year. Since the 2000s, this proportion has been stable at about 26%.
Data table for Chart 7
| Tax year | Percent |
|---|---|
| 1982 | 23.5 |
| 1983 | 23.3 |
| 1984 | 24.0 |
| 1985 | 25.0 |
| 1986 | 26.9 |
| 1987 | 28.6 |
| 1988 | 29.2 |
| 1989 | 30.7 |
| 1990 | 30.3 |
| 1991 | 30.7 |
| 1992 | 30.6 |
| 1993 | 29.5 |
| 1994 | 28.4 |
| 1995 | 27.7 |
| 1996 | 26.9 |
| 1997 | 26.2 |
| 1998 | 25.7 |
| 1999 | 25.4 |
| 2000 | 25.2 |
| 2001 | 25.1 |
| 2002 | 24.9 |
| 2003 | 24.8 |
| 2004 | 24.8 |
| 2005 | 24.7 |
| 2006 | 24.9 |
| 2007 | 25.4 |
| 2008 | 26.0 |
| 2009 | 26.5 |
| 2010 | 26.6 |
| 2011 | 26.8 |
| 2012 | 27.0 |
| 2013 | 27.2 |
| 2014 | 27.2 |
| 2015 | 26.8 |
| 2016 | 26.3 |
| Source: Statistics Canada, 2016 Longitudinal Immigration Database. | |
An immigrant who filed taxes for a given year will not necessarily file taxes the next year. For example, if Person A landed in 1983, this individual might be found on tax files from 1984 to 1999, but not be found on the 2000 file, and again be found on the 2001 to 2013 files. For example, 34% of filers from the 1980 cohort had tax files available for all years. Out-migration, death and late filing are some of the reasons immigrant filers might stop filing permanently or for some years.
Most immigrants file taxes for the first time in the year they land or one year before or after. For example, of the 251,100 immigrants who landed in 2006, 102,030 (40.6%) filed taxes for the first time in 2006, while 16,160 (6.4%) did so in 2007 and 3,155 (1.3%) did so in 2015.
7.5 Quality assessment of the Integrated Permanent and Non-permanent Resident File (PNRF)
A validation of the content of the 2016 PNRF was done. While landing and tax data are collected mandatorily from those in scope, some fields may not have been completed. They could be left empty because the response was unknown, or for other reasons, unbeknownst to database users (e.g., refusal) (McLeish 2011). Item non-response can present issues when one is considering the IMDB for statistical purposes, including the following:
- If the database user is interested in producing a sample based on characteristics for which there are missing records, there will be coverage error (i.e., those being included in the sampling frame may not be representative of the target population).
- If the non-response is non-ignorable (i.e., the fact that information is missing is not a random occurrence; the fact that there is no response is indicative of what the response would have been), any analysis using those variables would be biased.
The presence of missing variables and invalid values was assessed. The numbers presented in this section are rounded. Invalid values are either inconsistent or not listed in the metadata tables available to users (see the immigration component of the data dictionary appendix). Most of the quality issues listed in Table 8 are for data collected in the 1980s and 1990s. It should be noted that some seemingly valid values may be erroneous as well.
The variable Case Identification Number (CASE_ID) has item response rates generally in the high 90% range (usually over 99%). However, for some landing years, the response rate drops significantly (to as low as 80% in 1991 and 1992). Therefore, any analysis using this variable for all landing years will under-represent those years where the item non-response is higher (e.g., 1986, 1987, 1990, 1991, 1992, 1993). No detection of invalid values was performed for the variable Case Identification Number (CASE_ID).
The variable Landing_age was defined as invalid when it was greater than 99, although it is possible in some instances that these values are accurate. It should be noted that, according to the values for this variable, the number of immigrants who landed after age 99 was much higher between 1986 and 1994 than the other landing years. This could be the result of a data capture issue.
In the 2016 PNRF, 10 records had a birth year prior to 1880, and 5 records had a landing year that preceded the birth year. The gender is missing for 700 immigrants, mainly for individuals who landed in the 1980s.
The variables related to country have quality issues as well. The country of birth is missing for some records in almost all landing years. For example, values are missing for over 100 records in each of the years from 1985 to 1993. The country of citizenship is missing for fewer than 10 records per landing year for most years (with the exception of 2004, 2005 and 2006, where over 40 records were missing per landing year). The country of residence is missing for many landing records from 2013 (this value is missing for 980 records, or 0.5% of landings taking place that year), 2014 (this value is missing for 4,000 records, or 2% of landings taking place that year) and 2015 (missing for 5,000 records, or 3% of landings in that year).
The education variables after imputation (see Section 6.3) have over 150 missing values per landing year from 1980 to 1984; this translates as a rate of missing values per landing year of less than 0.5%.
The percentage of valid responses for the occupation variables is above 99% for all landing years.
The variables Family_Status, Mother_Tongue, Official_Language, CSQ_IND and Destination_Province have most of their missing values for records with a landing year prior to 1999. Mother_Tongue is missing for 460 records from the 2011 landings.
The year and month of death was missing for some individuals identified as deceased (Death_Indicator=1). The value "9999" was assigned to Death_Year and the value "99" was assigned to Death_Month in cases where the year and month of death were unknown.
The variables Destination_CD, Destination_CMA, and Destination_CSD have fewer missing values in the 2016 IMDB than in previous years since the Standard Geographical Classification (SGC) updated the geographical region and code in 2016.
| PNRF variables | Valid responses | Blanks | Invalid responses | |||
|---|---|---|---|---|---|---|
| number | percent | number | percent | number | percent | |
| Case_ID | 6,241,300 | 97.30 | 173,300 | 2.70 | 0 | 0.00 |
| Landing_age | 6,414,100 | 99.99 | 0 | 0.00 | 500 | 0.01 |
| Birth_Year | 6,414,600 | 100.00 | 0 | 0.00 | 0 | 0.00 |
| Gender | 6,413,900 | 99.99 | 700 | 0.01 | 0 | 0.00 |
| Country_Birth | 6,412,000 | 99.96 | 2,600 | 0.04 | 0 | 0.00 |
| Country_Citizenship | 6,414,000 | 99.99 | 600 | 0.01 | 0 | 0.00 |
| Country_Residence | 6,403,200 | 99.82 | 11,400 | 0.18 | 0 | 0.00 |
| Education_Qualification | 6,402,600 | 99.81 | 12,000 | 0.19 | 0 | 0.00 |
| Level_of_Education | 6,406,000 | 99.87 | 8,600 | 0.13 | 0 | 0.00 |
| Years_of_Schooling | 6,405,300 | 99.86 | 9,300 | 0.14 | 0 | 0.00 |
| Landing_age_6_groups | 6,414,100 | 99.99 | 500 | 0.01 | 0 | 0.00 |
| Landing_age_9_groups | 6,414,100 | 99.99 | 500 | 0.01 | 0 | 0.00 |
| Occupation_CD | 6,411,500 | 99.95 | 3,100 | 0.05 | 0 | 0.00 |
| NOC5-NOC2 | 6,409,600 | 99.92 | 5,000 | 0.08 | 0 | 0.00 |
| Family_Status | 6,412,300 | 99.96 | 2,300 | 0.04 | 0 | 0.00 |
| Family_Status_rollup | 6,412,300 | 99.96 | 2,300 | 0.04 | 0 | 0.00 |
| Marital_status | 6,412,900 | 99.97 | 1,700 | 0.03 | 0 | 0.00 |
| Marital_status_rollup | 6,412,900 | 99.97 | 1,700 | 0.03 | 0 | 0.00 |
| Mother_Tongue | 6,412,200 | 99.96 | 2,400 | 0.04 | 0 | 0.00 |
| Official_Language | 6,404,300 | 99.84 | 10,300 | 0.16 | 0 | 0.00 |
| Skill_level_CD11 | 5,293,500 | 82.52 | 1,121,100 | 17.20 | 0 | 0.00 |
| Special_Program | 1,186,700 | 18.50 | 5,227,900 | 81.50 | 0 | 0.00 |
| CSQ_ind | 6,414,600 | 100.00 | 25 | 0.00 | 0 | 0.00 |
| Destination_CD | 6,414,400 | 100.00 | 200 | 0.00 | 0 | 0.00 |
| Destination_CMA | 6,414,400 | 100.00 | 200 | 0.00 | 0 | 0.00 |
| Destination_CSD | 6,414,400 | 100.00 | 200 | 0.00 | 0 | 0.00 |
| Destination_Province | 641,440 | 100.00 | 200 | 0.00 | 0 | 0.00 |
| Permits and NPR-specific variables | 1,695,100 | 100.00 | 0 | 0.00 | 0 | 0.00 |
| Death_Year and Death_Month | 214,200 | 95.26 | 300 | 0.01 | 0 | 0.00 |
|
Notes: PNRF: Integrated Permanent and Non-permanent Resident File. NPR: non-permanent resident. The number of blank responses for Skill_level _CD11 combines retired and missing NOCs. Only variables with missing or invalid values were included in the table. All numbers are rounded. Source: Statistics Canada, 2016 Longitudinal Immigration Database. |
||||||
7.6 Quality Assessment of the Province of Residence Variable (PRCO_)
A validation of the geography variables included in the IMDB tax files was done. This section discusses how the variable Province of Residence (PRCO_) was derived and its quality.
The Province of residence (PRCO_) is based on information from tax filers when available. Missing information from the province of residence is replaced by information collected on the postal code of the mailing address either from the individual (PSCO_I), if available, otherwise from the family (PSCO_F).
| PRCO | Province and Territories | First character of the postal code (PSCO) |
|---|---|---|
| 0 | Newfoundland and Labrador | A |
| 2 | Prince Edward Island | B |
| 1 | Nova Scotia | C |
| 3 | New Brunswick | E |
| 4 | Quebec | G, H, J |
| 5 | Ontario | K, L, M, N ,P |
| 6 | Manitoba | R |
| 7 | Saskatchewan | S |
| 8 | Alberta | T |
| 9 | British Columbia | V |
| 10 | Northwest Territories | X |
| 11 | Yukon Territories | Y |
| 12 | Non-residents | missing |
While the Province of residence (PRCO_) is more reliable than the Taxing province (TXPCO_), some abnormalities were observed mostly on the non-resident code in the reporting for taxation years 1989, 1993, 1998, and 2004 to 2006. These may impact specific provinces.
For tax years 2004 to 2006, we observe an overestimate for province of residence Newfoundland and Labrador (PRCO_=0) caused by the inclusion of some non-residents. To reduce the effect of the observed inconsistencies, users are advised to replace PRCO_ value 0 with the value 12 (non-residents) for cases where the variable PSCO_I is equal to “U” (United States) or “F” (Foreign). While the concepts behind PSCO_ and PRCO_ are similar, the PSCO_ is based on the place of residence at the time of filing and not on December 31st. For example, the replacement of values will result in a reduction of 455 records on Newfoundland and Labrador (PRCO_=0) in tax year 2006 for immigrants admitted in 2000.
Also, the 1993 IMDB_T1FF includes anomalies for the province of Manitoba with an unusual number of residents (48,130 in 1993, compared to 33,650 the tax year before, and 37,365 the tax year after). Similar changes are observed for the Northwest Territories. Additionally, 740 individuals are coded as residing in Nunavut while Nunavut was created in 1998. 725 individuals are coded as residing in multiple jurisdictions. Users can use the information from the variable PSCO_F to diminish the effect of the anomalies on their analyses that include province of residence. However, as stated above, the time are different between PSCO_ (based residence at time of filling) and PRCO_(residence on December 31st).
Non-resident (PRCO_=12) records appear to be overestimated in the 1989 IMDB_T1FF. It includes 79,210 non-residents of Canada, with many of them having a non-permanent residency status. Users can decide to use the postal code of the mailing address (PSCO_ at the individual or family level) to derive the value of PRCO_ or remove the non-residents from their analysis.
In the 1998 IMDB_T1FF, a higher than expected number of records are assigned to Newfoundland and Labrador (PRCO_). In these cases the place of residence of the family at the time of filing is also Newfoundland based on variable PSCO_F.
8 Comparability
8.1 Historical coverage changes
Over the years, the coverage and content of the IMDB has evolved. The original IMDB_T1FF files included only data on immigrants who landed in Canada in 1980 or thereafter. Since the 2013 IMDB release, for the 1982 tax year and subsequent tax years, non-permanent resident filers were added to the IMDB_T1FF files. As a result of this change, it is now possible to have temporary resident permit information for immigrants with pre-landing experience in Canada.
In 2012, the IMDB underwent a redesign. Coverage of the IMDB was modified to include in the database immigrants who obtained landed immigrant status in 1980 or thereafter and have filed at least one tax return since 1982, regardless of whether or not they filed taxes after landing. The IMDB initially included only individuals who obtained landed immigrant status in 1980 or subsequent years and had filed at least one tax return after becoming landed immigrants. Prior to this cycle, the IMDB included up to the first 16 years of tax files belonging to a given permanent resident (Dryburgh 2004). This cap on the number of tax files for a given individual no longer applies.
The tax data included in the IMDB initially came mainly from T1 forms, and only a select number of key tax variables at the person level were retained. For the 2006 IMDB and subsequent iterations of the IMDB, files in the T1FF for 1982 and subsequent years were used and resulted in an initial linkage rate of 80%. From this point in time, the IMDB excluded the 1980 and 1981 tax files since information for these years is not available in the T1FF.
The Field Operations Support System (FOSS) was initially used to gather the immigration data included in the IMDB. For the 2013 immigration year and subsequent immigration years, the Global Case Management System (GCMS) will be used. As a result some variables have ceased to be provided by IRCC. These legacy variables will be available on the file PNRF_extra; they are listed in the immigration component of the IMDB data dictionary.
8.2 Methodological changes
The methodology used to perform the record linkage has been modified over the years.
The initial IMDB linkage rate was 55% for the 1995 IMDB (Langlois and Dougherty 1997), but the tools and methods used to perform the record linkages have evolved. This explains the improvement in linkage rates through the years.
In the late 2000s, the linkage rate was approximately 81%. For the 2012 IMDB, information on dependents was used to perform the record linkage; this allowed for linking a greater proportion of immigrant children. This information was available from the Canadian Child Tax Benefit (CCTB) file. It is to be noted that the addition of children does not improve the taxfiler rate. As a result of the methodological changes, the linkage rate of the 2014 IMDB was 89%.
For the 2015 IMDB, including in the linkage process the Social Insurance Register (SIR) – a database specifically for SIN data – increased the linkage rate to 97%. The Social Insurance Register provides very high-quality data, and about 730,000 Social Insurance Numbers are found exclusively on this register (Diaz-Papkovich 2017).
For the 2016 IMDB, a new record linkage process was used in order to facilitate the linkage of the IMDB to other data sources. Immigration data were linked to tax data via the SDLE (see section 4). From this point the linkage will be to Statistics Canada's Derived Record Depository.
8.3 Historical database content changes
Please refer to IMDB dictionaries (immigration and tax components) for a complete description of file content. Some key recent IMDB content modifications are listed below.
In 2012, the 2009 IMDB underwent a redesign; a flag was added to identify outliers on the T1FF files being created. The spouse identification number (SP_IDI) variable was introduced in the 2010 IMDB, allowing for the identification of immigrants with immigrant spouses. The year and month of death were added to the 2013 IMDB; this allowed for the identification of immigrants admitted to Canada in 1980 or thereafter who were deceased. Following the addition of non-permanent resident data to the IMDB, some temporary resident permit details (type, effective dates, etc.) have been available since the 2013 IMDB.
For the 2016 IMDB, a flag was added to identify Express Entry immigration category, along with Syrian refugee resettlement waves and the year and month of citizenship.
8.4 Comparability with other immigration data sources
The IMDB is one of many statistical programs that can serve to produce estimates pertaining to the immigrant population. In some instances, these estimates will differ as a result of a number of factors, such as coverage and limitations due to the type of data (administrative data versus survey data versus census data). Some of these statistical programs and differences with the IMDB are described in this section. The 2013 IMDB is used in performing the comparisons.
8.4.1 Longitudinal Administrative Databank (LAD)
The Longitudinal Administrative DatabankNote 12 (LAD) consists of a 20% longitudinal sample of Canadian taxfilers. It is linked to the IMDB to include a sample of 20% of the IMDB record and to add immigrant-specific variables, such as landing year, immigration category, and marital status at landing. It contains information about individuals and census families. It is useful for longitudinal analysis, which compares immigrant income and mobility with those of Canadian taxfilers. Any analysis comparing immigrant taxfilers to the Canadian taxfiler population should employ this dataset.
It is to be noted that the LAD contains fewer immigration variables than the IMDB. For example, pre-landing information, such as the number of work permits and study permits, is not available in the LAD. Landing information, including the intended occupation and the destination province, is also not available in the LAD.
Table 10 contains the mean and median total income (XTIRC) from the 2012 tax year of immigrants who landed during the period from 1982 to 2013, by gender, illustrating how comparable the estimates produced from these databases are. The mean and median total income by gender, as expected, are similar for both data sources. The differences can be explained by the fact the LAD is a 20% sample of the Canadian population and the fact that the IMDB is a census of linked immigrant taxfilers admitted to Canada since 1980. The population counts are different, but neither sources should be used for population counts, the LAD being a sample and the IMDB being limited to immigrant taxfilers. The population of the LAD is estimated by multiplying the records by a weight of 5.
| Population | Male | Population | Female | Population | Total | ||||
|---|---|---|---|---|---|---|---|---|---|
| Mean | Median | Mean | Median | Mean | Median | ||||
| number | dollars | number | dollars | number | dollars | ||||
| Individual | |||||||||
| IMDB | 2,776,700 | 41,900 | 29,400 | 2,906,000 | 28,700 | 20,600 | 5,682,690 | 35,000 | 24,200 |
| LAD | 2,686,300 | 41,700 | 29,200 | 2,803,100 | 28,700 | 20,500 | 5,489,390 | 34,900 | 24,100 |
| Family | |||||||||
| IMDB | Note ...: not applicable | 73,700 | 56,300 | Note ...: not applicable | 69,900 | 51,400 | Note ...: not applicable | 71,700 | 53,700 |
| LAD | Note ...: not applicable | 73,800 | 56,500 | Note ...: not applicable | 69,700 | 51,500 | Note ...: not applicable | 71,700 | 53,900 |
|
... not applicable Note: IMDB: Longitudinal Immigration Database; LAD: Longitudinal Administrative Databank. Source: Statistics Canada, 2013 Longitudinal Immigration Database and 2013 Longitudinal Administrative Databank. |
|||||||||
In Table 11, the comparability was restricted to the 2012 total income of immigrants who landed in 2011. The estimated differences observed between the IMDB and the LAD for this group are greater than those observed for the immigrant population that landed in any year from 1980 to 2013. This could be explained by the fact that the population of interest is smaller and more specific. The LAD estimates are derived from the records included in the 20% sample of immigrants who landed in 2011. These records do not always correspond to the 20% of the specific population in the IMDB. They are likely to constitute a smaller proportion of the specific population in the IMDB, as the sample was not drawn to be representative of this specific population. The IMDB estimates are derived from the linked immigrant population who landed in 2011 and filed taxes in 2012. Thus, the estimates from LAD may take on slightly different values than the IMDB when subsets of populations are examined.
| Male | Female | Total | ||||
|---|---|---|---|---|---|---|
| Mean | Median | Mean | Median | Mean | Median | |
| dollars | ||||||
| Individual | ||||||
| IMDB | 30,100 | 22,400 | 18,900 | 14,100 | 24,300 | 17,800 |
| LAD | 29,500 | 22,100 | 18,700 | 13,900 | 23,900 | 17,500 |
| Family | ||||||
| IMDB | 49,900 | 39,300 | 48,200 | 37,100 | 49,000 | 38,200 |
| LAD | 49,300 | 39,000 | 48,000 | 36,600 | 48,600 | 37,800 |
|
Note: IMDB: Longitudinal Immigration Database; LAD: Longitudinal Administrative Databank. Source: Statistics Canada, 2013 Longitudinal Immigration Database and 2012 Longitudinal Administrative Databank. |
||||||
8.4.2 Census
The census long form and the 2011 National Household Survey (NHS) collect data on immigrants. These data are collected for a proportion of the population (refer to Census Program description for exact proportion, as this value has differed throughout time). The place of birth, place of birth of parents, immigration status, year of immigration, age at immigration, and citizenship are collected. Since the 2016 Census immigration category is also available. The Census collects data on first-, second-, and older-generation Canadians, whereas the IMDB collects only data on newcomers and their families. The Census also contains data on visible minorities, education, housing and language for the census year although, unless the landing year is a Census year, it holds no record of this information at landing. The Census does not allow longitudinal study of the economic outcomes or long-term mobility of immigrants. More details on the Census Program are available on the Statistics Canada website.
The 2011 National Household Survey (NHS) estimated that over 4.6 million immigrants living in Canada in 2011 had landed during the period from 1981 to 2011. Table 12 compares the estimates of immigrant populations by landing decades from NHS and the PNRF. The 2013 PNRF should not be used to estimate population counts, even after identified death records are removed. Doing so would result in an overestimation of the immigrant population living in Canada who were admitted during the period from 1981 to 2011 because the PNRF does not take into account emigration. Also, the PNRF is a subset of the immigrant population, as only taxfilers are included in this file. This may account for lower population counts in the PNRF than in the NHS for the most recent cohort of immigrants (2001 to 2011). Deaths shown in Table 12 are based on the Death_indicator (described in Section 7.2.2).
| Landing decade | NHS estimates | 2013 PNRF estimates |
|---|---|---|
| number | ||
| 1981 to 1990 | 949,890 | 1,052,650 |
| 1991 to 2000 | 1,539,055 | 1,896,235 |
| 2001 to 2011 | 2,154,985 | 2,120,290 |
| Total | 4,643,930 | 5,069,175 |
|
Note: IMDB: Longitudinal Immigration Database; NHS: National Household Survey, PNRF: Integrated Permanent and Non-permanent Resident File. Source: Statistics Canada, 2013 Longitudinal Immigration Database and National Household Survey, 2011. |
||
8.4.3 Longitudinal Survey of Immigrants to Canada (LSIC)
The Longitudinal Survey of Immigrants to Canada (LSIC) was designed to provide information on how new immigrants adjust to life in Canada and to understand the factors that can help or hinder this adjustment. The LSIC was designed to examine the first four years of settlement. Data on immigrants aged 15 years and older who landed in Canada from abroad at any time from October 1, 2000, to September 30, 2001, were collected for three waves. The LSIC allows studies on language proficiency, housing, education, foreign credential recognition, employment, health, values and attitudes, the development and use of social networks, income, and perceptions of settlement in Canada. The IMDB contains characteristics such as education and language only at landing, whereas the LSIC allows for the evaluation of changes through time. Additional information on the LSIC is available on the Statistics Canada website.
The LSIC estimated that 164,200 immigrants aged 15 years and older landed in Canada from abroad at any time from October 1, 2000, to September 30, 2001. The estimate for the same population is 156,670 for the 2013 IMDB when calculated according to the PNRF (Table 13). Some of this difference is due to the combination of the exclusion of non-filers from the PNRF estimate and emigration not being captured in the IMDB. Part of the difference is explained by the fact that the LSIC is a survey that introduces variance estimates. As shown in Table 14, the coverage proportions by age group vary across age groups despite the LSIC population being of tax filing age. It is to be noted that the LSIC age is the age approximately six months after landing while the IMDB is the age at landing. Also, the calculation of the LSIC estimates used wave 1 weights, which were designed to estimate the number of immigrants in this cohort still living in Canada six months after landing. The lower proportion of immigrants aged 65 years and older could be due to a lower proportion of filers for this age group. The higher number of immigrants aged 15 to 24 in the IMDB than in the LSIC likely results from emigration not being accounted for.
| 2013 LSIC | 2013 PNRF | |||
|---|---|---|---|---|
| number | percent | number | percent | |
| Male | 81,550 | 49.7 | 77,640 | 49.6 |
| Female | 82,650 | 50.3 | 78,830 | 50.4 |
| Total | 164,200 | 100.0 | 156,470 | 100.0 |
|
Note: IMDB: Longitudinal Immigration Database; NHS: National Household Survey, PNRF: Integrated Permanent and Non-permanent Resident File. Source: Statistics Canada, 2013 Longitudinal Immigration Database; and Longitudinal Survey of Immigrants to Canada, Wave 1, 2003. |
||||
| Age groups | LSIC | 2013 PNRF | ||
|---|---|---|---|---|
| number | percent | number | percent | |
| 15 to 24 | 26,730 | 16.3 | 27,990 | 17.9 |
| 25 to 34 | 65,500 | 39.9 | 63,050 | 40.3 |
| 35 to 49 | 53,970 | 32.9 | 49,030 | 31.3 |
| 50 to 64 | 12,890 | 7.8 | 12,280 | 7.8 |
| 65 and over | 5,100 | 3.1 | 4,120 | 2.6 |
| Total | 164,200 | 100.0 | 156,470 | 100.0 |
|
Note: IMDB: Longitudinal Immigration Database; NHS: National Household Survey, PNRF: Integrated Permanent and Non-permanent Resident File. Source: Statistics Canada, 2013 Longitudinal Immigration Database; and Longitudinal Survey of Immigrants to Canada, Wave 1, 2003. |
||||
9 New analyses possible with the IMDB
The IMDB was created to allow analysis on immigration-related topics, and this section gives an overview of possible analyses with the additional information now available in the IMDB. As described in this report, the content of the IMDB has evolved; this has increased its analytical capabilities. Below are some examples of analyses that could benefit from the IMDB.
9.1 Analytical possibilities with non-permanent resident data
The addition of non-permanent resident data expands the scope of analysis currently possible with the IMDB. The number and type of permits obtained prior to landing can be used to establish the pre-landing profile of immigrants with pre-landing experience. Also, the non-permanent resident data can be used to identify permanent residents with and without the pre-landing experience in Canada. By comparing these populations (with and without pre-landing Canadian experience), it becomes possible to assess the impacts of pre-landing Canadian experience on the economic outcomes and mobility patterns of immigrants. The specific sociodemographic profile at time of temporary resident permit issuance is now available, and makes it possible to evaluate economic outcome and mobility prior to landing. Changes in intended occupation, skill level and level of study through temporary resident permits are also available.
9.2 Analytical possibilities with data on deaths
The addition of the death flag, death year, and death month variables to the PNRF makes it possible to estimate the proportion of records included in the IMDB that belong to deceased immigrants. These variables will complement the year of death (YOD) variable included in the tax files. YOD is available only in instances where a T1 form was filed posthumously on behalf of the deceased, whereas the year and month of death are available for any record linked to the mortality dataset regardless of tax filing profile. New possible analyses may include the evaluation of economic profiles of immigrants prior to their death and the study of life expectancies after landing by immigration category and economic profile.
9.3 Analytical possibilities with citizenship
Adding citizenship information to the IMDB offers more analytical possibilities. The addition of the year and month of Canadian citizenship provides details on whether and when immigrants obtained their citizenship. It also serves as an additional explanatory variable to study socioeconomic outcomes. For example, the uptake rate gives an idea of the proportion of immigrants that obtain citizenship, and the characteristics that are associated with seeking citizenship. Additionally, we can look at the number of years after landing that a person obtains their citizenship, and age at citizenship. Please note that citizenship data are available since 2005.
10 Summary
The IMDB is a dataset combining immigration and tax records created for the purpose of performing socio-economic and mobility analysis on immigrants (with or without pre-landing experience) who landed in Canada in 1980 or thereafter. The IMDB allows for analysis pertaining to taxfilers. This is important given that taxfilers can have a different profile than non-filers. This technical report was produced to give a thorough description of IMDB data quality and recent changes to this database.
How to access the IMDB:
As described in Section 6, several products are available to researchers. They can be accessed via the Statistics Canada website by selecting "Immigration and ethnocultural diversity" under "Subjects" and typing "Longitudinal Immigration Database (IMDB)" under "Keywords".
It is to be noted that yearly updates of the IMDB are independent from one another. From year to year, there have been changes to data processing, including updates to the unique person identifier (IMDB_ID).
Appendix
A) Links to key IMDB documents and web pages
Dictionaries (tax and immigration component): Available to data users or upon request by contacting Statistics Canada by email at STATCAN.infostats-infostats.STATCAN@canada.ca.
Historical IMDB: http://www23.statcan.gc.ca/imdb/p2SV.pl?Function=getInstanceList&Id=7196
IMDB releases in The Daily: https://www120.statcan.gc.ca/stcsr/en/ms1/mss?q=longitudinal+immigration+database&fq=ds%3Adailye
Analysis using the IMDB: https://www150.statcan.gc.ca/n1/en/type/analysis?text=longitudinal+immigration+database
https://www.canada.ca/en/sr/srb.html?q=longitudinal%20immigration%20database&idx=20
Bonikowska, A. and Hou, F. 2015. Which Human Capital Characteristics Best Predict the Earnings of Economic Immigrants? Statistics Canada Catalogue no. 11F0019M – No. 368. Available at https://www150.statcan.gc.ca/n1/pub/11f0019m/11f0019m2015370-eng.htm
Hou, F., and Bonikowska, A. 2015. The Earnings Advantage of Landed Immigrants Who Were Previously Temporary Residents in Canada. Statistics Canada Catalogue no. 11F0019M – No. 370. Available at https://www150.statcan.gc.ca/n1/pub/11f0019m/11f0019m2015370-eng.htm
Huystee, M. 2016. Interprovincial mobility: Retention rates and net inflow rates 2008-2013 landings. Available at https://www.canada.ca/en/immigration-refugees-citizenship/corporate/reports-statistics/research/interprovincial-mobility-retention-inflow-landings-2008-2013.html
Picot, G, and Lu, Y. 2017. Chronic Low Income Among Immigrants in Canada and its Communities. Statistics Canada. Available at http://www150.statcan.gc.ca/n1/pub/11f0019m/11f0019m2017397-eng.htm
The Consumer Price Index (62-001-X): https://www150.statcan.gc.ca/n1/en/catalogue/62-001-X
Description of the annual Income Estimates for Census Families and Individuals (T1 Family File): http://www23.statcan.gc.ca/imdb/p2SV.pl?Function=getSurvey&SDDS=4105&lang=fr&db=imdb&adm=8&dis=2.
B) Coverage
The 2016 IMDB was used to produce these counts. Filers are linked immigrants who have filed a tax return at least once since 1982. Statistics below exclude 2017 admissions.
| Landing year | TaxfilersTable 14 Note 1 | Non-taxfilers | Total | |||||||||
|---|---|---|---|---|---|---|---|---|---|---|---|---|
| Immigrants | PR | PR/NPR | Deaths | Immigrants | PR | PR/NPR | Deaths | Immigrants | PR | PR/NPR | Taxfilers | |
| number | percent | |||||||||||
| 1980 | 106,500 | 102,000 | 4,500 | 15,300 | 36,700 | 35,800 | 900 | 1,700 | 143,200 | 137,800 | 5,400 | 74.4 |
| 1981 | 98,500 | 85,900 | 12,600 | 13,800 | 30,000 | 28,000 | 2,000 | 1,500 | 128,500 | 113,900 | 14,600 | 76.7 |
| 1982 | 96,300 | 81,100 | 15,200 | 12,400 | 24,800 | 22,800 | 2,000 | 1,300 | 121,100 | 103,900 | 17,200 | 79.5 |
| 1983 | 71,200 | 57,400 | 13,800 | 10,000 | 17,900 | 16,300 | 1,600 | 1,100 | 89,100 | 73,700 | 15,400 | 79.9 |
| 1984 | 71,300 | 55,500 | 15,800 | 9,300 | 16,700 | 15,100 | 1,600 | 1,000 | 88,000 | 70,600 | 17,400 | 81.0 |
| 1985 | 69,400 | 54,000 | 15,400 | 8,100 | 14,500 | 13,100 | 1,400 | 700 | 83,900 | 67,100 | 16,800 | 82.7 |
| 1986 | 84,000 | 61,300 | 22,700 | 8,300 | 14,800 | 13,100 | 1,700 | 600 | 98,800 | 74,400 | 24,400 | 85.0 |
| 1987 | 130,700 | 97,500 | 33,200 | 10,300 | 20,400 | 18,300 | 2,100 | 700 | 151,100 | 115,800 | 35,300 | 86.5 |
| 1988 | 142,300 | 125,200 | 17,100 | 9,900 | 18,500 | 17,100 | 1,400 | 600 | 160,800 | 142,300 | 18,500 | 88.5 |
| 1989 | 170,000 | 145,500 | 24,500 | 10,300 | 20,700 | 19,200 | 1,500 | 600 | 190,700 | 164,700 | 26,000 | 89.1 |
| 1990 | 192,300 | 158,300 | 34,000 | 10,900 | 23,200 | 21,500 | 1,700 | 600 | 215,500 | 179,800 | 35,700 | 89.2 |
| 1991 | 208,700 | 137,300 | 71,400 | 11,800 | 23,100 | 20,300 | 2,800 | 600 | 231,800 | 157,600 | 74,200 | 90.0 |
| 1992 | 228,900 | 144,300 | 84,600 | 11,800 | 25,100 | 21,600 | 3,500 | 500 | 254,000 | 165,900 | 88,100 | 90.1 |
| 1993 | 230,800 | 165,200 | 65,600 | 11,000 | 24,900 | 22,000 | 2,900 | 500 | 255,700 | 187,200 | 68,500 | 90.3 |
| 1994 | 198,600 | 159,900 | 38,700 | 8,800 | 25,000 | 23,200 | 1,800 | 400 | 223,600 | 183,100 | 40,500 | 88.8 |
| 1995 | 188,500 | 148,000 | 40,500 | 7,000 | 23,600 | 21,900 | 1,700 | 300 | 212,100 | 169,900 | 42,200 | 88.9 |
| 1996 | 198,200 | 155,800 | 42,400 | 6,100 | 27,100 | 25,400 | 1,700 | 300 | 225,300 | 181,200 | 44,100 | 88.0 |
| 1997 | 188,800 | 152,800 | 36,000 | 5,000 | 26,600 | 25,100 | 1,500 | 300 | 215,400 | 177,900 | 37,500 | 87.7 |
| 1998 | 154,900 | 122,700 | 32,200 | 3,700 | 18,800 | 17,500 | 1,300 | 200 | 173,700 | 140,200 | 33,500 | 89.2 |
| 1999 | 167,800 | 133,200 | 34,600 | 3,500 | 21,600 | 20,200 | 1,400 | 200 | 189,400 | 153,400 | 36,000 | 88.6 |
| 2000 | 200,800 | 161,000 | 39,800 | 3,600 | 25,900 | 24,400 | 1,500 | 200 | 226,700 | 185,400 | 41,300 | 88.6 |
| 2001 | 219,500 | 180,300 | 39,200 | 3,700 | 30,200 | 28,700 | 1,500 | 200 | 249,700 | 209,000 | 40,700 | 87.9 |
| 2002 | 197,500 | 164,300 | 33,200 | 3,200 | 30,700 | 29,400 | 1,300 | 200 | 228,200 | 193,700 | 34,500 | 86.5 |
| 2003 | 188,800 | 155,400 | 33,400 | 2,700 | 31,700 | 30,400 | 1,300 | 200 | 220,500 | 185,800 | 34,700 | 85.6 |
| 2004 | 199,100 | 155,800 | 43,300 | 2,200 | 36,300 | 34,500 | 1,800 | 190 | 235,400 | 190,300 | 45,100 | 84.6 |
| 2005 | 217,700 | 167,700 | 50,000 | 1,800 | 44,100 | 41,700 | 2,400 | 120 | 261,800 | 209,400 | 52,400 | 83.2 |
| 2006 | 208,400 | 154,000 | 54,400 | 1,900 | 42,700 | 40,200 | 2,500 | 150 | 251,100 | 194,200 | 56,900 | 83.0 |
| 2007 | 193,700 | 141,200 | 52,500 | 1,500 | 42,500 | 40,000 | 2,500 | 130 | 236,200 | 181,200 | 55,000 | 82.0 |
| 2008 | 198,900 | 144,200 | 54,700 | 1,300 | 47,700 | 45,200 | 2,500 | 160 | 246,600 | 189,400 | 57,200 | 80.7 |
| 2009 | 202,200 | 144,200 | 58,000 | 1,200 | 49,400 | 46,600 | 2,800 | 150 | 251,600 | 190,800 | 60,800 | 80.4 |
| 2010 | 218,000 | 157,200 | 60,800 | 1,000 | 62,100 | 58,600 | 3,500 | 130 | 280,100 | 215,800 | 64,300 | 77.8 |
| 2011 | 190,800 | 136,200 | 54,600 | 800 | 57,300 | 53,400 | 3,900 | 100 | 248,100 | 189,600 | 58,500 | 76.9 |
| 2012 | 198,500 | 137,200 | 61,300 | 700 | 58,700 | 54,600 | 4,100 | 110 | 257,200 | 191,800 | 65,400 | 77.2 |
| 2013 | 198,000 | 133,100 | 64,900 | 600 | 60,500 | 55,900 | 4,600 | 120 | 258,500 | 189,000 | 69,500 | 76.6 |
| 2014 | 197,000 | 114,000 | 83,000 | 300 | 62,500 | 56,900 | 5,600 | 70 | 259,500 | 170,900 | 88,600 | 75.9 |
| 2015 | 197,200 | 113,600 | 83,600 | 175 | 73,800 | 67,500 | 6,300 | 60 | 271,000 | 181,100 | 89,900 | 72.8 |
| 2016 | 190,800 | 110,400 | 80,400 | 80 | 104,600 | 96,400 | 8,200 | 60 | 295,400 | 206,800 | 88,600 | 64.6 |
| Total | 6,414,600 | 4,812,700 | 1,601,900 | 214,055 | 1,314,700 | 1,221,900 | 92,800 | 16,050 | 7,729,300 | 6,034,600 | 1,694,700 | 83.0 |
Source: Statistics Canada, 2016 Longitudinal Immigration Database. |
||||||||||||
| Sex and cohorts | Age at landing | ||||||
|---|---|---|---|---|---|---|---|
| 0 to 14 | 15 to 24 | 25 to 34 | 35 to 44 | 45 to 64 | 65 and older | Total | |
| percent | |||||||
| 1980 to 1989 cohorts | |||||||
| Male | 73.0 | 87.5 | 92.1 | 92.0 | 83.0 | 60.4 | 84.6 |
| Female | 71.9 | 83.1 | 89.0 | 89.9 | 78.1 | 57.0 | 81.2 |
| Total | 72.5 | 85.2 | 90.6 | 91.0 | 80.2 | 58.5 | 82.9 |
| 1990 to 1999 cohorts | |||||||
| Male | 81.0 | 92.9 | 93.1 | 92.8 | 90.0 | 76.8 | 89.6 |
| Female | 79.4 | 91.4 | 92.7 | 92.8 | 88.0 | 75.4 | 88.7 |
| Total | 80.2 | 92.1 | 92.9 | 92.8 | 88.9 | 76.0 | 89.1 |
| 2000 to 2009 cohorts | |||||||
| Male | 53.9 | 92.9 | 91.8 | 92.8 | 92.9 | 89.0 | 83.6 |
| Female | 53.0 | 92.4 | 92.7 | 93.6 | 92.6 | 87.2 | 84.7 |
| Total | 53.5 | 92.6 | 92.3 | 93.2 | 92.8 | 88.0 | 84.2 |
| 2010 to 2016 cohorts | |||||||
| Male | 8.6 | 85.6 | 93.6 | 92.1 | 89.4 | 84.0 | 73.1 |
| Female | 8.7 | 87.3 | 93.6 | 93.0 | 88.5 | 82.6 | 75.5 |
| Total | 8.7 | 86.5 | 93.6 | 92.5 | 88.9 | 83.3 | 74.4 |
| Source: Statistics Canada, 2016 Longitudinal Immigration Database. | |||||||
C) Previous analysis
Since its creation, the IMDB has been used to produce several analyses. The following is a summary of some Statistics Canada studies that have made use of the IMDB.
In recent years, several releases in The Daily have featured the IMDB. The subjects discussed include changes in the regional distribution of new immigrants to Canada, income and mobility of immigrants, immigrants in the hinterlands, and immigrants who leave Canada. These articles are accessible via the Statistics Canada website. Papers using the IMDB have been published in the Perspectives on Labour and Income publication series (75-001-X) and the Analytical Studies Branch Paper Series. Among the topics covered were the income of immigrants who pursue postsecondary education in Canada, and the earnings advantage of landed immigrants who were previously temporary residents in Canada.
D) Best practices and tips for analysts
D.1 Programming tips
This section provides programming information for individuals who want to have a better understanding of the programming structure used to access data from IMDB files. Please note that individuals may conduct their own programming. There are two types of IMDB files—the yearly IMDB data files and the immigration data (for more details on IMDB files, refer to Section 3). IMDB tax variables are identified with a variable name that consists of three parts: (1) the acronym name as described in the IMDB tax data dictionary, (2) the aggregate level (I or F), and (3) the year (the four-digit year extension exists in most, but not all, cases).
Example: The interest and investment income at the individual level for 2014 would be named INVI_I2014.
Observations in the IMDB files are sorted according to a variable, IMDB_id (note that there is no year extension for this variable), which enables users to maintain a link across years. Data access takes place by means of the SAS programming language. A sample SAS program designed to access IMDB data is provided below. The samples below are created to perform the following task:
"retrieving the number of Social Assistance (SA) recipients for immigrants who landed between 2000 and 2005, living in Ontario between 2010 and 2012, and did not have any earnings appearing on their T4 slips by sex and year (2010 to 2012)"
Researchers who are new to the IMDB are encouraged to go through this sample SAS program. There are generally three components in the sample.
- Library set-up: The library assignments on the first two lines are the locations for the input files (first line) and the output files (the second line).
- Steps to generate a working dataset:
- The input files are stored in SAS format and can therefore be accessed with a SET or MERGE statement.
- This program is aimed at retrieving the number of Social Assistance (SA) recipients for immigrants who:
- landed at any time from 2000 to 2005
- lived in Ontario from 2010 to 2012
- did not have any earnings on their T4 slips
And generate the number of SA recipients by sex and year (in this case, 2010 to 2012).
- The dataset used to produce the number of the SA recipients: The part, which starts with "proc freq," produces the numbers of interest as they are specified in the rest. At the end of the program, four tables are created from the output data file.
It is generally recommended that programs use the variables available in the PNRF rather than the yearly tax files for consistency. For example, the sample program uses the variable GENDER, a variable found in the PNRF, rather than SXCO_I&year, the variable found in the yearly IMDB_T1FF. In this program, only individuals who have filed every year from 2010 to 2012 are selected.
When programming in SAS, one should keep in mind the distinction between missing values and zeros in numeric fields. With SAS, most mathematical operations performed with missing values will return missing values. In IMDB, in years that an individual is present, numeric variables not relevant to that individual have a value of "0" (zero). For example, if a person without a spouse filed in 2010, the value for RRSPSI2010 (contributions to a spouse's RRSP) should be "0" (zero). If that individual did not file in 2010, the value will be missing.
Sample IMDB program
* Sample SAS program using the IMDB;


libname source1 '\\f8prod05\cic\1.Database'; * location of IMDB files ;


libname Out '\\f8prod05\cic\3.workarea'; * user's directory ;


* This sample program's objective is to use the IMDB to retrieve the number of Social Assistance (SA) recipients in Ontario that did not have any earnings appearing on their T4 slips, according to sex and year (in this case, 2010 to 2012). Data for provinces and earnings are from the yearly IMDB files whereas the sex variable is from the PNRF_2014. ;


* The first step is to create a datafile containing all the information that we need to produce our tables. This datafile will be called SAOnt and will be saved in the 'out' directory. The Longitudinal Identifier Number (IMDB_ID) is used to merge the annual IMDB datasets. ;


data out.SAOnt;

merge

source1.imdb_t1ff_2010(where=(prco_i2010 = 5 and outlier_ind2010 = 0) in=a keep=imdb_id prco_i2010 outlier_ind2010 saspyf2010 t4e__i2010)


source1.imdb_t1ff_2011(where=(prco_i2011 = 5 and outlier_ind2011 = 0) in=b keep= imdb_id prco_i2011 outlier_ind2011 saspyf2011 t4e__i2011)


source1.imdb_t1ff_2012(where=(prco_i2012 = 5 and outlier_ind2012 = 0) in=c keep= imdb_id prco_i2012 outlier_ind2012 saspyf2012 t4e__i2012)


source1.pnrf_2015(keep= imdb_id gender landing_year immigration_category);


by IMDB_id ;


If a and b and c and (landing_year>=2000 and landing_year<=2005);


*person must be taxfiler in all three years, not be flagged as an outlier, and must have landed between 2000 and 2005 (population of interest);


* We create a flag variable that identifies the SA recipients for each year. The result is three variables,
flag_sa2010, flag_sa2011 and flag_sa2012, taking a value of either 1 or 0.;

If (t4e__i2010=0 and saspyf2010>0) then flag_sa2010 = 1 ;

else flag_sa2010 = 0 ;

if (t4e__i2011=0 and saspyf2011>0) then flag_sa2011 = 1 ;

else flag_sa2011 = 0 ;

if (t4e__i2012=0 and saspyf2012>0) then flag_sa2012 = 1 ;

else flag_sa2012 = 0 ;

run;


* The SAS 'freq' procedure is used to produce our tables. We would also need to make sure that confidentiality guidelines standards are respected. ;


proc freq data = out.SAOnt;

tables immigration_category*flag_sa2010*flag_sa2011*flag_sa2012

gender*flag_sa2010*flag_sa2011*flag_sa2012 /missing ;

run ;

* End of the sample program;
D.2 Creating a cohort
Prior to starting an analysis, the cohort of interest needs to be defined. The cohort can be restricted by landing year, geography, or any other variable of interest (e.g., admission category or gender) according to the researcher's need. A clearly defined single cohort should be followed to allow comparability. For example, a researcher might be interested in women who landed in 2000 and who lived in a family that received social assistance in 2001 (Table 17). A study question regarding this cohort could be "What proportion of this cohort received social assistance in the following two years (2002 and 2003)?" It is worth noting that the Canada Revenue Agency (CRA) requires the spouse with the higher net income to report the social assistance payment. As a result, measurement on social assistance (SASPY_F), even for individuals, is best reported with the family-level information.
| IMDB_ID | Landing year | Gender | SASPY_F2001 | SASPY_F2002 | SASPY_F2003 |
|---|---|---|---|---|---|
| dollars | |||||
| IM583 | 2000 | Female | 20,500 | 19,000 | 14,000 |
| IM145 | 2000 | Female | 3,000 | 0 | 0 |
| IM548 | 2000 | Female | 11,500 | 13,800 | 0 |
| IM798 | 2000 | Female | 16,000 | 18,000 | 8,000 |
| IM961 | 2000 | Female | 10,000 | 0 | 0 |
| IM967 | 2000 | Female | 9,500 | 0 | 0 |
| IM110 | 2000 | Female | 5,000 | 2,000 | 1,000 |
| IM125 | 2000 | Female | 1,000 | 0 | 200 |
| Source: Statistics Canada, example from Longitudinal Immigration Database (IMDB). | |||||
D.3 Calculating retention rates
A key strength of the IMDB is the presence of geographic variables that allow for the study of mobility and retention. No other dataset contains a comparable level of detail on taxfilers annually, especially when it comes to smaller geographies. Having annual provincial, census division (CD), census metropolitan area (CMA), census agglomeration (CA), census subdivision level (CSD), and census tract level updates allows for a broad range of analyses.
Individual mobility trajectories can be studied simply by flagging changes in postal codes, and mobility trends can be calculated by studying relocations at specific levels of geography. For example, CSD-level mobility (year-to-year changes in CSD) and provincial mobility (year-to-year changes in province) significantly vary by a number of immigrant characteristics, such as age and admission category. These geographies are derived from the postal code (IMDB variable PSCO at the individual and family levels). The postal code is a six-character alphanumeric code that locates the point of delivery of mail addressed to post office customers in Canada. See Section 3.4.1 for a description of the geography variables.
In the example below (Table 18), the researcher is interested in mobility until 2002. IM798, IM961, IM967 and IM110 could be excluded from the mobility study because data (or files) are missing.
| IMDB_ID | Landing year | Destination province | PRCO 2000 | PRCO 2001 | PRCO 2002 |
|---|---|---|---|---|---|
| IM583 | 2000 | B.C. | B.C. | B.C. | B.C. |
| IM145 | 2000 | Alta. | Alta. | Sask. | Sask. |
| IM548 | 2000 | Alta. | Ont. | Ont. | Ont. |
| IM798 | 2000 | Ont. | Note ..: not available for a specific reference period | Ont. | Ont. |
| IM961 | 2000 | N.B. | N.B. | N.B. | Note ..: not available for a specific reference period |
| IM967 | 2000 | Ont. | Note ..: not available for a specific reference period | Alta. | Ont. |
| IM110 | 2000 | Note ..: not available for a specific reference period | Que. | Note ..: not available for a specific reference period | Que. |
|
.. not available for a specific reference period Note: PRCO is province of residence Source: Statistics Canada, example from Longitudinal Immigration Database (IMDB). |
|||||
While mobility, at the individual level, is fairly straightforward, retention of immigrants in a jurisdiction can be calculated in several ways. How retention is calculated is an analytical decision based on the individual researcher's particular needs. The number of individuals retained is fairly straightforward to define—it is the number of individuals filing taxes in the jurisdiction of interest at a given time. A decision has to be made about what constitutes the initial landing cohort about which retention is calculated (the denominator in the retention rate).
The retention rate can be measured as the proportion of immigrant taxfilers who reside in the province where they landed (defined as the province of intended destination) at a given time. For a given cohort (e.g., landing year) and a given tax year (or years since landing), the denominator is the number of taxfilers with the selected province of landing. The numerator is the number of taxfilers with the selected province of landing who are also residing in the province. To compute retention rates three years after landing for the 2011 cohort, a researcher would prepare a table with all provinces of landing (i.e., the province of intended destination), all provinces of residence, landing year = 2011, and reference year = 2014. The table would look as follows:
| Province of landing | Province of residence | |||||||||||
|---|---|---|---|---|---|---|---|---|---|---|---|---|
| Total province of residence | Newfoundland and labrador | Prince Edward Island | Nova Scotia | New Brunswick | Quebec | Ontario | Manitoba | Saskatchewan | Alberta | British Columbia | Other residence | |
| number of immigrants | ||||||||||||
| Total province of landing | 174,740 | 405 | 330 | 1,365 | 880 | 31,505 | 70,590 | 9,698 | 6,120 | 26,965 | 26,390 | 500 |
| Newfoundland and Labrador | 515 | 325 | 0 | 5 | 0 | 5 | 75 | 5 | 0 | 60 | 30 | 0 |
| Prince Edward Island | 1,245 | 0 | 265 | 25 | 10 | 30 | 560 | 0 | 0 | 50 | 295 | 0 |
| Nova Scotia | 1,460 | 10 | 5 | 1,080 | 10 | 25 | 185 | 0 | 5 | 90 | 30 | 10 |
| New Brunswick | 1,340 | 0 | 10 | 35 | 750 | 55 | 275 | 0 | 10 | 80 | 120 | 0 |
| Quebec | 36,275 | 10 | 10 | 35 | 15 | 30,200 | 3,255 | 40 | 75 | 1,190 | 1,400 | 45 |
| Ontario | 69,135 | 35 | 25 | 115 | 70 | 875 | 63,145 | 275 | 335 | 2,815 | 1,325 | 115 |
| Manitoba | 11,190 | 0 | 0 | 15 | 0 | 55 | 645 | 9,170 | 80 | 825 | 380 | 10 |
| Saskatchewan | 6,360 | 0 | 0 | 0 | 0 | 20 | 295 | 45 | 5,370 | 445 | 165 | 10 |
| Alberta | 21,940 | 10 | 0 | 20 | 0 | 95 | 810 | 65 | 140 | 20,170 | 590 | 35 |
| British Columbia | 25,000 | 5 | 0 | 30 | 5 | 140 | 1,330 | 85 | 100 | 1,200 | 22,030 | 70 |
| Other | 280 | 0 | 0 | 0 | 0 | 0 | 15 | 0 | 0 | 35 | 20 | 200 |
| Source: Statistics Canada, 2014 Longitudinal Immigration Database (table 43-10-0035-01) | ||||||||||||
Results for Nova Scotia shed some light on the matter. A total of 1,460 individuals landed in Nova Scotia in 2011 and filed taxes in 2014. Of those, 1,080 had Nova Scotia as their province of residence in 2014. Nova Scotia's three-year retention rate would be 1,080/1,460, or about 74%. Table 19 also provides information on secondary migrantsNote 13—1,365 individuals who landed in 2011 resided in Nova Scotia in 2014, of which 1,080 intended to land in Nova Scotia, and 285 had a destination province other than Nova Scotia.
The above definition of retention assumes that the number of taxfilers with the specific province of intended destination is the total population that can be retained in a year (i.e., if all 1,460 individuals who had intended to land in Nova Scotia had filed taxes there in 2014, the province would have 100% retention). This method does not take into account sporadic tax filing behaviour or emigrants that left Canada, for which tax file was not available in 2014.
One alternative is a purely longitudinal approach, where a single landing cohort is selected (according to the province of intended destination, the province of initial tax filing, or both), and the retention rate is calculated as the proportion of this cohort that is still filing taxes in the province. When the province of initial tax filing is used to define the landing cohort, it is recommended that the first tax file occur in the year the immigrants were admitted (landing year = tax year), to exclude individuals who may have first arrived elsewhere and subsequently migrated to the region before filing taxes for the first time. A further restriction can be made if a researcher is interested in the population whose destination geography matches the geography of the first tax file.
Given that a portion of each annual cohort do not file taxes for their year of landing, it may be necessary to increase the population size for a region by defining the landing cohort as anyone who first filed taxes in the region within two years of landing (i.e., first_tax_year = landing_year or landing_year+1). Allowing individuals whose first tax filing occurred several years after landing to be part of a "landing cohort" is not recommended, as it is possible that they first landed elsewhere but did not file taxes. It is also a good idea to exclude intermittent filers from these analyses, as their place of residence is unknown in the years for which there is no tax data. Retention calculated this way will show a gradual decline in numbers; this decline is due to immigrants who stop filing, out-migration, and death.
If researchers are interested in secondary migrants to a region, this can be found by removing individuals in the defined landing cohort from the total number of immigrants filing taxes in the region at the time of interest. Again, however, these analyses should be restricted to individuals who first filed taxes within the same time period (year 0 or year 1) to avoid mistaking late-filers for in-migrants. If the landing cohort is restricted to immigrants whose destination geography matches the geography of first tax filing, a subsequent distinction should be made between secondary migrants who first filed elsewhere (and subsequently filed in the region of interest) and immigrants who first filed in the region of interest but were subsequently recruited by other jurisdictions (or information on their intended destination is missing altogether).
The following table presents an example of a longitudinal approach to provincial retention using fictitious data, with various definitions of the initial landing cohort.
| Years since landing | Taxfilers who first filed taxes in B.C. in year 0 | Retention rate | Taxfilers who first filed taxes in B.C. in year 0 or 1 | Retention rate | Taxfilers who first filed taxes in B.C. in year 0 or 1 and province of intended destination was B.C. | Retention rate |
|---|---|---|---|---|---|---|
| number | percent | number | percent | number | percent | |
| 0 | 20,000 | 100 | 20,000 | Note ...: not applicable | 17,500 | Note ...: not applicable |
| 1 | 18,000 | 90 | 25,000 | 100 | 19,000 | 100 |
| 2 | 17,000 | 85 | 23,000 | 92 | 18,000 | 95 |
| 3 | 16,500 | 83 | 22,000 | 88 | 17,500 | 92 |
|
... not applicable Source: Statistics Canada, 2014 Longitudinal Immigration Database. |
||||||
In the above example, retention in British Columbia can be calculated according to three definitions of the population, and the three-year retention rate varies per the definition adhered to. Importantly, all individuals in the sample filed taxes at each point in time.
With the 2016 IMDB release, a mobility summary table is available on the Statistics Canada website. The measures for mobility compare the intended destination from immigration files to the province of residence obtained from tax files. For example, table 21 provides the mobility measures based on the differences between the intended province of destination for immigrants admitted in 2010 and their province of residence in 2015 according to their tax files.
| Total destination (a) | Total residence (b) | Out migration (c) | In migration (d) | Stayed in province (e=a-c) | Population growth rate (f=b/a-1) | Retention rate (g=e/a) | Out migration rate (h=1-e/a) | In migration rate (i=d/a) | |
|---|---|---|---|---|---|---|---|---|---|
| Canada | 200,600 | 200,600 | 27,260 | 27,260 | 173,340 | 0.0 | 86.4 | 13.6 | 13.6 |
| Newfoundland and Labrador | 525 | 410 | 245 | 130 | 280 | -21.9 | 53.3 | 46.7 | 24.8 |
| Prince Edward Island | 1,930 | 370 | 1,630 | 70 | 305 | -80.8 | 15.8 | 84.5 | 3.6 |
| Nova Scotia | 1,630 | 1,405 | 570 | 340 | 1,065 | -13.8 | 65.3 | 35.0 | 20.9 |
| New Brunswick | 1,535 | 920 | 795 | 180 | 740 | -40.1 | 48.2 | 51.8 | 11.7 |
| Quebec | 38,050 | 33,900 | 5,955 | 1,805 | 32,095 | -10.9 | 84.4 | 15.7 | 4.7 |
| Ontario | 83,355 | 84,965 | 7,725 | 9,335 | 75,630 | 1.9 | 90.7 | 9.3 | 11.2 |
| Manitoba | 11,475 | 9,785 | 2,420 | 730 | 9,055 | -14.7 | 78.9 | 21.1 | 6.4 |
| Saskatchewan | 5,620 | 5,410 | 1,220 | 1,015 | 4,400 | -3.7 | 78.3 | 21.7 | 18.1 |
| Alberta | 24,255 | 29,850 | 2,360 | 7,955 | 21,895 | 23.1 | 90.3 | 9.7 | 32.8 |
| British Columbia | 31,820 | 32,790 | 4,250 | 5,215 | 27,575 | 3.1 | 86.7 | 13.4 | 16.4 |
| Other | 405 | 420 | 95 | 115 | 305 | 3.7 | 75.3 | 23.5 | 28.4 |
| Not stated | Note ..: not available for a specific reference period | 365 | Note ..: not available for a specific reference period | 365 | Note ..: not available for a specific reference period | 0.0 | 0.0 | 0.0 | 0.0 |
|
.. not available for a specific reference period Source: Statistics Canada, 2015 Longitudinal Immigration database (IMDB). |
|||||||||
The new table provides the following measures of mobility:
- The total destination (column a) represents the number of immigrants admitted in 2010 and filling taxes in year 2015, in Canada;
- The total residence (column b) represents the number of immigrant taxfilers in 2015 in the province specified;
- The out migration (column c) represents the number of immigrant taxfilers originating from the specified province and filing tax in another province, in year 2015;
- The in migration (column d) represents the number of immigrants originating from a difference province of destination and filing tax in the specified province in year 2015;
- The stayed in the province (column e) represents the number of immigrant taxfilers continuing their residence from the province of destination, in year 2015;
- The population growth rate (column f) represents the percentage of immigrant taxfilers gained or lost by the specified province. This takes into account immigrants migrating out and migrating in the specified province;
- The retention rate (column g) represents the percentage of immigrant taxfilers continuing their residence from the province of destination, in year 2015. This does not take into account immigrants migrating in from another province of destination;
- The out migration rate (column h) represents the percentage of immigrant taxfilers originating from the specified province and filing tax in another province in year 2015;
- The in migration rate (column i) represents the percentage of immigrants originating from a different province of destination and filing tax in the specified province in year 2015.
The table 21 shows that 200,600 immigrants were admitted to Canada in 2010 and filed taxes in 2015.
Of the 83,355 immigrant taxfilers who intended to reside in Ontario, 75,630 remained there in 2015, representing a retention rate of 90.7%.
While 7,725 immigrant taxfilers migrated out of Ontario, 9,335 immigrant taxfilers had moved into Ontario from other destination provinces. So, for this 2010 cohort, the total number of Ontario residents in 2015 was 84,965, or 1.9% more than the number of immigrant tax filers who intended in reside in Ontario.
Finally, analysts should use caution when studying low-level census geographies over a long period of time, as CA and CMA boundaries change and CSDs are dropped and added. If possible, analysts should run the Postal Code Conversion File (PCCF+) program to standardize postal codes to a constant census geography.
D.4 Calculating income trajectories over time
As is the case with retention, calculating year-to-year changes in employment earnings (or, for that matter, any economic variable) requires consecutive information. For example, if a researcher wants to compare the median employment earnings of the 2000 cohort of women aged 24 to 54, 1 year after landing and 5 years since landing (Table 22), records with missing T1FF files could be removed from the analysis. The decision to remove these records would be based on the desire to evaluate the cohort's median income versus the cohort filer's median income.
| IMDB_ID | Landing year | Age at landing | Gender | Wages | |
|---|---|---|---|---|---|
| income 2001 | income 2002 | ||||
| dollars | |||||
| IM583 | 2000 | 34 | Female | 20,500 | 49,000 |
| IM145 | 2000 | 53 | Female | Note ..: not available for a specific reference period | 56,000 |
| IM548 | 2000 | 29 | Female | 11,500 | 33,800 |
| IM798 | 2000 | 31 | Female | 36,000 | 0 |
| IM961 | 2000 | 42 | Female | 10,000 | Note ..: not available for a specific reference period |
| IM967 | 2000 | 40 | Female | Note ..: not available for a specific reference period | Note ..: not available for a specific reference period |
| IM110 | 2000 | 35 | Female | 0 | 59,000 |
|
.. not available for a specific reference period Source: Statistics Canada, example from Longitudinal Immigration Database (IMDB). |
|||||
Use caution when calculating the "first year in Canada" income as it might not represent a full year of taxation. For example, someone who landed in November of 2013 and filed taxes for 2013 would have only two months of income in 2013. A best practice is to use the first full year of income (landing year +1, see Table 20). One exception is pre-filers, those who filed taxes in Canada before landing and filed at landing year as well, are most likely reporting income for the entire year.
Over-time income should also be studied in constant dollars. Consequently, Consumer Price Index (CPI) adjustments should be made (Appendix D.7). This adjustment is made in the IMDB tables.
D.5 Rounding data
Respecting the privacy of Canadians is important to Statistics Canada. Consequently, any tables produced from IMDB_T1FF files are subject to rounding. The purpose of rounding is to ensure that no small cells are released that may reveal information on specific individuals or small groups of individuals. In general, the macros will take an unrounded input dataset of various statistics (counts, means, medians, etc.) and output a rounded dataset.
The rounding rules are available to all researchers accessing the microdata in the Research Data Centers (RDC).
D.6 Identifying outliers
The variable OUTLIER_IND was created to identify outliers within the T1FF (see Section 5.5). It should be used to remove outlier data from any calculation (e.g., mean, median, or regression) employing tax data. Outliers differ from one year to another, meaning that a person's data may be identified as an outlier for a given year but not for a subsequent year.
The following table (Table 23) gives the distribution of the outliers in the tax files for 1982 and subsequent years by type of resident for the 2016 IMDB. Less than 0.05% records were identified as outliers per tax year. The proportion of outliers increased from 1995 to 1996 as a result of updates to the outlier detection method applied to tax files for 1997 and subsequent taxation years.
| Year | Total | |
|---|---|---|
| number | percent | |
| 1982 | 20 | 0.01 |
| 1983 | 25 | 0.01 |
| 1984 | 45 | 0.01 |
| 1985 | 30 | 0.01 |
| 1986 | 75 | 0.02 |
| 1987 | 60 | 0.01 |
| 1988 | 100 | 0.01 |
| 1989 | 85 | 0.01 |
| 1990 | 80 | 0.01 |
| 1991 | 85 | 0.01 |
| 1992 | 165 | 0.01 |
| 1993 | 135 | 0.01 |
| 1994 | 85 | 0.01 |
| 1995 | 165 | 0.01 |
| 1996 | 500 | 0.03 |
| 1997 | 585 | 0.03 |
| 1998 | 705 | 0.03 |
| 1999 | 600 | 0.03 |
| 2000 | 670 | 0.03 |
| 2001 | 695 | 0.03 |
| 2002 | 655 | 0.02 |
| 2003 | 725 | 0.02 |
| 2004 | 1,030 | 0.03 |
| 2005 | 840 | 0.03 |
| 2006 | 900 | 0.03 |
| 2007 | 925 | 0.02 |
| 2008 | 1,000 | 0.03 |
| 2009 | 1,055 | 0.03 |
| 2010 | 1,205 | 0.03 |
| 2011 | 1,235 | 0.03 |
| 2012 | 1,035 | 0.02 |
| 2013 | 1,245 | 0.03 |
| 2014 | 1,155 | 0.02 |
| 2015 | 1,405 | 0.03 |
| 2016 | 1,100 | 0.02 |
| Source: Statistics Canada, 2016 Longitudinal Immigration Database. | ||
D.7 Adjusting income for the Consumer Price Index (CPI)
In order to take into account the cost of living, all incomes should be adjusted to the Consumer Price Index (CPI) for Canada. "The Consumer Price Index (CPI) is an indicator of changes in consumer prices experienced by Canadians. It is obtained by comparing, over time, the cost of a fixed basket of goods and services purchased by consumers. Since the basket contains goods and services of unchanging or equivalent quantity and quality, the index reflects only pure price change."Note 14 The adjustment factors for 2016 are available in Table 24. To transform data to constant dollars of a specific year (base year), data users need to multiply the dollar values in all but the base year by a year-specific adjustment factor. To obtain the adjustment factors, data users need to divide the CPI of the base year by the CPI of the specific year. In Table 24, the base year is 2016.
| Year | 2016 consumer price index adjustment equals 128.4 divided by |
|---|---|
| number | |
| 1982 | 54.9 |
| 1983 | 58.1 |
| 1984 | 60.6 |
| 1985 | 63.0 |
| 1986 | 65.6 |
| 1987 | 68.5 |
| 1988 | 71.2 |
| 1989 | 74.8 |
| 1990 | 78.4 |
| 1991 | 82.8 |
| 1992 | 84.0 |
| 1993 | 85.6 |
| 1994 | 85.7 |
| 1995 | 87.6 |
| 1996 | 88.9 |
| 1997 | 90.4 |
| 1998 | 91.3 |
| 1999 | 92.9 |
| 2000 | 95.4 |
| 2001 | 97.8 |
| 2002 | 100.0 |
| 2003 | 102.8 |
| 2004 | 104.7 |
| 2005 | 107.0 |
| 2006 | 109.1 |
| 2007 | 111.5 |
| 2008 | 114.1 |
| 2009 | 114.4 |
| 2010 | 116.5 |
| 2011 | 119.9 |
| 2012 | 121.7 |
| 2013 | 122.8 |
| 2014 | 125.2 |
| 2015 | 126.6 |
| 2016 | 128.4 |
| Source: Statistics Canada, Table 18-10-0005-01 | |
D.8 Calculating key income measures
The IMDB tables contain several income measures. Table 25 describes which variables of the T1FF are included in their calculation.
| Measure | Components | Formula | |
|---|---|---|---|
| Wages, salaries and commissions income | Earnings from T4 slips; other employment income | T4E__i + OEI__i | |
| Self-employment income | |||
| Since 1988 | Self-employment income from business, profession, commission, farm, and fishing; limited partnership income | SEI__i + LTPI_i | |
| Before 1988 | Self-employment income from business, profession, commission, farm, and fishing; | SEI__i | |
| Investment income | Interest and investment income; dividends; capital gains/losses, net taxable | INVi_i + XDIV_i + CLKGX | |
| Employment Insurance benefits | Employment Insurance benefits | EINS_i | |
| Social welfare benefits | social welfare benefits (use family-level) | SASPYf | |
| Source: Statistics Canada, 2016 Longitudinal Immigration Database. | |||
It is to be noted that all outliers are removed from these calculations (Outlier_ind=1), that the variable Province of Residence at the End of the Year (PRCO_) is used to identify the province, and that all incomes are adjusted according to the Consumer Price Index (CPI) of the year of the most recent T1FF available. "Mean with income" is the mean income of immigrant tax-filers with income of the given type. "Median with income" is the median income of immigrant tax-filers with income of the given type.
References
Badets, J., and C. Langlois. 2000. "The Challenges of Using Administrative Data to Support Policy-Relevant Research: The Example of the Longitudinal Immigration Database (IMDB)." In Symposium 99 - Combining Data from Different Sources, 1999. Statistics Canada International Symposium Series: Proceedings. Statistics Canada Catalogue no. 11-522-XPE. Available at https://www150.statcan.gc.ca/n1/en/catalogue/11-522-X19990015642 (accessed November 5, 2018).
Carpentier, A., and G. Pinsonneault. 1994. Representativeness Study of Immigrants Included in the Immigrant Data Bank (IMDB Project). Ministère des Affaires internationales, de l'Immigration et des Communautés culturelles. Government of Quebec.
Cascagnette, P., and SDLE production section. 2018. "Social Data Linkage Environment (SDLE) Methodology Report – Linkage between the Immigration File (1952- January 2018) and the SDLE Derived Record Depository (version 19)". Unpublished document. Ottawa: Statistics Canada.
Diaz-Papkovich, A. 2017. IMDB Linkage Summary 2017. Unpublished document. Ottawa: Statistics Canada.
Dryburgh, H. 2004. The Longitudinal Administrative Databank (LAD) and the Longitudinal Immigration Database (IMDB): Building the LAD_IMDB - A Technical Paper. Statistics Canada Catalogue no. 89-612-XIE. Available at http://publications.gc.ca/Collection/Statcan/89-612-X/89-612-XIE2003001.pdf (accessed March 13, 2017).
Dusetzina, S.B., S. Tyree, A.M. Meyer, A. Meyer, L. Green, and W.R. Carpenter. 2014. Linking Data for Health Services Research: A Framework and Instructional Guide [Internet]. Prepared by the University of North Carolina at Chapel Hill under contract no. 290-2010-000141. AHRQ Publication no. 14-EHC033-EF. Rockville, MD: Agency for Healthcare Research and Quality. Available at https://www.ncbi.nlm.nih.gov/books/NBK253313/ (accessed November 5, 2018).
Government of Canada. 2016. Determine your eligibility – Citizenship. Available at http://www.cic.gc.ca/english/citizenship/become-eligibility.asp (accessed July 20, 2016).
Immigration and Refugee Board of Canada. 2015. "Refugee Protection Division." Web page. Available at http://www.irb-cisr.gc.ca/Eng/RefClaDem/Pages/RpdSpr.aspx (accessed January 13, 2016).
Immigration, Refugees and Citizenship Canada. 2015. Annual Report to Parliament on Immigration. Available at http://www.cic.gc.ca/english/pdf/pub/annual-report-2015.pdf (accessed June 10, 2016).
Immigration, Refugees and Citizenship Canada. 2016. Report on Plans and Priorities 2015-2016. Available at https://www.canada.ca/en/immigration-refugees-citizenship/corporate/publications-manuals/report-plans-priorities/2015-2016.html (accessed November 5, 2018).
Langlois, C., and C. Dougherty. 1997. The Longitudinal Immigration Database (IMDB): An introduction. Proceedings of the 1997 Citizenship and Immigration Canada Conference on Immigration, Employment and the Economy.
McLeish, S. 2011. 2008 IMDB Landing File: Data Quality Working Paper. Unpublished document. Ottawa: Statistics Canada. Rotermann, M., C. Sanmartin, R. Trudeau, and H. St-Jean. 2015. "Linking 2006 Census and hospital data in Canada." Health Reports. Vol. 26, no. 10. Statistics Canada Catalogue no. 82-003-X. Available at https://www150.statcan.gc.ca/n1/pub/82-003-x/2015010/article/14228-eng.pdf (accessed March 13, 2017).
Statistics Canada. 2016. 150 years of immigration in Canada. Canadian Megatrends. Statistics Canada Catalogue no. 11-630-X. Available at https://www150.statcan.gc.ca/n1/pub/11-630-x/11-630-x2016006-eng.htm (accessed March 14, 2017).
Statistics Canada. 2018. "Annual Income Estimates for Census Families and Individuals (T1 Family File)." Web page. Available at http://www23.statcan.gc.ca/imdb/p2SV.pl?Function=getSurvey&SDDS=4105 (accessed October 5, 2018).
Winkler, W.E. 2009. "Record linkage." Sample Surveys: Design, Methods and Applications 29A: 351–380.
- Date modified: