
Analytical Studies Branch Research Paper Series
Chronic Low Income Among Immigrants in Canada and its Communities

Archived Content
Information identified as archived is provided for reference, research or recordkeeping purposes. It is not subject to the Government of Canada Web Standards and has not been altered or updated since it was archived. Please "contact us" to request a format other than those available.
by Garnett Picot and Yuqian Lu
Abstract
This paper examines the rate of chronic low income among immigrants aged 25 or older in Canada during the 2000s. Chronic low income is defined as having a family income under a low-income cut-off for five consecutive years or more. A regionally adjusted low-income measure is used for the analysis. Among immigrants who were in low income in any given year, about one-half were in chronic low income. The highest chronic rates were observed among immigrant seniors, as well as immigrants who were unattached or lone parents. There were large differences in the chronic low-income rate by immigrant place of birth, even after adjusting for differences in other immigrant background characteristics. The chronic low-income rate was lower among economic class immigrants than among family or refugee classes, but the difference was reduced after adjusting for background characteristics. Chronic low-income rates among immigrants varied significantly across the 29 cities/regions in the study, varying by a factor of 5 between the highest and lowest rates. However, the community ranking was not static and changed significantly between the beginning and end of the 2000s.
Keywords: poverty, low income, immigration, poverty dynamics
Executive summary
Rates of low income among immigrants continue to be high relative to the Canadian-born population. Concern regarding low income is closely tied to its duration. If immigrant low-income spells are mostly of short duration, the negative effect on immigrants and society may be less than if they consist primarily of longer, more chronic spells. In this paper, chronic low income is defined as having a family income under a low-income cut-off for five consecutive years or more. The focus of this analysis is on immigrants during the 2000s who were in Canada for 5 to 20 years and over the age of 25.
Past research has focused primarily on new spells of low income and has asked how many subsequently became chronic. From this perspective, most new spells of low income among immigrants are not chronic, which is consistent with earlier research. However, this paper’s primary goal is somewhat different. It focuses on the prevalence of chronic low income in any given year, its characteristics, and its variation across 29 cities/regions. Among immigrants who were in low income in any given year during the 2000s, approximately one-half were in chronic low income at that time.
The proportion of immigrants who were in chronic low income fell from 16.3% in 2004 to 12.3% by 2012. However, the chronic rate fell more quickly among the comparison group, which consisted primarily of the Canadian-born. As a result, the chronic low-income rate was 2.6 times higher among immigrants than the Canadian-born in 2000, and 3.3 times higher in 2012. In addition, chronic low income was found not to be restricted to more recently arrived immigrants. By 2012, there was little difference in the chronic low-income rate between immigrants who had been in Canada for 5 to 10 years and those in the country for 16 to 20 years.
The highest chronic low-income rates in 2012 were observed among immigrants over the age of 65. These relatively high rates—30% among all immigrant seniorsNote 1 and over 50% among more recent immigrant seniorsNote 2—were in sharp contrast to the rate observed among Canadian-born seniors (about 2%). Immigrants who were unattached or lone parents also displayed higher-than-average chronic low-income rates. Country of origin also mattered, even after adjusting the rates for differences in characteristics such as official language and education at landing, years since immigration, immigrant class, age and family type.
Differences in the chronic low-income rate among immigrants with different levels of educational attainment were relatively small by 2012, in part because the rate had risen among those with a post-graduate degree, and fell among those with secondary or less between 2000 and 2012. The chronic low-income rate was lower among economic class immigrants than among the family class or refugees; it was 1.4 times higher among the family class and refugees. There was little difference between immigrant men and women, particularly after adjusting the rate for differences in background characteristics.
Immigrant chronic low-income rates varied significantly among the 29 cities/regions in the study, differing by almost a factor of 5 between the cities/regions with the highest and lowest rates. Of this variation, 40 % was due to differences among communities in immigrant background characteristics. The order of the communities was determined according to the chronic low-income rate of their immigrants. This rank ordering changed significantly between 2000 and 2012. In 2000, the one-quarter of the cities/regions with the lowest immigrant chronic rates were mostly in Ontario, but, by 2012, they were all in the Prairie Provinces. However, Canada’s three largest cities were among the one-quarter of communities with the highest chronic rates in both 2000 and 2012.
The chronic low-income rate among the Canadian-born population in any city/region acts as a control for economic and policy effects that influence the chronic rate among immigrants. However, the chronic rate among the Canadian-born in a city/region is not a good predictor of the immigrant chronic rate in the same community. This analysis suggests that unobserved factors other than economic conditions, policy effects and immigrant background characteristics contribute to the differences in immigrant chronic low-income rates in a city/region.
1. Introduction
Rates of low income among immigrants have been a concern in Canada since the 1990s, when they rose to historically high levels. Among recent immigrants—those who had been in Canada 5 years or less—the low-income rate rose from 25%Note 3 in 1980 to 36% by 2000, and then fell by about 8 percentage points by 2010. Among immigrants who had been in Canada for 11 to 15 years, the rate rose from 15% in 1980 to 23% by 2000, and then declined by a couple of percentage points by 2010 (Picot and Hou 2014).
The immigrant low-income rate relative to that of the Canadian-born was somewhat different. During the 1990s the low-income rate rose among immigrants but fell among the Canadian-born. Hence, the low-income rate among recent immigrants was 1.4 times that of the Canadian-born in 1980, rising to 2.5 by 2000 and increasing further to about 2.7 by 2010.
Concern regarding low income is closely tied to its duration. If most low-income spells are short, families may not experience negative effects to the same extent if spells were longer. Thus, it is important to know to what extent the low-income rate in any given year consists of transient or chronic low income.
Little research has been conducted in Canada on persistent low income among immigrants, particularly since 2000 when the low-income rate started to fall. Hatfield (2004) produced an analysis of persistent low income that focused on vulnerable groups. He concluded that “recent” immigrants were one of the five groups in Canadian society most vulnerable to persistent low income during the 1990s. They were 7.5 times as likely to be in persistent low income as Canadians who were not in one of the five high-risk groups. Picot, Hou and Coulombe (2008) also focused on recent immigrants, but looked at overall low-income dynamics (entry, exit and duration) among immigrants entering Canada. They found that about two-thirds of immigrants entering Canada experienced at least one year of low income during their first 10 years in the country. Among the immigrant cohorts entering Canada in the mid-1990s, around one-quarter of the low-income spells lasted 5 years or more, indicating that the majority of the new spells were of shorter duration. However, the analysis did not account for multiple spells of low income, focusing only on the first spell. Also, it did not examine the extent to which low income in any given year was composed of transient or persistent low income.
There are numerous ways to approach the study of persistent low income. Section 2 of this paper outlines the approach used here to measure both annual and chronic low income. The goal is to produce reliable estimates at both the national and city/region levels. Section 3 presents results.
2. Measuring chronic low income and data sources
This paper employs data from the Longitudinal Immigration Database (IMDB) for the period from 1993 to 2012. The IMDB is a longitudinal database constructed using T1 tax records and the landing records of all immigrants who have entered Canada since 1980. About 95% of the working-age population in Canada files a tax return. Since only immigrants who have entered Canada since 1980 can be identified in the IMDB, and the reference period starts in 2000, the analysis is restricted to immigrants in Canada for 20 years or less. Data from the Longitudinal Administrative Data (LAD) base are used to produce results for a comparison group that includes the Canadian-born plus immigrants who have been in Canada for more than 20 years. Both the immigrant and comparison-group populations are restricted to persons 25 years of age or older because of lower taxation coverage rates among the younger population.
The low-income measure is based on the census family, which includes all persons in the immediate family.Note 4 The after-tax and after-transfer family incomeNote 5 of census families is used in this analysis. The family income is adult-equivalent adjusted.Note 6 This technique is used to adjust family income for differences in family size. The adult-equivalent adjusted income is a per capita income representing the resources available to each family member, after accounting for differences in family size. Hence, the unit of analysis in this study is the individual, and each individual has an adjusted family income. All members of the same family have the same adjusted family income. In any given year, an individual is in low income if his or her annual adult-equivalent adjusted family income is below the low-income cut-off.
2.1 A regionally adjusted Low Income Measure
There are a number of issues to consider when choosing how to measure an annual low-income rate. They are summarized in Appendix A. For this paper, one of the most important is how to reflect the regional variation in the cost of basic necessities in the regional low-income cut-off. For example, one might use a national Low Income Measure (LIM) (one-half of the median income of Canadians) as a cut-off and apply it to family incomes in all communities. It does not account for regional variation in the costs of necessities. In this case, the low-income rate will be overestimated in cities where the basic necessities are less expensive. That is because the amount of, say, food or shelter that can be purchased with an income at the level of the low-income cut-off will be greater in cities with lower living costs. To overcome this issue, a new measure is developed in this paper—a regionally adjusted LIM, or simply “adjusted LIM.” This measure takes advantage of important properties of the Market Basket Measure (MBM).
The MBM was developed in the early 2000s (see Statistics Canada [2013]). A recent review of the MBM noted that the MBM was designed “…to provide a more intuitive and transparent measure of low income based on a basket of goods and services representing a modest, basic standard of living....The MBM also provided a measure more sensitive to regional differences in living costs, particularly for shelter and transportation, than the LICOs and the LIM” (Hatfield, Pyper and Gustajtis 2010, p. 1). The MBM approach measures the cost of a standard basket of goods and services that provide a “modest and basic” standard of living in various cities. Based on that measure, a low-income cut-off for a family of four is determined. The cut-off varies by region, depending on the cost of basic necessities.
The regionally adjusted low-income measure used in this paper for a particular city/region is simply the national LIM multiplied by a city-specific adjustment factor to account for differences in the cost of basic necessities. In this work, the national LIM is one-half of the median adult-equivalent adjusted income of Canadians over the period from 1993 to 2012.Note 7 The regional adjustment factor for a particular city/region is simply the 2012 MBM cut-off value for that city/region divided by the average MBM cut-off for Canada as a whole.Note 8 Cities/regions with high costs of basic necessities will have adjustment factors above 1.0, while those with lower costs will have values below 1.0. The adjusted LIM is produced for 29 cities/regions. The adjusted LIM is fixed for all years. Each individual’s adult-equivalent adjusted income for any given year is used to determine whether they fall below the adjusted LIM. Income is in constant dollars (adjusted for changes in the Consumer Price Index). Hence, this paper uses a fixed low-income cut-off that is constant through time for any given city/region.
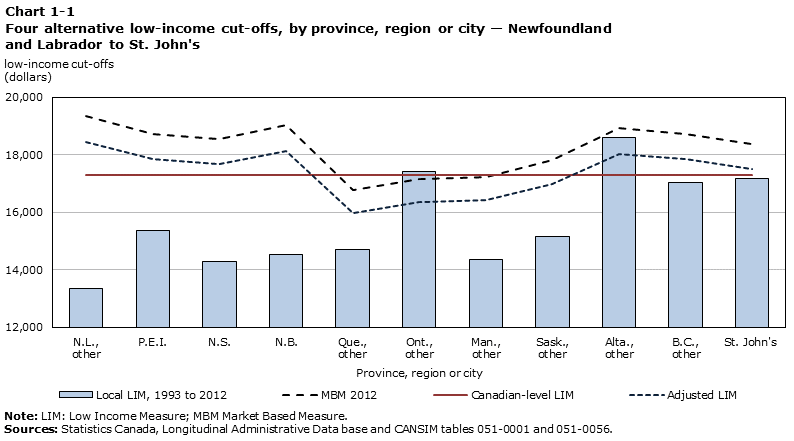
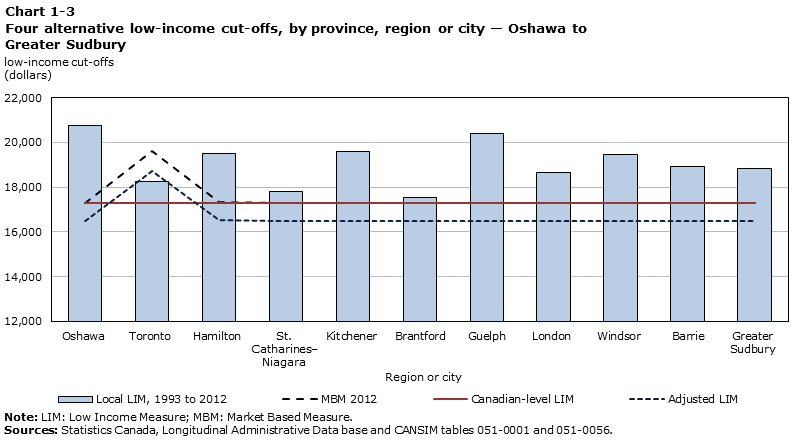
Chart 1-1 to Chart 1-4 shows—for each city/region in the analysis—how the adjusted LIM compares to other commonly used low-income cut-offs, including the MBM, the Canadian-level LIM and a “local” LIM. The last measure estimates the cut-off as 0.5 of the median incomeNote 9 for each city/region. This approach is based on the assumption that local income levels reflect local standards of living for each city/region. The salient observations include the following:
- The local LIM (0.5 median income in each city/region) displays more regional variability than the other measures, and much more than the MBM. The local LIM likely exaggerates differences in the low-income cut-offs that are driven by regional differences in living costs.
- The Canadian-level LIM underestimates differences in the low-income cut-off associated with living costs (since it does not attempt to capture such differences), and hence would overestimate low-income rates in cities with lower costs of the basic necessities.
- The adjusted LIM reflects (by definition) the regional differences in living costs embedded in the MBM. The relative values of the adjusted LIM, among regions, are the same as those for the MBM. For example, the adjusted LIM is higher in cities such as St John’s, Toronto, Ottawa–Gatineau, and most cities/regions in Alberta and British Columbia than for Canada as a whole, and lower in most Quebec cities/regions (including Montréal) and many smaller Ontario cities/regions.
2.2 Measuring chronic low income
2.2.1 Should the focus be on new spells or all spells in a given year?
Annual low-income rates for communities are generated using the approach outlined above. But it is necessary to convert these rates to a chronic low-income measure. The first issue is whether to focus on new low-income spells or all spells in any given year. The two approaches provide very different answers.
Two basic facts that appear, at first glance, to be contradictory have evolved from the low-income dynamics research of the 1980s. A large percentage of those who are in low income at any point in time are living in long-term or chronic low income. However, new spells of low income are quite short, with only a small percentage warranting the label of persistent or chronic (Rodgers and Rodgers 1993). These two facts stem from very different ways of approaching the measurement of chronic low income. The latter conclusion is based on an analysis of new spells of low income and assesses the duration of these new spells. This research finds that most new spells among the general population tend to be short, with very few long spells (Bane and Ellwood 1986; Ruggles and Williams 1989). The second approach focuses on a point in time and asks, of those in low income in that year, how many have been in low income long enough for it to be considered chronic. This research finds that a substantial proportion of people who are in low income at a point in time are living in chronic low income. For example, Finnie and Sweetman (2003) found that, in Canada, the “always poor” (poor over a period of five-years or more) constituted around 40% of the low-income population in any given year during the early 1990s.
This paper produces estimates of the extent to which low-income spells are chronic for both new low-income spells, and the low-income spells that exist in any given year. A low-income spell is considered to be chronic if it lasts for 5 or more consecutive years. Why five consecutive years of low income? This is in part because it is in common usage for Canada (Finnie and Sweetman 2003) and in papers by the Chronic Poverty Research Centre (CPRC) for Britain. After studying various methods and analytical frameworks, the CPRC concluded that five consecutive years of poverty is a reasonable definition of chronic poverty. Five years is perceived to be a long period of time in a person’s lifespan, so five years of poverty can have a significant effect on other outcomes. In addition, the CPRC reported that people who were in poverty for at least five consecutive years had a significant probability of remaining in poverty for an extended period of time (Hulme, Moore and Shepherd 2001).
3. Results: Chronic low income among immigrants during the 2000s
3.1 Are immigrant low-income spells chronic or transient?
This paper starts by focusing on new spells of low income. These new periods may start just after an immigrant arrives in Canada or after the immigrant has been in the country for many years.
Among immigrantsNote 10 in low income during their first full year in Canada, from one-third to two-fifths of their spells were chronic, in the sense that they lasted at least all of the first five years in Canada. About one-half of these immigrants experienced more transient low income—they were in low income for three years or less during their first five years in Canada.
Immigrants who have been in Canada many years can also have new spells of low income. It is assumed that a period of low income is new if immigrants were not in low income for four consecutive years prior to entering low income—when their family income fell below the low-income cut-off. Among immigrantsNote 11 in Canada for 5 to 20 years, about 20% of the new spells were chronic, lasting for at least five consecutive years.Note 12 About two-thirds of the new spells were transient; these immigrants were in low income for three years or less during the five years following their entry into a new low-income spell.
In the second approach to the measurement of chronic low income, the focus is on how many of the immigrants in low income in, for example 2012, were in chronic low income (i.e., in that state for five or more consecutive years up to and including the year of interest, here from 2008 to 2012 inclusive). From this point on, the paper concentrates on this approach. If the interest is in, say, reducing the low-income rate in any given year, the policies and programs considered will vary, depending upon whether the low income is predominantly chronic or transient. Hence the focus on chronic low income in a given year.
In 2012, 51% of the immigrants in low income were in chronic low income.Note 13 Put another way, one-half of all immigrants who found themselves below the low-income cut-off in 2012 had been there for at least five consecutive years, many for much longer (Table 2, far right column). This percentage was relatively stable over the 2000s. Furthermore, the share of low-income immigrants who were in chronic low income varied little by length of time in Canada—it was roughly one-half among both longer-tenured immigrants (in Canada for 16 to 20 years) and more recent immigrants (in Canada for 5 to 10 years).
The chronic component of low income was higher among immigrants than the Canadian-born. In 2012, around 43% of the comparison group that was in low income was in chronic low income, compared with one-half of all immigrants.Note 14
But during any given year, there are two kinds of chronic spells—those that are already chronic (i.e., the immigrant was in low income for at least five years up to and including the reference year), and those that will become chronic. Up to this point, the analysis has focused on the already chronic spells—but immigrants may be in a low-income spell that is less than five years in duration but will ultimately last five or more years (i.e., the spells have been right truncated). In essence, these immigrants are in chronic low income but do not yet know it. When such spells are also considered to be chronic, the share of low-income immigrants who are in chronic low income in any given year increases from one-half to roughly two-thirds.Note 15 Chronic low income constitutes a large part of the low-income rate in any given year, whether the focus is on spells that are already chronic, or spells that will ultimately become chronic.
3.2 The prevalence of chronic low income
As noted earlier, an individual is in chronic low income in a given year if he or she is in low incomeNote 16 for at least five consecutive years up to and including the year of interest. The chronic low-income rate is the proportion of all individuals in any given group who are in chronic low income.Note 17 Salient points regarding immigrantNote 18 chronic low income include the following:
- During the 2000s the chronic low-income rate among all immigrantsNote 19 peaked at 16.3% in 2004 and declined to 12.3% by 2012 (Table 1). However, the 22% decline in chronic low income among immigrants between 2000 and 2012 was less than that observed among the comparison groupNote 20 (mainly the Canadian-born), which fell by 39%, from 6.1% to 3.7% over the period.
- By 2012, chronic low income was almost as prevalent among longer-tenured immigrants as among recent immigrants—the improvement in chronic low income over the 2000s was concentrated among more recently arrived immigrants. It was among this group that economic outcomes appeared to have improved most. For example, the chronic low-income rate fell by about one-third among immigrants in Canada for 5 to 10 years, while it increased among those in Canada for 16 to 20 years. Overall, the difference in chronic low-income rates that existed between recent entrants and longer-term immigrants had largely disappeared by 2012.
- While the absolute level of chronic low income among immigrants fell, its level relative to the Canadian-born increased. In 2000, the immigrant chronic low-income rate was 2.6 times that of the comparison group; by 2012, it was 3.3 times higher. Even among immigrants in Canada for 16 to 20 years, the chronic low-income rate remained well above that of the Canadian-born. In 2000, it was 1.7 times higher, and by 2012, 3.1 times higher. Time spent in Canada did little to diminish the rate of chronic low income among immigrants relative to the Canadian-born.Note 21
3.3 Among which groups is chronic low income highest?
The observations below are based on the raw, unadjusted data, and represent the actual variation among groups. However, some of this difference may result from differences in background characteristics. Hence, a logistic regression is used to estimate the probability of being in chronic low income after accounting for differences in such characteristics. These rates are referred to as adjusted chronic low-income rates. The characteristics used in the analysis are gender, years since immigration, immigrant class, age, family type, education level at landing, place of birth, official language at landing, and geographic location in Canada. The salient points are provided below.
- Age differences: Immigrants over the age of 65 had the highest rates of chronic low income in 2012, at around 30%. This was roughly three times higher than the rate among immigrants aged 25 to 54 (Table 3-1). Among immigrant seniors in Canada for 5 to 10 years, over one-half (56%) were in chronic poverty in 2012 (Table 3-2). This is in sharp contrast to the older population in the comparison group (mainly the Canadian-born), who displayed the lowest chronic low-income rate of all age groups, at only 1.9% (Table 4). The result for the Canadian-born is not surprising, since Canadian seniors have displayed the lowest low-income rates of any age group for many years. The high rates among immigrant seniors are not explained by their background characteristics. Even after controlling for differences in the characteristics listed above, the chronic low-income rate among immigrant seniors remained 3.6 times higher than that among comparable immigrants aged 25 to 34 (Table 5).
- Family type differences: There was also a large difference in chronic low-income rates by family type. Unattached individuals and lone parents had rates around 20% to 25%, which was about twice as high as the rate among attached immigrants, with or without children (Table 3-1). However, from 2000 to 2012 the rate of chronic low income fell from 27% to 20% among immigrant lone parents.
- Place of birth differences: There was significant variation in chronic low-income rates among immigrants from different places of birth. In 2012, immigrants from Northwestern Europe, the Philippines, Australia, New Zealand and the United States had rates in the 4% to 5% range, while those from East and South Asia had rates in the 17% to 19% range—roughly four times higher (Table 3-1). Some of this difference may be explained by differences across places of birth in terms of education level at landing, official language at landing, family type, years since immigration, immigrant class, or geographic location in Canada. However, even after controlling for differences in these and other characteristics, about three-quarters of the place of birth difference in chronic low-income rates remained (Table 5).
- Years since immigration: It is well known that immigrants’ economic outcomes improve with years in Canada. In 2012, however, there was little difference in the chronic low-income rates between those in Canada for 5 to 10 years (13.3%) and 16 to 20 years (11.5%) (Table 1). Chronic low income was not restricted to recent immigrants. The unexpectedly high rates of chronic low income among immigrants in Canada for 16 to 20 years was partly due to compositional characteristics. The adjusted rates among the longer-tenured immigrants (9.5%) were about 0.6 times those of immigrants who had been in Canada 16 to 20 years (Table 5), compared with an unadjusted rate that was 0.8 times higher. Immigrants in Canada for 16 to 20 years were one of the few groups for whom chronic low-income rates rose from 2000 to 2012 (Table 1).
- Gender differences: In 2012, the chronic low-income rate among female immigrants (at 13.8%) was roughly 1.3 times the rate for men (10.6%) (Table 3-1). Much of this was due to differences in background characteristics. Once the rates were adjusted for such differences, the rate of chronic low income was 1.1 times higher among women than men (Table 5).
- Official language differences: Official language at landing matters, but not as much as first appears. Chronic low-income rates were about twice as high among immigrants who spoke neither English nor French at landing than among those who spoke both official languages (Table 3-1). This difference was accentuated among recent immigrants, for whom language at entry had a larger effect. Among immigrants in Canada for 5 to 10 years, those without knowledge of either English or French had a chronic low-income rate of around 20% in 2012, almost three times higher than the rate among their counterparts with knowledge of both English and French (Table 3-2). Since knowledge of official languages correlates with variables such as place of birth and education, it is difficult to independently estimate its effect. However, after adjusting for differences in factors such as place of birth, level of education, family type, and location in Canada (Table 5), the rate among immigrants with no knowledge of English or French at landing was 1.4 times that of immigrants with knowledge of both languages, considerably less than the unadjusted results.
- Education level at landing: In 2012, there was not a large difference in chronic low-income rates by education level at landing. The rates for those with a secondary school education were 1.7 times higher than for those with a university degree. Much of this was associated with differences in other characteristics. The adjusted rates were only 1.1 times higher for those with a secondary school education than for those with a non-university postsecondary education (Table 5).
- Immigrant class differences: It is well-known that family class immigrants and refugees typically earn less than economic class immigrantsNote 22 and their chronic low-income rates reflect this difference. There was little difference between the family class and refugees. The most notable difference, however, was in the chronic low-income rates among provincial nominees (at 5.9%) and other economic class immigrants (at 10.2%). This is not surprising given that provincial nominees tend to earn more than other economic class immigrants, such as federal skilled workers, largely because they are far more likely to have Canadian work experience prior to landing (Pandey and Townsend 2013; Hou and Picot 2016). After controlling for differences in other variables, most of the difference in the chronic low-income rates between the Provincial Nominee Program and other economic class immigrants disappears (Table 5).
3.4 Chronic low income among immigrants by community
A number of factors may drive the differences in chronic low-income rates among immigrants in different cities and regions. Economic conditions vary across cities and regions, with implications for earnings and low income. Economic integration may be difficult in cities that attract very large numbers of immigrants, such as Montréal, Toronto and Vancouver, even with a strong economy. In addition, compositional effects may play a role as specific communities tend to attract immigrants from particular places of birth and rates of low income vary by places of birth. The distribution of immigrants by class (i.e., economic, family, refugee) may also vary across communities and thus affect chronic low-income rates.
For the purposes of this analysis, Canada is divided into 29 cities and regions. The regions are selected so that the sample of immigrants in each area is sufficient to provide robust estimates of chronic low income.
There was considerable variation in chronic low-income rates across communities. In 2012, the rates of chronic low income among immigrants varied from just over 3% in rural Alberta (that is, the province of Alberta excluding Calgary and Edmonton) and rural Manitoba (that is, the province of Manitoba excluding Winnipeg) to 16% in Windsor and 15% in Vancouver, the latter rates being 5.3 times higher than the lowest rate (Table 6-1). Differences in immigrant characteristics between cities/regions accounted for about 40% of the difference in chronic low-income rates. The “adjusted” highest and lowest chronic low-income rates across cities/regions differed by a factor of 2.8, whereas the unadjusted rates yielded a difference of 4.6 (Table 8). The ranking of cities/regions according to their chronic low-income rate was not static. In 2000, the rate of chronic low income among immigrants was lowest in the east, not the west, with a rate of 5.3% in Guelph and 20.6% in Vancouver (Table 6-1).
An alternative approach is to place the cities/regions in quartiles (Table 9). In both 2000 and 2012, the one-quarter of communities with the highest chronic low-income rate among immigrants included the three largest immigrant-receiving cities: Montréal, Toronto, and Vancouver. Other than that, there was no stable pattern across years in the ranking of communities.
The pattern in 2012 was clear: the lowest chronic low-income rates among immigrants were found in the Prairies. The one-quarter of communities with the lowest chronic low-income rates among immigrants included: Winnipeg; the rest of Manitoba; Regina; the rest of Saskatchewan excluding Saskatoon; Calgary; Edmonton; and the rest of Alberta. All Prairie communities had rates below 5.7%, that is, one-half or less of the Canadian average of 12.3%. The lower rates observed for the Prairies may be related to better relative economic conditions in 2012, greater use of the Provincial Nominee Program, and the historically lower supply of immigrants in these communities. It should be noted, however, that these rankings were not static. In 2000, the one-quarter of communities with the lowest rates were largely in Ontario; Winnipeg and Regina were the only communities from the Prairies to make the list.
3.5 Do inherent differences among communities explain differences in low income among immigrants?
Economic conditions vary among cities/regions. Furthermore, differences in social assistance and other policy differences between provinces can affect the rates of low income in communities in different provinces. To “control” for such differences, the study turns to the comparison group (mainly Canadian-born). The chronic low-income rate for the comparison group acts as a control for economic and policy differences between cities/regions that affect chronic low-income rates.
In almost all communities, chronic low-income rates were lower among the comparison group than among immigrants in 2012, and a similar variation was observed among cities. Comparison group rates ranged from 1.3% in Edmonton to 6.0% in New Brunswick, a rate 4.6 times higher than the lowest rate (Table 7). However, the communities with the highest rates of chronic low income among immigrants were not necessarily those that had the higher rates overall (among the comparison group). This can be seen by comparing Tables 7 and 9.
For 2012, the correlation coefficient (R squared) between the immigrant and comparison group rates at the community level was only 0.06. That is, only 6% of the variation in the chronic low-income rates among immigrants can be accounted for by differences among communities in the comparison group rates.
Some of the differences in the chronic low-income rates among immigrants observed between communities were due to differences in immigrant background traits, such as language, years since immigration, and immigrant class, as noted earlier. To account for this possibility, the study uses the adjusted (predicted) chronic low-income rates among immigrants in Table 8 and compares them with the comparison group rates. The R squared increases as one would expect, but only to 0.14. The communities with low (or high) overall chronic low-income rates were not, for the most part, those with low (or high) immigrant chronic rates. Other unknown factors affect chronic low-income rates among immigrants in the communities.
This can be seen in the gap in the chronic rates between immigrants and comparison groups. If the immigrant rate mirrored the comparison group rate in most communities, there would be little variation in the gap between immigrants and comparison groups; most communities would have roughly the same value. However, that is not the case (Table 10-1, 10-2).
3.6 Community trends from 2000 to 2012
In the period from 2000 to 2012, the chronic low-income rate among immigrants in Canada peaked in 2004, at 16.3%, falling to 12.3% by 2012. Most communities followed this national trend. Only in Guelph and Windsor did rates rise, and the increases observed in those cities were small (Table 6-1). What set communities apart was the magnitude of the decline. The one-quarter of communities with the largest decline in chronic low-income rates included Québec City (where the rate in 2012 was only 37% of the rate at the peak), Manitoba excluding Winnipeg (27%), rural Saskatchewan (48%), Calgary (43%), Edmonton (42%), and rural Alberta (38%). Not surprisingly, with the exception of Québec City, the Prairie Provinces experienced the largest gains. Once again, this is likely related to rising labour demand and the use of the Provincial Nominee Program, among other factors.
The communities that saw little improvement in the chronic low-income rates among immigrants between 2000 and 2012 were virtually all located in southern Ontario, including Oshawa, Toronto, Hamilton, St. Catharines–Niagara, Kitchener, Guelph, London, and Windsor (Table 6-1). Over the same period, the share of new immigrants moving to Toronto and the surrounding regions declined significantly, while the share going to the Prairies increased (Bonikowska, Hou, and Picot 2017).
4. Conclusion
This study finds that between 2000 and 2012 “new” spells of low income among immigrants were more likely to be transient than chronic. Only about one-fifth of these spells lasted five years or more. This is consistent with earlier research on low-income dynamics. However, with respect to immigrants who were in low income in any given year, about one-half were in chronic low income while about one-third were in transient low income. When one includes spells of low income which became chronic in subsequent years, the share of immigrants in chronic low income in a given year rises to about two-thirds. Hence, at any point in time, chronic low income is a large component of overall low income among immigrants.
The chronic low-income rate among immigrants fell through most of the period from 2000 to 2012. This occurred within a context of declining low-income rates in Canada overall. However, rates fell faster among the Canadian-born. Consequently, chronic low-income rates of immigrants relative to the Canadian-born rose over the period, although not to the same extent among all immigrant groups. Notably, rates rose among immigrants in Canada for 16 to 20 years, and by 2012, there was little difference in the chronic low-income rates between recent and longer-tenured immigrants.
In 2012, the highest chronic low-income rates were observed among immigrants over 65. These high rates—30% among all immigrant seniorsNote 23 and over 50% among more recent immigrant seniors—were in sharp contrast to those observed among seniors in the comparison group (largely Canadian-born), where the rate was much lower (at about 2%). High chronic low-income rates were also observed among unattached immigrants and lone parents. As well, there were large differences in chronic rates by immigrant place of birth, even after adjusting for differences in other characteristics, such as official language and education at landing, years since immigration, immigrant class, age, and family type. Place of birth matters beyond the effect of these characteristics.
After adjusting for differences in other background characteristics, much of the language-at-landing effect disappeared. Differences in chronic low-income rates among education groups were relatively small by 2012, in part because chronic low income had risen between 2000 and 2012 among those with postgraduate degrees, while it had fallen among the less educated. As expected, the chronic low-income rate was lower among economic-class immigrants than among family-class immigrants or refugees, but the difference was not large. There was little difference in rates of chronic low income between female and male immigrants, particularly after adjusting for differences in background characteristics.
There was significant variation in the rates of chronic low income among the 29 cities/regions considered in the analysis. The highest and lowest rates differed by a factor of almost 5. Forty percent of this difference resulted from differences in immigrant background characteristics. The ranking of communities was not static but, rather, changed significantly between 2000 and 2012. Nevertheless, Canada’s three largest cities were among the one-quarter of communities with the highest rates of chronic low income in both 2000 and 2012. In 2000, the one-quarter of communities with the lowest immigrant chronic rates were largely in Ontario, but by 2012 they were all in the Prairies. The chronic low-income rates among the Canadian-born population (the comparison group) in a community acts as a control for economic and policy effects that influence the community’s rates of chronic low income among immigrants. However, the comparison group rates were not good predictors of the immigrant chronic rates at the city/region level. The analysis suggests that there are other unobserved factors, along with economic conditions, policy effects and immigrant background characteristics that contributed to the differences in chronic low-income rates among immigrants in various communities.
5. Charts and tables
Data table for Chart 1-1
| Province, region or city | MBM 2012 | Local LIM, 1993 to 2012 | Canadian-level LIM | Adjusted LIM |
|---|---|---|---|---|
| low-income cut-offs (dollars) | ||||
| N.L., other | 19,354 | 13,349 | 17,304 | 18,441 |
| P.E.I. | 18,727 | 15,367 | 17,304 | 17,843 |
| N.S. | 18,534 | 14,271 | 17,304 | 17,660 |
| N.B. | 19,016 | 14,523 | 17,304 | 18,119 |
| Que., other | 16,762 | 14,700 | 17,304 | 15,972 |
| Ont., other | 17,156 | 17,403 | 17,304 | 16,347 |
| Man., other | 17,221 | 14,352 | 17,304 | 16,409 |
| Sask., other | 17,806 | 15,162 | 17,304 | 16,966 |
| Alta., other | 18,918 | 18,596 | 17,304 | 18,025 |
| B.C., other | 18,723 | 17,030 | 17,304 | 17,840 |
| St. John's | 18,362 | 17,181 | 17,304 | 17,496 |
|
Note: LIM: Low Income Measure; MBM Market Based Measure. Sources: Statistics Canada, Longitudinal Administrative Data base and CANSIM tables 051-0001 and 051-0056. |
||||

Data table for Chart 1-2
| Region or city | MBM 2012 | Local LIM, 1993 to 2012 | Canadian-level LIM | Adjusted LIM |
|---|---|---|---|---|
| low-income cut-offs (dollars) | ||||
| Halifax | 18,573 | 17,973 | 17,304 | 17,697 |
| Moncton | 17,687 | 16,661 | 17,304 | 16,853 |
| Saint John | 17,671 | 16,573 | 17,304 | 16,838 |
| Saguenay Chicoutimi–Jonquière |
16,414 | 16,166 | 17,304 | 15,639 |
| Québec City | 16,558 | 17,378 | 17,304 | 15,777 |
| Sherbrooke | 16,414 | 15,367 | 17,304 | 15,639 |
| Trois-Rivières | 16,414 | 15,090 | 17,304 | 15,639 |
| Montréal | 17,124 | 16,201 | 17,304 | 16,316 |
| Ottawa–Gatineau | 18,970 | 21,026 | 17,304 | 18,075 |
| Kingston | 17,298 | 18,838 | 17,304 | 16,482 |
| Peterborough | 17,298 | 17,458 | 17,304 | 16,482 |
|
Note: LIM: Low Income Measure; MBM: Market Based Measure. Sources: Statistics Canada, Longitudinal Administrative Data base and CANSIM tables 051-0001 and 051-0056. |
||||
Data table for Chart 1-3
| Region or city | MBM 2012 | Local LIM, 1993 to 2012 | Canadian-level LIM | Adjusted LIM |
|---|---|---|---|---|
| low-income cut-offs (dollars) | ||||
| Oshawa | 17,298 | 20,774 | 17,304 | 16,482 |
| Toronto | 19,627 | 18,258 | 17,304 | 18,701 |
| Hamilton | 17,347 | 19,511 | 17,304 | 16,529 |
| St. Catharines–Niagara | 17,298 | 17,800 | 17,304 | 16,482 |
| Kitchener | 17,298 | 19,608 | 17,304 | 16,482 |
| Brantford | 17,298 | 17,541 | 17,304 | 16,482 |
| Guelph | 17,298 | 20,393 | 17,304 | 16,482 |
| London | 17,298 | 18,657 | 17,304 | 16,482 |
| Windsor | 17,298 | 19,468 | 17,304 | 16,482 |
| Barrie | 17,298 | 18,932 | 17,304 | 16,482 |
| Greater Sudbury | 17,298 | 18,818 | 17,304 | 16,482 |
|
Note: LIM: Low Income Measure; MBM: Market Based Measure. Sources: Statistics Canada, Longitudinal Administrative Data base and CANSIM tables 051-0001 and 051-0056. |
||||

Data table for Chart 1-4
| City | MBM 2012 | Local LIM, 1993 to 2012 | Canadian-level LIM | Adjusted LIM |
|---|---|---|---|---|
| low-income cut-offs (dollars) | ||||
| Thunder Bay | 17,298 | 19,045 | 17,304 | 16,482 |
| Winnipeg | 17,321 | 17,446 | 17,304 | 16,504 |
| Regina | 17,459 | 19,432 | 17,304 | 16,635 |
| Saskatoon | 18,154 | 18,219 | 17,304 | 17,297 |
| Calgary | 19,142 | 21,128 | 17,304 | 18,239 |
| Edmonton | 18,118 | 20,286 | 17,304 | 17,263 |
| Kelowna | 19,088 | 17,253 | 17,304 | 18,187 |
| Abbotsford | 19,088 | 16,351 | 17,304 | 18,187 |
| Vancouver | 19,262 | 17,530 | 17,304 | 18,354 |
| Victoria | 19,088 | 19,274 | 17,304 | 18,187 |
|
Note: LIM: Low Income Measure; MBM: Market Based Measure. Sources: Statistics Canada, Longitudinal Administrative Data base and CANSIM tables 051-0001 and 051-0056. |
||||
| Years since immigration | |||||
|---|---|---|---|---|---|
| 5 to 10 years | 11 to 15 years | 16 to 20 years | All 5 to 20 years | Comparison group | |
| rate | |||||
| Overall | |||||
| 2000 | 19.5 | 12.9 | 10.4 | 15.8 | 6.1 |
| 2001 | 19.8 | 12.8 | 10.8 | 16.0 | 5.7 |
| 2002 | 19.6 | 13.2 | 11.2 | 16.0 | 5.5 |
| 2003 | 19.3 | 14.6 | 12.0 | 16.2 | 5.4 |
| 2004 | 19.0 | 15.6 | 12.2 | 16.3 | 5.4 |
| 2005 | 17.6 | 15.2 | 11.5 | 15.3 | 5.1 |
| 2006 | 17.0 | 15.0 | 11.0 | 14.8 | 4.8 |
| 2007 | 16.0 | 14.2 | 10.7 | 13.9 | 4.5 |
| 2008 | 14.9 | 13.6 | 10.9 | 13.3 | 4.3 |
| 2009 | 14.3 | 13.0 | 11.0 | 12.9 | 4.1 |
| 2010 | 14.0 | 13.0 | 11.6 | 12.9 | 4.0 |
| 2011 | 13.7 | 12.6 | 11.8 | 12.8 | 4.0 |
| 2012 | 13.3 | 12.0 | 11.5 | 12.3 | 3.7 |
| Male | |||||
| 2000 | 16.9 | 10.5 | 7.4 | 13.1 | 4.9 |
| 2001 | 17.2 | 10.6 | 7.7 | 13.4 | 4.5 |
| 2002 | 17.1 | 10.9 | 8.3 | 13.4 | 4.4 |
| 2003 | 16.7 | 12.0 | 9.0 | 13.5 | 4.3 |
| 2004 | 16.5 | 13.3 | 9.7 | 13.9 | 4.3 |
| 2005 | 14.6 | 12.0 | 8.3 | 12.2 | 4.1 |
| 2006 | 14.3 | 11.8 | 8.1 | 11.8 | 3.8 |
| 2007 | 13.4 | 11.1 | 7.9 | 11.0 | 3.7 |
| 2008 | 12.4 | 10.6 | 8.2 | 10.5 | 3.5 |
| 2009 | 11.9 | 10.2 | 8.3 | 10.2 | 3.4 |
| 2010 | 12.3 | 11.1 | 9.5 | 11.0 | 3.5 |
| 2011 | 12.0 | 10.8 | 9.6 | 10.9 | 3.4 |
| 2012 | 11.6 | 10.4 | 9.5 | 10.6 | 3.3 |
| Female | |||||
| 2000 | 21.8 | 15.1 | 13.2 | 18.2 | 7.2 |
| 2001 | 21.9 | 14.9 | 13.4 | 18.3 | 6.7 |
| 2002 | 21.7 | 15.2 | 13.7 | 18.2 | 6.5 |
| 2003 | 21.4 | 16.9 | 14.5 | 18.5 | 6.4 |
| 2004 | 21.0 | 17.6 | 14.5 | 18.4 | 6.3 |
| 2005 | 20.1 | 17.9 | 14.2 | 18.0 | 6.0 |
| 2006 | 19.4 | 17.6 | 13.6 | 17.3 | 5.6 |
| 2007 | 18.3 | 16.6 | 13.2 | 16.3 | 5.3 |
| 2008 | 17.1 | 15.9 | 13.3 | 15.6 | 5.0 |
| 2009 | 16.3 | 15.3 | 13.3 | 15.1 | 4.6 |
| 2010 | 15.4 | 14.7 | 13.4 | 14.5 | 4.5 |
| 2011 | 15.2 | 14.1 | 13.6 | 14.3 | 4.4 |
| 2012 | 14.7 | 13.4 | 13.1 | 13.8 | 4.0 |
|
|||||
| Column 1 | Column 2 | Column 3 | Column 4 | Column 5 | Column 6 | Column 7 | |
|---|---|---|---|---|---|---|---|
| Total low-income rate | Chronic rate | Less chronic rate | Transient rate | Don't know | Column 2 as percentage of column 1 | Column 2 as percentage of columns 2 to 4 | |
| rate | percent | ||||||
| Landed 1 to 4 years | |||||||
| 2000 | 41.7 | Note ...: not applicable | Note ...: not applicable | Note ...: not applicable | Note ...: not applicable | Note ...: not applicable | Note ...: not applicable |
| 2003 | 42.7 | Note ...: not applicable | Note ...: not applicable | Note ...: not applicable | Note ...: not applicable | Note ...: not applicable | Note ...: not applicable |
| 2006 | 37.9 | Note ...: not applicable | Note ...: not applicable | Note ...: not applicable | Note ...: not applicable | Note ...: not applicable | Note ...: not applicable |
| 2009 | 34.3 | Note ...: not applicable | Note ...: not applicable | Note ...: not applicable | Note ...: not applicable | Note ...: not applicable | Note ...: not applicable |
| 2012 | 31.7 | Note ...: not applicable | Note ...: not applicable | Note ...: not applicable | Note ...: not applicable | Note ...: not applicable | Note ...: not applicable |
| Landed 5 to 10 years | |||||||
| 2000 | 37.5 | 17.8 | 5.7 | 8.5 | 5.4 | 47.4 | 55.5 |
| 2003 | 37.5 | 17.9 | 5.4 | 10.0 | 4.2 | 47.7 | 53.7 |
| 2006 | 32.6 | 15.7 | 4.7 | 7.9 | 4.3 | 48.2 | 55.5 |
| 2009 | 29.5 | 13.2 | 4.3 | 8.2 | 3.8 | 44.9 | 51.4 |
| 2012 | 27.5 | 12.2 | 4.2 | 7.8 | 3.3 | 44.4 | 50.4 |
| Landed 11 to 15 years | |||||||
| 2000 | 28.7 | 11.7 | 4.4 | 7.5 | 5.1 | 40.8 | 49.6 |
| 2003 | 30.2 | 13.4 | 4.5 | 8.2 | 4.2 | 44.2 | 51.4 |
| 2006 | 29.3 | 13.7 | 4.3 | 7.0 | 4.3 | 46.9 | 54.9 |
| 2009 | 27.2 | 12.0 | 4.0 | 7.5 | 3.7 | 44.2 | 51.1 |
| 2012 | 24.5 | 11.0 | 3.7 | 6.8 | 2.9 | 45.1 | 51.2 |
| Landed 16 to 20 years | |||||||
| 2000 | 24.3 | 9.5 | 3.6 | 7.2 | 3.9 | 39.3 | 46.7 |
| 2003 | 25.8 | 11.0 | 3.8 | 7.6 | 3.5 | 42.6 | 49.2 |
| 2006 | 23.0 | 10.0 | 3.2 | 6.0 | 3.9 | 43.5 | 52.3 |
| 2009 | 23.8 | 10.1 | 3.2 | 6.9 | 3.5 | 42.5 | 50.0 |
| 2012 | 23.4 | 10.6 | 3.3 | 6.7 | 2.8 | 45.2 | 51.3 |
| Landed 5 to 20 years | |||||||
| 2000 | 32.3 | 14.4 | 4.9 | 8.0 | 5.0 | 44.6 | 52.8 |
| 2003 | 32.7 | 14.9 | 4.8 | 8.9 | 4.1 | 45.7 | 52.3 |
| 2006 | 29.0 | 13.6 | 4.2 | 7.1 | 4.2 | 46.8 | 54.6 |
| 2009 | 26.9 | 11.8 | 3.9 | 7.6 | 3.7 | 44.0 | 50.9 |
| 2012 | 25.3 | 11.3 | 3.8 | 7.2 | 3.0 | 44.9 | 50.9 |
| Comparison group | |||||||
| 2000 | 15.0 | 5.7 | 2.0 | 4.9 | 2.4 | 37.8 | 45.0 |
| 2003 | 13.4 | 5.0 | 1.7 | 4.3 | 2.3 | 37.4 | 45.2 |
| 2006 | 11.7 | 4.4 | 1.5 | 3.5 | 2.3 | 37.3 | 46.4 |
| 2009 | 10.7 | 3.7 | 1.3 | 3.2 | 2.5 | 34.2 | 44.8 |
| 2012 | 10.6 | 3.3 | 1.2 | 3.0 | 3.1 | 30.7 | 43.7 |
... not applicable
Sources: Statistics Canada, Longitudinal Immigration Database and Longitudinal Administrative Data base. |
|||||||
| 2000 | 2006 | 2012 | |
|---|---|---|---|
| rate | |||
| Overall | 15.8 | 14.8 | 12.3 |
| Gender | |||
| Male | 13.1 | 11.8 | 10.6 |
| Female | 18.2 | 17.3 | 13.8 |
| Age | |||
| 25 to 34 | 12.0 | 9.8 | 8.0 |
| 35 to 44 | 12.9 | 12.6 | 9.8 |
| 45 to 54 | 12.8 | 12.7 | 11.2 |
| 55 to 64 | 21.4 | 17.5 | 14.7 |
| 65 and older | 36.2 | 35.6 | 30.5 |
| Family type | |||
| Unattached | 28.4 | 28.3 | 25.1 |
| Attached, no child | 15.8 | 14.5 | 12.3 |
| Attached, have a child or children | 11.2 | 10.8 | 9.0 |
| Lone parent | 27.3 | 24.7 | 19.8 |
| Official language at landing | |||
| English | 12.4 | 12.3 | 10.8 |
| French | 18.4 | 13.6 | 10.0 |
| Both | 11.7 | 9.3 | 7.3 |
| None | 20.0 | 18.6 | 15.7 |
| Education level at landing | |||
| Secondary or less | 18.7 | 17.4 | 14.6 |
| Trade, some postsecondary | 12.0 | 12.2 | 10.7 |
| University | 11.5 | 11.8 | 10.2 |
| Postgraduate | 8.2 | 10.6 | 10.8 |
| Immigrant class | |||
| Provincial Nominee Program | Note ...: not applicable | 4.2 | 5.9 |
| Other economic class | 12.3 | 12.3 | 10.2 |
| Family | 18.5 | 17.3 | 14.6 |
| Refugee | 16.4 | 16.1 | 14.5 |
| Other class | 17.6 | 14.8 | 12.9 |
| Place of birth | |||
| Northwestern Europe | 5.2 | 5.7 | 4.2 |
| Southeastern Europe | 10.0 | 9.0 | 8.3 |
| Africa | 19.3 | 17.2 | 12.7 |
| East Asia | 22.7 | 21.9 | 17.6 |
| South Asia | 22.3 | 21.1 | 18.5 |
| Southeast Asia | 14.6 | 14.1 | 11.8 |
| Other Asia | 27.5 | 23.0 | 19.8 |
| China | 25.1 | 21.5 | 17.1 |
| India | 15.8 | 12.6 | 10.4 |
| Philippines | 7.8 | 6.0 | 4.3 |
| OceaniaTable 3-1 Note 3 | 3.7 | 4.8 | 4.1 |
| Caribbean, Central and South America | 15.0 | 11.4 | 9.1 |
| Oceania, other | 13.4 | 10.4 | 7.6 |
| United States | 5.9 | 7.0 | 4.8 |
... not applicable
|
|||
| 2000 | 2006 | 2012 | |
|---|---|---|---|
| rate | |||
| Overall | 19.5 | 17.0 | 13.3 |
| Gender | |||
| Male | 16.9 | 14.3 | 11.6 |
| Female | 21.8 | 19.4 | 14.7 |
| Age | |||
| 25 to 34 | 13.8 | 11.2 | 8.6 |
| 35 to 44 | 15.3 | 13.1 | 9.3 |
| 45 to 54 | 17.8 | 16.6 | 12.0 |
| 55 to 64 | 29.7 | 25.7 | 19.2 |
| 65 and older | 51.3 | 58.4 | 56.3 |
| Family type | |||
| Unattached | 30.6 | 30.1 | 24.9 |
| Attached, no child | 22.1 | 19.5 | 17.6 |
| Attached, have a child or children | 14.7 | 13.3 | 9.4 |
| Lone parent | 31.3 | 26.7 | 20.3 |
| Official language at landing | |||
| English | 15.3 | 14.0 | 10.9 |
| French | 20.3 | 14.4 | 10.2 |
| Both | 14.3 | 8.6 | 6.8 |
| None | 25.6 | 22.9 | 20.3 |
| Education level at landing | |||
| Secondary or less | 23.9 | 23.1 | 18.3 |
| Trade, some postsecondary | 14.7 | 14.7 | 11.2 |
| University | 14.0 | 12.9 | 10.5 |
| Postgraduate | 10.3 | 11.6 | 10.9 |
| Immigrant class | |||
| Provincial Nominee Program | Note ...: not applicable | 4.2 | 6.1 |
| Other economic class | 15.9 | 14.3 | 10.3 |
| Family | 22.0 | 20.3 | 17.3 |
| Refugee | 22.3 | 20.8 | 16.0 |
| Other class | 19.1 | 20.1 | 19.5 |
| Place of birth | |||
| Northwestern Europe | 6.9 | 6.1 | 3.4 |
| Southeastern Europe | 11.7 | 11.3 | 10.5 |
| Africa | 24.1 | 17.3 | 11.4 |
| East Asia | 27.6 | 30.8 | 20.7 |
| South Asia | 24.3 | 24.2 | 20.7 |
| Southeast Asia | 19.3 | 15.6 | 11.7 |
| Other Asia | 33.5 | 28.1 | 22.9 |
| China | 28.6 | 20.8 | 19.0 |
| India | 17.3 | 11.8 | 12.0 |
| Philippines | 8.4 | 5.9 | 4.2 |
| OceaniaTable 3-2 Note 3 | 3.5 | 2.9 | 2.5 |
| Caribbean, Central and South America | 15.6 | 11.0 | 8.5 |
| Oceania, other | 15.4 | 11.4 | 7.7 |
| United States | 6.1 | 4.8 | 3.7 |
... not applicable
|
|||
| 2000 | 2006 | 2012 | |
|---|---|---|---|
| rate | |||
| Overall | 12.9 | 15.0 | 12.0 |
| Gender | |||
| Male | 10.5 | 11.8 | 10.4 |
| Female | 15.1 | 17.6 | 13.4 |
| Age | |||
| 25 to 34 | 10.8 | 10.2 | 8.6 |
| 35 to 44 | 11.2 | 13.1 | 10.4 |
| 45 to 54 | 10.0 | 12.6 | 11.3 |
| 55 to 64 | 16.9 | 17.9 | 14.4 |
| 65 and older | 26.8 | 30.4 | 24.2 |
| Family type | |||
| Unattached | 25.2 | 28.6 | 23.7 |
| Attached, no child | 10.8 | 13.8 | 10.3 |
| Attached, have a child or children | 8.7 | 10.7 | 9.6 |
| Lone parent | 25.5 | 25.7 | 19.8 |
| Official language at landing | |||
| English | 9.8 | 12.4 | 11.0 |
| French | 16.5 | 13.7 | 9.9 |
| Both | 9.8 | 10.4 | 7.6 |
| None | 16.3 | 18.9 | 14.0 |
| Education level at landing | |||
| Secondary or less | 15.3 | 17.3 | 13.9 |
| Trade, some postsecondary | 9.7 | 12.0 | 10.8 |
| University | 8.7 | 11.2 | 10.2 |
| Postgraduate | 6.3 | 9.6 | 10.9 |
| Immigrant class | |||
| Provincial Nominee Program | Note ...: not applicable | Note ...: not applicable | 4.0 |
| Other economic class | 9.7 | 12.4 | 10.6 |
| Family | 15.3 | 16.6 | 13.5 |
| Refugee | 14.2 | 16.6 | 14.0 |
| Other class | 13.6 | 15.4 | 15.0 |
| Place of birth | |||
| Northwestern Europe | 5.2 | 6.3 | 4.8 |
| Southeastern Europe | 8.4 | 8.3 | 7.7 |
| Africa | 13.9 | 19.7 | 13.3 |
| East Asia | 14.4 | 21.3 | 18.7 |
| South Asia | 17.4 | 18.7 | 19.0 |
| Southeast Asia | 14.8 | 15.1 | 11.1 |
| Other Asia | 21.7 | 23.2 | 18.6 |
| China | 20.2 | 23.9 | 14.0 |
| India | 14.6 | 13.6 | 9.5 |
| Philippines | 6.1 | 6.0 | 3.5 |
| OceaniaTable 3-3 Note 3 | 4.3 | 5.9 | 4.4 |
| Caribbean, Central and South America | 14.0 | 11.7 | 8.9 |
| Oceania, other | 11.3 | 10.2 | 6.8 |
| United States | 6.3 | 8.0 | 4.8 |
... not applicable
|
|||
| 2000 | 2006 | 2012 | |
|---|---|---|---|
| rate | |||
| Overall | 10.4 | 11.0 | 11.5 |
| Gender | |||
| Male | 7.4 | 8.1 | 9.5 |
| Female | 13.2 | 13.6 | 13.1 |
| Age | |||
| 25 to 34 | 6.5 | 5.9 | 6.4 |
| 35 to 44 | 8.9 | 10.7 | 10.2 |
| 45 to 54 | 6.9 | 8.7 | 10.4 |
| 55 to 64 | 10.0 | 10.2 | 12.5 |
| 65 and older | 24.0 | 25.5 | 20.6 |
| Family type | |||
| Unattached | 27.0 | 25.7 | 26.3 |
| Attached, no child | 6.6 | 7.9 | 8.0 |
| Attached, have a child or children | 5.4 | 6.7 | 7.8 |
| Lone parent | 21.3 | 21.3 | 19.3 |
| Official language at landing | |||
| English | 7.3 | 9.1 | 10.4 |
| French | 16.6 | 12.1 | 9.8 |
| Both | 6.8 | 9.1 | 8.5 |
| None | 12.8 | 13.0 | 13.2 |
| Education level at landing | |||
| Secondary or less | 12.2 | 12.5 | 12.5 |
| Trade, some postsecondary | 7.4 | 8.7 | 10.1 |
| University | 5.1 | 8.1 | 9.4 |
| Postgraduate | 3.5 | 6.8 | 9.8 |
| Immigrant class | |||
| Provincial Nominee Program | Note ...: not applicable | Note ...: not applicable | 1.1 |
| Other economic class | 6.6 | 8.2 | 9.7 |
| Family | 13.9 | 14.1 | 12.7 |
| Refugee | 10.1 | 11.0 | 12.4 |
| Other class | 8.3 | 11.5 | 12.5 |
| Place of birth | |||
| Northwestern Europe | 4.0 | 4.7 | 4.8 |
| Southeastern Europe | 8.2 | 6.9 | 6.8 |
| Africa | 9.5 | 12.9 | 14.7 |
| East Asia | 11.2 | 12.0 | 15.9 |
| South Asia | 13.7 | 15.6 | 15.0 |
| Southeast Asia | 10.9 | 12.7 | 12.1 |
| Other Asia | 13.0 | 15.4 | 16.8 |
| China | 16.8 | 18.8 | 18.0 |
| India | 13.6 | 12.8 | 9.0 |
| Philippines | 7.9 | 6.0 | 4.7 |
| OceaniaTable 3-4 Note 3 | 3.7 | 6.1 | 6.3 |
| Caribbean, Central and South America | 15.1 | 11.2 | 9.7 |
| Oceania, other | 10.8 | 9.9 | 7.9 |
| United States | 5.4 | 8.2 | 6.6 |
... not applicable
|
|||
| 2000 | 2006 | 2012 | |
|---|---|---|---|
| rate | |||
| Overall | 6.1 | 4.8 | 3.7 |
| Gender | |||
| Male | 4.9 | 3.8 | 3.3 |
| Female | 7.2 | 5.6 | 4.0 |
| Age | |||
| 25 to 34 | 6.6 | 4.6 | 3.8 |
| 35 to 44 | 6.3 | 5.1 | 4.0 |
| 45 to 54 | 5.5 | 4.6 | 4.3 |
| 55 to 64 | 7.4 | 5.8 | 5.1 |
| 65 and older | 5.1 | 4.0 | 1.9 |
| Family type | |||
| Unattached | 13.7 | 11.4 | 9.0 |
| Attached, no child | 2.1 | 1.8 | 1.3 |
| Attached, have a child or children | 3.2 | 2.0 | 1.5 |
| Lone parent | 16.8 | 13.2 | 10.0 |
|
|||
| Sample size | Distribution | Predicted rate | |
|---|---|---|---|
| thousands | percent | rate | |
| Overall | 2,085 | 100.0 | 12.3 |
| Gender | |||
| Male | 951 | 45.6 | 11.4 |
| Female | 1,134 | 54.4 | 13.1 |
| Age | |||
| 25 to 34 | 393 | 18.8 | 6.9 |
| 35 to 44 | 666 | 31.9 | 10.5 |
| 45 to 54 | 578 | 27.7 | 12.6 |
| 55 to 64 | 262 | 12.6 | 15.4 |
| 65 and older | 186 | 8.9 | 24.9 |
| Family type | |||
| Unattached | 258 | 12.4 | 21.9 |
| Attached, no child | 404 | 19.4 | 10.0 |
| Attached, have a child or children | 1,286 | 61.7 | 10.0 |
| Lone parent | 138 | 6.6 | 21.5 |
| Official language at landing | |||
| English | 1,097 | 52.6 | 11.7 |
| French | 98 | 4.7 | 11.4 |
| Both | 131 | 6.3 | 9.4 |
| None | 758 | 36.4 | 13.6 |
| Education level at landing | |||
| Secondary or less | 940 | 45.1 | 13.2 |
| Trade, some postsecondary | 443 | 21.3 | 11.6 |
| University | 505 | 24.2 | 11.5 |
| Postgraduate | 196 | 9.4 | 11.8 |
| Immigrant class | |||
| Provincial Nominee Program | 29 | 1.4 | 10.0 |
| Other economic class | 985 | 47.2 | 11.5 |
| Family | 713 | 34.2 | 13.6 |
| Refugee | 293 | 14.0 | 12.4 |
| Other class | 65 | 3.1 | 11.4 |
| Place of birth | |||
| Northwestern Europe | 89 | 4.3 | 6.1 |
| Southeastern Europe | 280 | 13.4 | 8.7 |
| Africa | 184 | 8.8 | 14.3 |
| East Asia | 174 | 8.3 | 18.5 |
| South Asia | 186 | 8.9 | 18.9 |
| Southeast Asia | 63 | 3.0 | 10.3 |
| Other Asia | 161 | 7.7 | 19.6 |
| China | 278 | 13.3 | 14.5 |
| India | 253 | 12.1 | 10.0 |
| Philippines | 159 | 7.6 | 4.6 |
| OceaniaTable 5 Note 3 | 6 | 0.3 | 6.0 |
| Caribbean, Central and South America | 210 | 10.1 | 8.3 |
| Oceania, other | 11 | 0.5 | 8.0 |
| United States | 30 | 1.5 | 5.9 |
| Year since immigration | |||
| 5 to 10 years | 807 | 38.7 | 15.8 |
| 11 to 15 years | 603 | 28.9 | 12.0 |
| 16 to 20 years | 675 | 32.4 | 9.5 |
Source: Statistics Canada, Longitudinal Immigration Database. |
|||
| 2000 | 2002 | 2004 | 2006 | 2008 | 2010 | 2012 | |
|---|---|---|---|---|---|---|---|
| rate | |||||||
| Newfoundland and Labrador | 9.7 | 11.8 | 14.5 | 13.1 | 10.0 | 10.2 | 9.0 |
| Prince Edward Island | 13.4 | 11.9 | 13.0 | 9.4 | 10.2 | 8.8 | 9.4 |
| Nova Scotia | 16.6 | 17.7 | 18.9 | 17.5 | 16.4 | 15.7 | 14.5 |
| New Brunswick | 11.5 | 10.2 | 12.3 | 10.9 | 9.7 | 8.9 | 9.1 |
| Québec City | 15.4 | 13.3 | 13.3 | 10.6 | 8.7 | 7.3 | 5.8 |
| Sherbrooke | 15.9 | 14.7 | 13.4 | 12.0 | 10.0 | 10.8 | 10.3 |
| Montréal | 19.9 | 18.3 | 18.0 | 15.2 | 13.4 | 12.6 | 10.4 |
| Quebec, other | 10.8 | 10.4 | 11.3 | 9.2 | 7.4 | 7.4 | 6.4 |
| Ottawa–Gatineau | 18.0 | 16.7 | 16.8 | 15.8 | 14.3 | 13.4 | 12.3 |
| Oshawa | 7.0 | 7.2 | 8.8 | 8.2 | 6.5 | 7.1 | 6.9 |
| Toronto | 16.0 | 15.7 | 16.1 | 15.1 | 14.7 | 14.9 | 14.9 |
| Hamilton | 9.6 | 10.3 | 11.0 | 10.4 | 9.8 | 9.7 | 9.3 |
| St. Catharines–Niagara | 8.2 | 8.6 | 10.0 | 9.4 | 8.9 | 8.9 | 9.6 |
| Kitchener | 7.2 | 7.3 | 8.2 | 7.0 | 6.7 | 6.9 | 7.2 |
| Guelph | 5.3 | 5.0 | 5.8 | 5.5 | 5.3 | 5.9 | 6.2 |
| London | 13.6 | 13.3 | 14.3 | 12.5 | 11.6 | 11.6 | 12.0 |
| Windsor | 12.3 | 13.2 | 15.4 | 15.2 | 15.5 | 16.3 | 16.2 |
| Ontario, other | 7.4 | 7.8 | 9.1 | 7.8 | 6.7 | 6.9 | 6.5 |
| Winnipeg | 8.4 | 8.1 | 8.5 | 7.7 | 6.5 | 6.1 | 5.1 |
| Manitoba, other | 10.8 | 10.8 | 10.8 | 8.3 | 5.5 | 4.5 | 3.1 |
| Regina | 8.9 | 10.2 | 9.7 | 8.3 | 8.0 | 6.6 | 5.5 |
| Saskatoon | 12.0 | 12.0 | 13.4 | 10.6 | 9.4 | 7.8 | 6.5 |
| Saskatchewan, other | 13.2 | 13.1 | 15.4 | 12.0 | 8.2 | 6.6 | 4.6 |
| Calgary | 11.8 | 11.0 | 10.9 | 7.8 | 6.4 | 5.9 | 5.6 |
| Edmonton | 11.4 | 10.2 | 9.5 | 7.0 | 5.4 | 5.1 | 4.9 |
| Alberta, other | 9.6 | 8.9 | 9.2 | 6.7 | 4.8 | 4.1 | 3.7 |
| Vancouver | 20.6 | 22.9 | 23.1 | 21.4 | 17.1 | 16.0 | 15.2 |
| Victoria | 11.3 | 12.2 | 13.5 | 12.2 | 8.9 | 8.7 | 8.4 |
| British Columbia, other | 12.2 | 12.7 | 13.3 | 11.8 | 8.5 | 7.9 | 7.1 |
|
|||||||
| 2000 | 2002 | 2004 | 2006 | 2008 | 2010 | 2012 | |
|---|---|---|---|---|---|---|---|
| rate | |||||||
| Newfoundland and Labrador | 10.3 | 15.3 | 16.7 | 11.5 | 11.2 | 10.8 | 9.8 |
| Prince Edward Island | 16.9 | 15.6 | 12.7 | 6.3 | 10.0 | 8.1 | 9.3 |
| Nova Scotia | 24.5 | 26.5 | 24.3 | 19.6 | 17.4 | 14.9 | 13.5 |
| New Brunswick | 12.7 | 11.0 | 11.0 | 10.1 | 9.3 | 9.1 | 9.0 |
| Québec City | 17.4 | 14.3 | 14.0 | 11.0 | 8.9 | 6.7 | 4.7 |
| Sherbrooke | 17.7 | 16.1 | 14.1 | 15.1 | 11.9 | 12.5 | 11.6 |
| Montréal | 23.1 | 20.9 | 19.3 | 16.3 | 13.6 | 12.2 | 10.4 |
| Quebec, other | 12.1 | 11.9 | 10.7 | 8.7 | 7.5 | 7.1 | 6.0 |
| Ottawa–Gatineau | 22.3 | 20.1 | 17.5 | 17.3 | 16.5 | 15.2 | 13.9 |
| Oshawa | 11.4 | 11.9 | 11.8 | 11.8 | 8.8 | 9.5 | 8.8 |
| Toronto | 19.4 | 18.9 | 18.5 | 17.5 | 17.0 | 16.9 | 17.4 |
| Hamilton | 12.2 | 13.7 | 14.2 | 14.5 | 13.0 | 13.0 | 12.3 |
| St. Catharines–Niagara | 10.7 | 11.6 | 12.9 | 13.2 | 13.1 | 12.2 | 11.5 |
| Kitchener | 9.5 | 9.8 | 9.7 | 9.0 | 9.0 | 9.1 | 10.1 |
| Guelph | 7.2 | 5.9 | 7.1 | 8.4 | 7.0 | 7.0 | 8.2 |
| London | 19.2 | 21.0 | 20.4 | 17.7 | 16.5 | 15.1 | 14.5 |
| Windsor | 16.4 | 17.6 | 18.4 | 18.3 | 19.8 | 21.0 | 20.4 |
| Ontario, other | 10.1 | 11.0 | 11.6 | 10.0 | 8.4 | 7.7 | 7.6 |
| Winnipeg | 10.8 | 10.7 | 10.5 | 9.0 | 7.6 | 6.3 | 5.2 |
| Manitoba, other | 15.3 | 14.8 | 14.4 | 9.2 | 5.2 | 3.9 | 3.0 |
| Regina | 11.9 | 13.7 | 9.1 | 8.0 | 9.0 | 8.3 | 6.4 |
| Saskatoon | 14.0 | 13.9 | 15.5 | 11.2 | 10.5 | 8.7 | 6.8 |
| Saskatchewan, other | 17.6 | 15.8 | 14.6 | 12.5 | 8.6 | 6.3 | 4.0 |
| Calgary | 15.5 | 13.8 | 12.7 | 9.3 | 7.2 | 6.4 | 6.1 |
| Edmonton | 16.0 | 14.2 | 12.3 | 8.8 | 6.5 | 5.6 | 5.4 |
| Alberta, other | 12.6 | 11.2 | 10.3 | 7.1 | 5.0 | 3.7 | 3.5 |
| Vancouver | 23.9 | 26.8 | 26.5 | 24.1 | 18.9 | 17.0 | 16.1 |
| Victoria | 13.8 | 15.1 | 15.0 | 14.3 | 9.7 | 9.3 | 7.9 |
| British Columbia, other | 13.7 | 13.6 | 13.7 | 11.3 | 9.0 | 7.4 | 6.6 |
|
|||||||
| 2000 | 2002 | 2004 | 2006 | 2008 | 2010 | 2012 | |
|---|---|---|---|---|---|---|---|
| rate | |||||||
| Newfoundland and Labrador | 9.6 | 10.3 | 14.6 | 14.6 | 9.8 | 10.9 | 9.2 |
| Prince Edward Isalnd | 14.2 | 10.9 | 15.9 | 14.3 | 11.1 | 8.6 | 7.7 |
| Nova Scotia | 11.7 | 11.9 | 17.9 | 19.7 | 18.5 | 18.7 | 15.8 |
| New Brunswick | 11.6 | 9.3 | 15.5 | 12.4 | 10.5 | 9.3 | 10.0 |
| Québec City | 14.3 | 12.2 | 12.9 | 10.4 | 8.7 | 8.0 | 7.4 |
| Sherbrooke | 12.2 | 12.9 | 12.6 | 8.1 | 8.0 | 9.5 | 10.7 |
| Montréal | 17.9 | 17.1 | 18.4 | 15.5 | 13.8 | 12.8 | 10.8 |
| Quebec, other | 10.0 | 9.8 | 12.6 | 10.1 | 7.2 | 7.3 | 6.6 |
| Ottawa–Gatineau | 15.2 | 15.4 | 18.1 | 16.4 | 13.3 | 11.8 | 11.4 |
| Oshawa | 4.5 | 5.0 | 8.4 | 8.0 | 6.6 | 6.5 | 6.6 |
| Toronto | 12.6 | 12.9 | 15.4 | 15.0 | 14.4 | 14.3 | 13.9 |
| Hamilton | 8.8 | 8.0 | 9.9 | 9.6 | 9.7 | 8.9 | 8.7 |
| St. Catharines–Niagara | 7.6 | 6.8 | 9.2 | 7.8 | 7.9 | 9.3 | 9.7 |
| Kitchener | 5.8 | 5.8 | 8.0 | 6.7 | 5.9 | 5.8 | 6.2 |
| Guelph | 3.7 | 4.2 | 5.6 | 4.7 | 5.5 | 6.2 | 5.9 |
| London | 10.2 | 10.0 | 13.0 | 12.3 | 11.5 | 11.9 | 12.5 |
| Windsor | 7.8 | 9.7 | 14.8 | 15.5 | 14.2 | 15.6 | 15.8 |
| Ontario, other | 6.8 | 6.5 | 8.9 | 8.2 | 7.3 | 7.6 | 6.5 |
| Winnipeg | 7.6 | 6.2 | 7.7 | 7.9 | 6.5 | 6.5 | 5.4 |
| Manitoba, other | 9.3 | 8.0 | 9.6 | 10.0 | 6.7 | 5.1 | 2.7 |
| Regina | 6.9 | 7.9 | 11.1 | 8.8 | 7.5 | 5.7 | 3.9 |
| Saskatoon | 13.1 | 11.1 | 11.7 | 11.3 | 9.6 | 7.0 | 6.6 |
| Saskatchewan, other | 12.7 | 13.1 | 18.7 | 13.1 | 7.7 | 7.2 | 4.3 |
| Calgary | 10.2 | 8.8 | 10.0 | 7.4 | 6.2 | 5.8 | 5.4 |
| Edmonton | 9.5 | 8.0 | 9.0 | 7.2 | 5.2 | 5.0 | 4.7 |
| Alberta, other | 8.6 | 8.3 | 9.2 | 7.2 | 4.8 | 4.4 | 4.0 |
| Vancouver | 17.1 | 18.3 | 21.1 | 21.6 | 18.0 | 16.6 | 14.8 |
| Victoria | 10.5 | 10.5 | 13.0 | 12.2 | 9.9 | 9.7 | 8.3 |
| British Columbia, other | 12.3 | 12.1 | 13.1 | 13.0 | 9.0 | 8.8 | 7.5 |
|
|||||||
| 2000 | 2002 | 2004 | 2006 | 2008 | 2010 | 2012 | |
|---|---|---|---|---|---|---|---|
| rate | |||||||
| Newfoundland and Labrador | 8.8 | 7.5 | 11.1 | 13.9 | 8.5 | 8.6 | 7.1 |
| Prince Edward Isalnd | 8.9 | 9.3 | 10.2 | 8.6 | 9.8 | 10.1 | 11.7 |
| Nova Scotia | 8.6 | 8.0 | 10.6 | 11.5 | 12.4 | 14.0 | 14.8 |
| New Brunswick | 10.3 | 10.1 | 10.2 | 10.6 | 9.6 | 8.2 | 8.1 |
| Québec City | 12.1 | 12.5 | 12.1 | 10.1 | 8.3 | 8.2 | 6.4 |
| Sherbrooke | 14.5 | 12.0 | 12.2 | 9.1 | 8.7 | 8.2 | 7.0 |
| Montréal | 15.1 | 14.6 | 15.1 | 13.3 | 12.7 | 13.0 | 10.1 |
| Quebec, other | 9.7 | 8.5 | 10.8 | 9.3 | 7.5 | 8.2 | 7.2 |
| Ottawa–Gatineau | 10.2 | 10.4 | 12.7 | 12.5 | 12.8 | 12.8 | 11.5 |
| Oshawa | 3.8 | 4.0 | 6.0 | 5.2 | 4.6 | 5.4 | 5.5 |
| Toronto | 10.9 | 11.6 | 12.4 | 11.4 | 12.0 | 13.0 | 13.2 |
| Hamilton | 5.1 | 6.8 | 7.6 | 6.2 | 6.5 | 7.1 | 6.7 |
| St. Catharines–Niagara | 4.8 | 5.8 | 6.9 | 6.4 | 5.7 | 5.2 | 7.0 |
| Kitchener | 4.0 | 4.8 | 5.9 | 4.9 | 4.8 | 5.1 | 4.8 |
| Guelph | 2.5 | 4.5 | 4.1 | 2.8 | 3.3 | 4.5 | 4.2 |
| London | 5.9 | 6.5 | 9.0 | 7.9 | 7.7 | 8.0 | 8.3 |
| Windsor | 6.0 | 6.3 | 9.0 | 8.6 | 11.1 | 11.8 | 12.6 |
| Ontario, other | 4.9 | 5.6 | 6.8 | 5.5 | 4.7 | 5.5 | 5.3 |
| Winnipeg | 6.2 | 7.2 | 7.6 | 6.3 | 5.5 | 5.7 | 4.7 |
| Manitoba, other | 8.1 | 8.7 | 6.3 | 4.4 | 4.9 | 5.5 | 3.9 |
| Regina | 6.3 | 7.8 | 8.4 | 8.2 | 7.1 | 4.5 | 5.4 |
| Saskatoon | 8.8 | 9.3 | 11.8 | 8.4 | 7.1 | 6.8 | 5.5 |
| Saskatchewan, other | 8.8 | 8.8 | 12.4 | 9.9 | 8.2 | 6.6 | 6.6 |
| Calgary | 7.2 | 8.0 | 8.8 | 5.8 | 5.2 | 5.1 | 5.1 |
| Edmonton | 6.4 | 6.4 | 6.4 | 4.8 | 4.4 | 4.4 | 4.3 |
| Alberta, other | 6.8 | 5.7 | 7.4 | 5.6 | 4.5 | 4.4 | 3.6 |
| Vancouver | 13.9 | 16.1 | 17.1 | 15.8 | 13.5 | 14.4 | 14.6 |
| Victoria | 8.4 | 9.3 | 11.8 | 9.7 | 7.1 | 7.4 | 9.0 |
| British Columbia, other | 9.8 | 11.6 | 12.8 | 10.9 | 7.4 | 7.7 | 7.5 |
|
|||||||
| 2000 | 2002 | 2004 | 2006 | 2008 | 2010 | 2012 | |
|---|---|---|---|---|---|---|---|
| rate | |||||||
| Newfoundland and Labrador | 15.2 | 13.3 | 12.1 | 10.4 | 8.4 | 6.5 | 5.7 |
| Prince Edward Isalnd | 8.2 | 7.0 | 6.4 | 5.6 | 5.1 | 4.4 | 4.1 |
| Nova Scotia | 10.0 | 8.9 | 8.2 | 7.3 | 6.8 | 6.2 | 5.8 |
| New Brunswick | 10.8 | 10.1 | 9.3 | 8.2 | 7.1 | 6.4 | 6.0 |
| Québec City | 5.4 | 4.8 | 4.3 | 3.8 | 3.4 | 3.0 | 2.3 |
| Sherbrooke | 6.8 | 6.1 | 5.5 | 4.7 | 4.5 | 4.3 | 3.8 |
| Montréal | 6.2 | 5.3 | 5.1 | 4.6 | 4.4 | 4.5 | 3.6 |
| Quebec, other | 7.0 | 6.2 | 5.7 | 5.1 | 4.8 | 4.4 | 3.6 |
| Ottawa–Gatineau | 5.0 | 4.4 | 4.4 | 4.0 | 3.7 | 3.5 | 3.0 |
| Oshawa | 2.8 | 2.8 | 2.8 | 2.4 | 2.3 | 2.3 | 2.1 |
| Toronto | 4.9 | 4.6 | 4.9 | 4.8 | 4.6 | 4.7 | 4.8 |
| Hamilton | 3.1 | 3.1 | 3.2 | 3.0 | 2.8 | 2.8 | 2.6 |
| St. Catharines–Niagara | 3.3 | 3.2 | 3.3 | 3.3 | 3.0 | 3.0 | 3.0 |
| Kitchener | 2.3 | 2.2 | 2.5 | 2.3 | 2.1 | 2.1 | 2.1 |
| Guelph | 2.2 | 2.3 | 2.5 | 2.2 | 2.1 | 2.2 | 2.2 |
| London | 3.8 | 3.7 | 3.9 | 3.7 | 3.4 | 3.1 | 3.0 |
| Windsor | 2.9 | 3.0 | 3.3 | 3.3 | 3.3 | 3.5 | 3.6 |
| Ontario, other | 4.2 | 4.0 | 4.0 | 3.7 | 3.3 | 3.1 | 3.0 |
| Winnipeg | 5.5 | 5.0 | 5.1 | 4.5 | 4.0 | 3.7 | 3.5 |
| Manitoba, other | 11.4 | 10.0 | 9.5 | 9.3 | 8.4 | 8.0 | 7.8 |
| Regina | 5.5 | 5.2 | 5.0 | 4.3 | 3.6 | 2.6 | 2.3 |
| Saskatoon | 6.6 | 6.2 | 6.0 | 5.1 | 3.8 | 2.6 | 2.3 |
| Saskatchewan, other | 10.4 | 9.4 | 9.1 | 8.2 | 6.7 | 5.1 | 4.7 |
| Calgary | 3.4 | 2.9 | 2.9 | 2.1 | 1.7 | 1.8 | 1.5 |
| Edmonton | 4.2 | 3.6 | 3.2 | 2.5 | 2.0 | 1.8 | 1.3 |
| Alberta, other | 6.5 | 5.4 | 4.9 | 3.6 | 3.1 | 2.8 | 2.3 |
| Vancouver | 6.1 | 6.2 | 6.1 | 5.6 | 4.7 | 4.6 | 4.7 |
| Victoria | 5.7 | 5.6 | 5.4 | 4.8 | 3.9 | 3.6 | 3.5 |
| British Columbia, other | 7.4 | 7.3 | 7.0 | 6.0 | 4.8 | 4.5 | 4.5 |
|
|||||||
| Sample size | Distribution | Predicted rate | |
|---|---|---|---|
| thousands | percent | rate | |
| Overall | 2,085 | 100.0 | 12.3 |
| Newfoundland and Labrador | 2 | 0.1 | 10.7 |
| Prince Edward Isalnd | 1 | 0.0 | 11.6 |
| Nova Scotia | 10 | 0.5 | 16.2 |
| New Brunswick | 5 | 0.2 | 11.7 |
| Québec City | 11 | 0.5 | 8.4 |
| Sherbrooke | 4 | 0.2 | 13.1 |
| Montréal | 252 | 12.1 | 11.7 |
| Quebec, other | 13 | 0.6 | 9.7 |
| Ottawa–Gatineau | 69 | 3.3 | 12.1 |
| Oshawa | 12 | 0.6 | 8.2 |
| Toronto | 890 | 42.7 | 14.1 |
| Hamilton | 38 | 1.8 | 10.1 |
| St. Catharines–Niagara | 11 | 0.5 | 11.0 |
| Kitchener | 31 | 1.5 | 8.2 |
| Guelph | 8 | 0.4 | 6.9 |
| London | 19 | 0.9 | 12.3 |
| Windsor | 21 | 1.0 | 15.0 |
| Ontario, other | 37 | 1.8 | 8.6 |
| Winnipeg | 32 | 1.6 | 7.0 |
| Manitoba, other | 7 | 0.3 | 5.3 |
| Regina | 5 | 0.3 | 5.8 |
| Saskatoon | 8 | 0.4 | 6.6 |
| Saskatchewan, other | 4 | 0.2 | 5.9 |
| Calgary | 110 | 5.3 | 6.0 |
| Edmonton | 67 | 3.2 | 5.4 |
| Alberta, other | 23 | 1.1 | 5.0 |
| Vancouver | 344 | 16.5 | 13.9 |
| Victoria | 11 | 0.5 | 9.2 |
| British Columbia, other | 41 | 2.0 | 8.7 |
Source: Statistics Canada, Longitudinal Immigration Database. |
|||
| 2000 | |
|---|---|
| rate | |
| First quartile | |
| Vancouver | 20.6 |
| Montréal | 19.9 |
| Ottawa–Gatineau | 18.0 |
| Nova Scotia | 16.6 |
| Toronto | 16.0 |
| Sherbrooke | 15.9 |
| Québec City | 15.4 |
| Second quartile | |
| London | 13.6 |
| Prince Edward Island | 13.4 |
| Saskatchewan, other | 13.2 |
| Windsor | 12.3 |
| British Columbia, other | 12.2 |
| Saskatoon | 12.0 |
| Calgary | 11.8 |
| Third quartile | |
| New Brunswick | 11.5 |
| Edmonton | 11.4 |
| Victoria | 11.3 |
| Manitoba, other | 10.8 |
| Quebec, other | 10.8 |
| Newfoundland and Labrador | 9.7 |
| Hamilton | 9.6 |
| Alberta, other | 9.6 |
| Fourth quartile | |
| Regina | 8.9 |
| Winnipeg | 8.4 |
| St. Catharines–Niagara | 8.2 |
| Ontario, other | 7.4 |
| Kitchener | 7.2 |
| Oshawa | 7.0 |
| Guelph | 5.3 |
|
|
| 2012 | |
|---|---|
| rate | |
| First quartile | |
| Windsor | 16.2 |
| Vancouver | 15.2 |
| Toronto | 14.9 |
| Nova Scotia | 14.5 |
| Ottawa–Gatineau | 12.3 |
| London | 12.0 |
| Montréal | 10.4 |
| Second quartile | |
| Sherbrooke | 10.3 |
| St. Catharines–Niagara | 9.6 |
| Prince Edward Isalnd | 9.4 |
| Hamilton | 9.3 |
| New Brunswick | 9.1 |
| Newfoundland and Labrador | 9.0 |
| Victoria | 8.4 |
| Third quartile | |
| Kitchener | 7.2 |
| British Columbia, other | 7.1 |
| Oshawa | 6.9 |
| Ontario, other | 6.5 |
| Saskatoon | 6.5 |
| Quebec, other | 6.4 |
| Guelph | 6.2 |
| Québec City | 5.8 |
| Fourth quartile | |
| Calgary | 5.6 |
| Regina | 5.5 |
| Winnipeg | 5.1 |
| Edmonton | 4.9 |
| Saskatchewan, other | 4.6 |
| Alberta, other | 3.7 |
| Manitoba, other | 3.1 |
|
|
| 2000 | |
|---|---|
| rate | |
| First quartile | |
| Windsor | 4.2 |
| Ottawa–Gatineau | 3.6 |
| London | 3.6 |
| Calgary | 3.5 |
| Vancouver | 3.4 |
| Toronto | 3.2 |
| Montréal | 3.2 |
| Second quartile | |
| Hamilton | 3.1 |
| Kitchener | 3.0 |
| Québec City | 2.9 |
| Edmonton | 2.7 |
| Oshawa | 2.5 |
| St. Catharines–Niagara | 2.5 |
| Guelph | 2.4 |
| Third quartile | |
| Sherbrooke | 2.3 |
| Victoria | 2.0 |
| Saskatoon | 1.8 |
| Ontario, other | 1.7 |
| Nova Scotia | 1.7 |
| British Columbia, other | 1.6 |
| Prince Edward Isalnd | 1.6 |
| Regina | 1.6 |
| Fourth quartile | |
| Winnipeg | 1.5 |
| Quebec, other | 1.5 |
| Alberta, other | 1.5 |
| Saskatchewan, other | 1.3 |
| New Brunswick | 1.1 |
| Manitoba, other | 0.9 |
| Newfoundland and Labrador | 0.6 |
|
|
| 2012 | |
|---|---|
| rate | |
| First quartile | |
| Windsor | 4.5 |
| Ottawa–Gatineau | 4.1 |
| London | 3.9 |
| Calgary | 3.8 |
| Edmonton | 3.7 |
| Hamilton | 3.5 |
| Kitchener | 3.4 |
| Second quartile | |
| Oshawa | 3.3 |
| Vancouver | 3.3 |
| St. Catharines–Niagara | 3.2 |
| Toronto | 3.1 |
| Montréal | 2.9 |
| Guelph | 2.9 |
| Saskatoon | 2.8 |
| Third quartile | |
| Sherbrooke | 2.7 |
| Québec City | 2.5 |
| Nova Scotia | 2.5 |
| Regina | 2.5 |
| Victoria | 2.4 |
| Prince Edward Isalnd | 2.3 |
| Ontario, other | 2.2 |
| Quebec, other | 1.8 |
| Fourth quartile | |
| British Columbia, other | 1.6 |
| Alberta, other | 1.6 |
| Newfoundland and Labrador | 1.6 |
| New Brunswick | 1.5 |
| Winnipeg | 1.4 |
| Saskatchewan, other | 1.0 |
| Manitoba, other | 0.4 |
|
|
| Regression results | Observations | ||
|---|---|---|---|
| coefficient | standard error | numberTable 11-1 Note 3 | |
| Year since immigration | |||
| 5 to 10 years (reference group) | Note ...: not applicable | Note ...: not applicable | 806,500 |
| 11 to 15 years | -0.362 | 0.006 | 603,400 |
| 16 to 20 years | -0.643 | 0.006 | 674,800 |
| Age | |||
| 25 to 34 | -0.488 | 0.008 | 392,700 |
| 35 to 44 (reference group) | Note ...: not applicable | Note ...: not applicable | 665,900 |
| 45 to 54 | 0.223 | 0.006 | 578,300 |
| 55 to 64 | 0.479 | 0.008 | 262,000 |
| 65 and older | 1.144 | 0.008 | 185,700 |
| Gender | |||
| Male (reference group) | Note ...: not applicable | Note ...: not applicable | 950,900 |
| Female | 0.180 | 0.005 | 1,133,900 |
| Family type | |||
| Unattached | 1.012 | 0.006 | 257,700 |
| Attached, no child | -0.002 | 0.007 | 403,600 |
| Attached, have a child or children (reference group) | Note ...: not applicable | Note ...: not applicable | 1,285,700 |
| Lone parent | 0.981 | 0.008 | 137,700 |
| Official language at landing | |||
| English (reference group) | Note ...: not applicable | Note ...: not applicable | 1,097,200 |
| French | -0.030 | 0.014 | 98,500 |
| Both | -0.270 | 0.013 | 131,200 |
| None | 0.185 | 0.005 | 757,900 |
| Education level at landing | |||
| Secondary or less (reference group) | Note ...: not applicable | Note ...: not applicable | 940,100 |
| Trade, some postsecondary | -0.161 | 0.006 | 443,100 |
| University | -0.170 | 0.007 | 505,500 |
| Postgraduate | -0.143 | 0.009 | 196,000 |
| Immigrant class | |||
| Provincial Nominee Program | -0.174 | 0.027 | 28,800 |
| Other economic class (reference group) | Note ...: not applicable | Note ...: not applicable | 985,000 |
| Family | 0.213 | 0.006 | 712,900 |
| Refugee | 0.104 | 0.007 | 292,800 |
| Other class | -0.011 | 0.013 | 65,200 |
| Place of birth | |||
| Northwestern Europe | -0.406 | 0.019 | 89,100 |
| Southeast Europe (reference group) | Note ...: not applicable | Note ...: not applicable | 280,100 |
| Africa | 0.610 | 0.011 | 184,100 |
| East Asia | 0.949 | 0.010 | 173,700 |
| South Asia | 0.977 | 0.010 | 186,100 |
| Southeast Asia | 0.196 | 0.015 | 62,700 |
| Other Asia | 1.032 | 0.010 | 161,100 |
| China | 0.623 | 0.009 | 278,000 |
| India | 0.171 | 0.010 | 253,000 |
| Philippines | -0.726 | 0.015 | 159,500 |
| OceaniaTable 11-1 Note 4 | -0.422 | 0.069 | 5,600 |
| Caribbean, Central and South America | -0.057 | 0.011 | 210,100 |
| Oceania, other | -0.091 | 0.038 | 11,300 |
| United States | -0.439 | 0.029 | 30,300 |
... not applicable
|
|||
| Regression results | Observations | ||
|---|---|---|---|
| coefficient | standard error | numberTable 11-2 Note 3 | |
| Province, region or city of residence | |||
| Newfoundland and Labrador | -0.348 | 0.083 | 1,900 |
| Prince Edward Isalnd | -0.242 | 0.111 | 1,000 |
| Nova Scotia | 0.187 | 0.030 | 10,000 |
| New Brunswick | -0.233 | 0.053 | 4,700 |
| Québec City | -0.639 | 0.043 | 10,600 |
| Sherbrooke | -0.090 | 0.056 | 3,700 |
| Montréal | -0.239 | 0.009 | 251,500 |
| Quebec, other | -0.459 | 0.037 | 13,000 |
| Ottawa–Gatineau | -0.188 | 0.013 | 69,500 |
| Oshawa | -0.667 | 0.037 | 12,300 |
| Toronto (reference group) | Note ...: not applicable | Note ...: not applicable | 889,500 |
| Hamilton | -0.420 | 0.019 | 38,400 |
| St. Catharines–Niagara | -0.308 | 0.034 | 10,800 |
| Kitchener | -0.666 | 0.023 | 30,800 |
| Guelph | -0.868 | 0.049 | 7,800 |
| London | -0.170 | 0.024 | 19,100 |
| Windsor | 0.083 | 0.020 | 20,800 |
| Ontario, other | -0.613 | 0.022 | 36,500 |
| Winnipeg | -0.843 | 0.027 | 32,500 |
| Manitoba, other | -1.166 | 0.073 | 6,700 |
| Regina | -1.063 | 0.061 | 5,300 |
| Saskatoon | -0.913 | 0.048 | 7,600 |
| Saskatchewan, other | -1.035 | 0.082 | 3,600 |
| Calgary | -1.031 | 0.014 | 109,900 |
| Edmonton | -1.154 | 0.019 | 67,400 |
| Alberta, other | -1.230 | 0.036 | 23,000 |
| Vancouver | -0.017 | 0.006 | 343,900 |
| Victoria | -0.527 | 0.035 | 11,400 |
| British Columbia, other | -0.597 | 0.020 | 41,300 |
| Constant | -2.526 | 0.012 | Note ...: not applicable |
... not applicable
|
|||
Appendix A: Issues when choosing how to measure low income
There are a number of issues to consider when choosing how to measure an annual low-income rate. Some are:
- whether to use a relative or absolute measure
- how and whether issues of social exclusion should be incorporated in the measurement
- whether relative deprivation measures contribute to poverty measurement
- whether measures should be based on consumption or income
- the role of wealth (as opposed to income) in poverty measurement
- numerous technical issues related to exactly how a low-income cut-off is determined (Wagle 2002).
- If producing regional measures, how to account for differences in the cost of basic necessities among regions.
In Canada, most operational definitions of low income are based on some form of annual disposable family income. The one major exception is the means test applied by social assistance programs, which is typically a combination of assets and income. However, low-income measures are typically based on family income—low-income cut-offs are established and persons below their relevant cut-off are said to be in low income. The most prominent cut-offs include Statistics Canada’s low-income cut-off (LICO), and a version of the Low Income Measure (LIM), which is typically set at one-half of the median income of Canadians (see Murphy, Zhang and Dionne 2012 for a review of Canadian low-income cut-offs). However, in the analysis of regional variations in low-income rates, these measures are unable to adequately account for regional differences in the cost of living. For example, if a national LIM (one-half of the median income of Canadians) is used as a cut-off and applied to family incomes in all cities, the low-income rate will be overestimated in cities where the basic necessities are less expensive. That is because the amount of, say, food or shelter that can be purchased with an income at the level of the low-income cut-off will be greater in cities with lower living costs.
Various studies have demonstrated that inequality and low-income measures are affected by regional price variations, and that rankings of regions in particular change when differences in the cost of living are taken into account (Pendakur 2002; Muller 2005; Jolliffe 2006; Zhang, Mihorean and Michaud 2010).
In this paper, a regionally adjusted LIM is used as the low-income measure (see the main body of the report). The national LIM (0.5 the median income) is adjusted using the regional Market Basket Measure (MBM). Regional price indexes other than the MBM could potentially be used in low-income research, but these have shortcomings (Zhang, Milhorean and Michaud 2010). Statistics Canada produces an intercity price index, but it only covers 11 cities, and hence cannot be used nationally. Pendakur (2002) generated a regional price index that was used in research on poverty and income inequality, but it was based on relatively old data and excluded communities with populations under 30,000. Furthermore, these and similar indexes are based on general price levels. The MBM is designed for poverty measurement and the basket of goods and services includes basic necessities appropriate for research on low-income rates. For these reasons, this study uses the MBM to measure differences in the cost of basic necessities across cities/regions.
Appendix B: The effect of averaging income over five years
Another measurement issue relates to treating low income as a discrete state—one is either in or not in low income in a given year. Such an approach ignores the “depth” of low income (Rodgers and Rodgers 1993; Hulme, Moore and Shepherd 2001). Hence, a person whose family is well below the low-income cut-off for four consecutive years will not be classified as being in chronic low income if his or her family moves marginally above the low-income cut-off in the fifth year. Conversely, an individual in a family that is just below the low-income cut-off in all five years will be considered as being in chronic low income. The approach that focuses on five consecutive years implicitly assumes that income cannot be transferred between years, and that consumption is not smoothed over time by saving in some years and de-saving in others. To overcome this problem, an alternative definition uses a “permanent income” approach. Average family incomeNote 24 over the five consecutive years prior to and including the year of interest, say 2010, is calculated. In this example, if the average annual income over the entire 2006-to-2010 period is below the low-income cut-off, all individuals in that family are said to be in chronic low income in 2010. This approach takes the depth of low income in all years into account.
Chronic low income is more prevalent using this approach. For example, in 2012, the chronic low-income rate—the proportion of immigrantsNote 25 who were in chronic low income—was 12.3% based on the “in low income all five years” method,Note 26 but 23.9% based on the “average family income over the five years” measure. The latter definition produces a much higher rate because one or two years of very low income—well below the low-income cut-off—can result in chronic low income over the entire five-year period, even if the family is marginally above the low-income cut-off for one or two years.
Of course, all measures of low income are arbitrary to some extent. This does not imply that they are not useful. Comparisons to some benchmark are often more meaningful than the absolute value of the rate itself. Has the rate been rising or falling since a base year or how does the immigrant chronic low-income rate compare with that of the Canadian-born? When looked at in this way, the two approaches produce similar results. Using the “in low income all five years” method, chronic low income among immigrants in 2012 was 3.3 times higher than that of the comparison group (mainly the Canadian-born), while the “average family income over the five years” method yields a rate 3.1 times higher. Both methods registered a 22% decline in the chronic low-income rate from 2000 to 2012. In this paper, the “in low income in all five years” definition of chronic low income is used for the reasons mentioned in the body of the report.
References
Bane, M.J., and D. Ellwood. 1986. “Slipping into and out of Poverty: The Dynamics of Spells.” Journal of Human Resources 21 (1): 1–23.
Bonikowska, A., F. Hou, and G. Picot. 2017. “New Immigrants Seeking New Places: The Role of Policy Changes in the Regional Distribution of New Immigrants to Canada.” Growth and Change 48 (1): 174–190.
Finnie, R., and A. Sweetman. 2003. “Poverty Dynamics: Empirical Evidence for Canada.” Canadian Journal of Economics 36 (2): 291–325.
Hatfield, M. 2004. “Vulnerability to Persistent Low Income.” Horizons 7 (2): 19–26.
Hatfield, M., W. Pyper, and B. Gustajtis. 2010. First Comprehensive Review of the Market Based Measure of Low-Income: Final Report. Catalogue no. SP-953-06-10E. Gatineau: Human Resources and Skills Development Canada.
Hou, F., and G. Picot. 2016. Changing Immigrant Characteristics and Entry Earnings. Analysis Branch Research Paper Series, no. 374. Statistics Canada Catalogue no. 11F0019M. Ottawa: Statistics Canada.
Hulme, D., K. Moore, and A. Shepherd. 2001. Chronic Poverty: Meanings and Analytical Frameworks. CPRC Working Paper no. 2. Manchester: Chronic Poverty Research Centre, University of Manchester.
Jolliffe, D. 2006. “Poverty, Prices and Place: How Sensitive is the Spatial Distribution of Poverty to Cost of Living Adjustments. Economic Inquiry 44 (2): 296–310.
Muller, C. 2005. “Poverty and Inequality Under Income and Price Dispersions.” Canadian Journal of Economics 38 (3): 979–998.
Murphy, B., X. Zhang, and C. Dionne. 2012. Low Income in Canada: a Multi-line and Multi-index Perspective. Income Research Paper Series, no. 001. Statistics Canada Catalogue no. 75F0002M. Ottawa: Statistics Canada.
Pandey, M., and J. Townsend. 2013. “Provincial Nominee Programs: An Evaluation of Earnings and Settlement Rates of Nominees.” Canadian Public Policy 39 (4): 603–618.
Pendakur, K. 2002. “Taking Prices Seriously in the Measurement of Inequality.” Journal of Public Economics 86 (1): 47–69.
Picot, G., and F. Hou. 2014. Immigration, Low Income and Income Inequality in Canada: What’s New in the 2000s? Analysis Branch Research Paper Series, no. 364. Statistics Canada Catalogue no. 11F0019M. Ottawa: Statistics Canada.
Picot, G., F. Hou, and S. Coulombe. 2008. “Poverty Dynamics Among Recent Immigrants to Canada.” International Migration Review 42 (2): 393–424.
Rodgers, J.R., and J.L. Rodgers. 1993. “Chronic Poverty in the U.S.” Journal of Human Resources 28 (1): 25–54.
Ruggles, P., and R. Williams. 1989. “Longitudinal Measures of Poverty: Accounting for Income and Assets over Time.” Review of Income and Wealth 35 (3): 225–243.
Statistics Canada. 2013. “Market Based Measure (2011 base).” In Low Income Lines, 2011-2012, p. 9–12. Income Research Paper Series—Research Paper, no. 2. Statistics Canada Catalogue no. 75F0002M. Available at: http://www.statcan.gc.ca/pub/75f0002m/75f0002m2013002-eng.pdf (accessed April 20, 2017).
Wagle, U. 2002. “Rethinking Poverty: Definition and Measurement.” International Social Science Journal 54 (171): 155–165.
Zhang, X., K. Mihorean, and S. Michaud. Measuring Canadian Low Income Across Regions: Local Thresholds or Spatial Price Index Adjustments. Paper presented at the 31st General Conference of the International Association for Research in Income and Wealth, St. Gallen, Switzerland, 2010.
Notes
- Date modified: