
The Business and Community Newsletter – November 2023

Archived Content
Information identified as archived is provided for reference, research or recordkeeping purposes. It is not subject to the Government of Canada Web Standards and has not been altered or updated since it was archived. Please "contact us" to request a format other than those available.
Release date: November 30, 2023
Feature article

Save the date - Immigration and Climate Change
(Two sessions: Immigration: 9:30 am - 11:30 am, Climate Change:1:00 pm - 3:00 pm)
Stay tuned for more details.
Past event: Anti-Racism and Housing/Immigration
Vancouver - Wednesday, September 20, 2023, | 9:30 am to 3:00 pm (PT). In-Person.
Data service centres
The goal of outreach activities is to build awareness of StatCan data and data services. Through the expansion and strengthening of partnerships with current and future user groups and communities, outreach efforts will build statistical capacity through workshops, webinars and customized solutions based on the needs of user-communities. These activities will, in turn, expand the responsible use of statistics for informed decision-making throughout Canada.
Put you, the data user, at the centre of our activities to enhance access, awareness and ease of use of the agency's data and services;
Continually innovate and adapt so we can more effectively respond to your evolving data and information needs;
Strengthen user engagement and seek partnership opportunities across all sectors of Canadian society and the economy;
Build statistical capacity of data users in all sectors across the country
Data Ambassadors
As part of our Data Ambassador role at Statistics Canada, we would like to collaborate with various local organizations to increase data literacy. We are particularly interested in meeting with our partners and local community members to present data that would be relevant to them and to offer guidance on navigating our website and data tables. We also wish to discuss ways in which we can collaborate to serve the needs of these organizations.
These tailored collaborations can take various forms:
- In-person presentations: touring the Statistics Canada website, key topics, practical exercises, etc.
- Webinars: Navigating our website and data tables
- Consultations and training for staff members
- Other tools or seminars to support interpreting StatCan data
Should your organization be interested in meeting with a representative from Statistics Canada to discuss an eventual collaboration, please do not hesitate to contact:infostats@statcan.gc.ca
Gross domestic product by industry, August 2023

Also check out Canadian Economic Dashboard and COVID‑19.
Interprovincial and interregional migration of Canada's French- and English-speaking populations
Approximately 810,000 English speakers (first official language spoken) and 80,000 French speakers moved to a different province or territoryNote1 in Canada during the period between the 2016 and 2021 censuses. The interprovincial migration rate was higher among English speakers (3.1%) than among French speakers (1.1%).
For both English and French speakers, employment and family were the main reasons reported for moving to a different province, regardless of the province or territory of origin or destination.
Interprovincial migration is part of the reality for some French-speaking minority populations. For example, less than a third of the French speakers who were living in Newfoundland and Labrador, Alberta, British Columbia or the territories in 2021 were born there. Moreover, half of French speakers who were born in Saskatchewan or British Columbia and most of those born in Newfoundland and Labrador were no longer living in their province of birth in 2021.
Also, an interactive data visualization tool with information on interprovincial migration by mother tongue and first official language spoken for intercensal periods going from 1976–1981 to 2016–2021 is now available. Interprovincial migration by language group in Canada from 1976 to 2021.
Labour Force Survey October 2023

Employment was little changed in October (+18,000; +0.1%) and the employment rate fell 0.1 percentage points to 61.9%.
The unemployment rate rose 0.2 percentage points to 5.7%, marking the fourth monthly increase in the past six months.
Employment was up in construction (+23,000; +1.5%) and information, culture and recreation (+21,000; +2.5%) in October. This was offset by decreases in wholesale and retail trade (-22,000; -0.7%) and manufacturing (-19,000; -1.0%).
Employment increased in four provinces in October, led by Alberta (+38,000; +1.5%), while it declined in Quebec (-22,000; -0.5%).
Total hours worked were virtually unchanged in October but were up by 2.1% on a year-over-year basis.
On a year-over-year basis, average hourly wages rose 4.8% (+$1.56 to $34.08) in October, following an increase of 5.0% in September.
Check out the Podcast: to Eh Sayers Season 1 Episode 4 - Who Wins and Who Loses in the Gig Economy? (statcan.gc.ca)
Insights on Canadian Society
Postsecondary educational attainment and labour market outcomes among Indigenous peoples in Canada, findings from the 2021 Census
This article uses data from the 2021 Census of Population to report on postsecondary educational attainment among Indigenous adults aged 25 to 64 years, including changes in educational attainment since 2016. This article also describes labour market outcomes among Indigenous adults and highlights outcomes for those with higher levels of education.
Almost half of Indigenous adults had completed a postsecondary qualification in 2021
In 2021, just under half (49.2%) of Indigenous people aged 25 to 64 years had completed a postsecondary certificate, degree or diploma, a rate lower than that of non-Indigenous people (68.0%). Rates of postsecondary completion were 45.3% for First Nations people, Note 56.3% for Métis and 33.6% among Inuit.

What do a drag king, a StatCan economist, and the 40 millionth Canadian have in common? You can catch them all on the Eh Sayers podcast!
Join us as we engage with experts from Statistics Canada and across the nation, addressing questions that resonate with Canadians, such as "Why haven't we ended poverty yet?" and "In a movie about the economy, is inflation the bad guy?" Tune in on Podcasts or your preferred podcast app.
#TLDR (too long didn’t read)? Tune into the Eh Sayers Podcast to meet the people behind the data and explore the stories behind the numbers.
StatsCAN app

Prefer accessing data at your fingertips? Download the StatsCAN mobile app from Google Play or the App Store to tap into expert analysis, visuals and the latest statistical news right from the source!
Also worth reading
Study: Functional health difficulties among lesbian, gay and bisexual people in Canada
This study examines functional health difficulties among lesbian, gay, and bisexual (LGB) men and women aged 18 and older in Canada. Using data from the Canadian Community Health Survey (2017 to 2018), this release provides an overview of self-reported general health, mental health, and difficulty in the six Washington Group functional health components (vision, hearing, mobility, cognition, self-care and communication) by sexual orientation and gender.
Did you know…
Employment services, 2022
Looking to 2023
Businesses continued to face obstacles related to labour markets in 2023. However, pressures faced by businesses related to recruiting skilled employees are easing. The job vacancy rate has been consistently dropping since the latter months of 2022, and that trend has persisted so far in 2023. This could be attributed to the solid gains in population, which grew 2.9% from July 1, 2022, to July 1, 2023, the largest year-over-year increase in population since 1957. Furthermore, almost all of the population increase came from net international migration. At the same time, the largest cohorts of baby boomers are turning 65, which will challenge the supply of labour. Detailed financial statistics for the employment services industry in 2023 will be provided following survey data collection in 2024 and will inform on the impacts of these demographic factors.

The new Food Price Data Hub is now available.
Canadians are currently facing significant food inflation. The price of groceries has risen more sharply than the all-items Consumer Price Index (CPI) since December 2021, with staple food items, such as bakery products, margarine and other edible oils, and dairy products and eggs, showing some of the largest price increases.
Industry, Science and Economic Development, Agriculture and Agri-Food Canada, and Statistics Canada have partnered to make timely data on food prices available to consumers in one central and easy-to-access location. The new Food Price Data Hub provides Canadians with more detailed information on food prices and helps consumers make informed decisions about their food purchases.
The hub will be regularly updated to show the latest trends in food inflation, along with the average price of select staple food products. The latest release of the CPI is available from the hub, which also includes links to various resources, such as articles that provide analyses on the sources of food inflation and its impact on consumers.
The hub also features information on the year-over-year changes in the prices of goods and services along the food supply chain, from farm to fork, from the price of agricultural products sold by farms to the price of diesel fuel used to transport goods to the retail markup at grocery stores.


Co-operatives in Canada, 2021
This infographic uses administrative tax data to provide a visual representation of non-financial co-operatives in Canada in 2021. Presented data includes counts of co-operatives at the national and provincial levels, as well as financial and employment statistics.

Black-owned businesses in Canada, 2020
This infographic provides a portrait of Black-owned businesses operating in Canada based on region and the primary owner's immigration status, gender, and age. It also highlights the value and share of federal Business Innovation and Growth Support (BIGS) provided to Black-owned businesses in 2020.
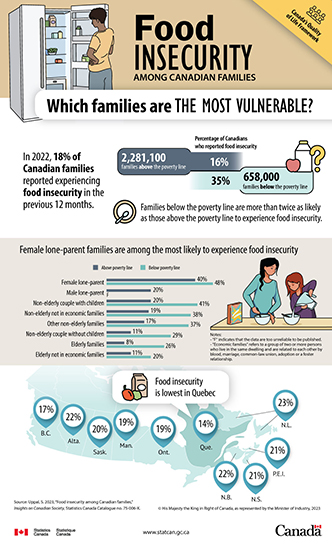
Food insecurity among Canadian families: Which families are the most vulnerable?
This infographic uses data from the from the 2021 Canadian Income Survey to examine food insecurity, offering insight into families most at risk for food insecurity.
- Date modified: