
Black-owned businesses in Canada, 2020

Archived Content
Information identified as archived is provided for reference, research or recordkeeping purposes. It is not subject to the Government of Canada Web Standards and has not been altered or updated since it was archived. Please "contact us" to request a format other than those available.
Correction notice
Corrections were made to this product on November 13, 2024. The following changes were made in the section on self-employed (sole proprietorship):
The proportion of non-Black-owned businesses was changed from 59.6% to 49.1%, and the proportion of Black-owned businesses was changed from 69.5% to 62.9%.
Description: Black-owned businesses in Canada, 2020
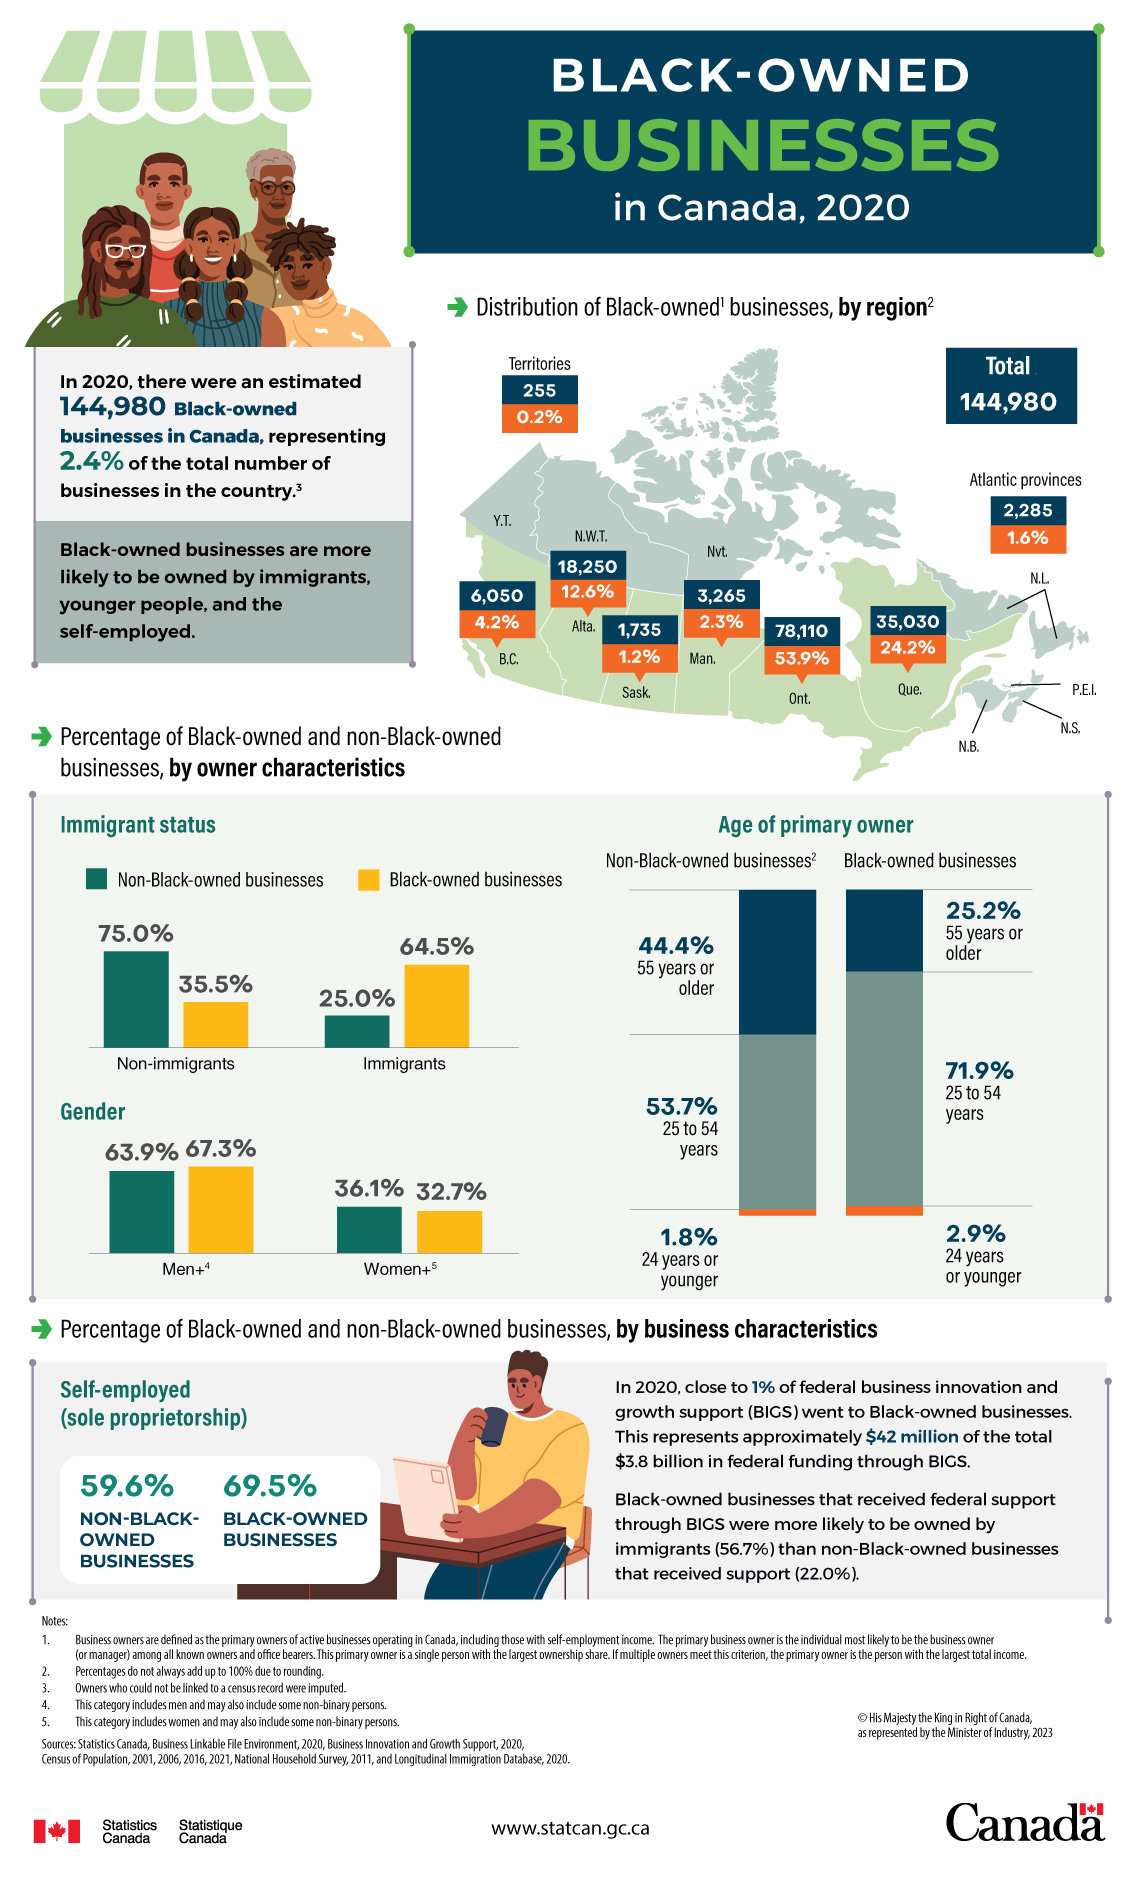
| Region | Black-owned businesses | |
|---|---|---|
| Counts | Percentages | |
| Atlantic provinces | 2,285 | 1.6% |
| Quebec | 35,030 | 24.2% |
| Ontario | 78,110 | 53.9% |
| Manitoba | 3,265 | 2.3% |
| Saskatchewan | 1,735 | 1.2% |
| Alberta | 18,250 | 12.6% |
| British Columbia | 6,050 | 4.2% |
| Territories | 255 | 0.2% |
| Total | 144,980 | Note ...: not applicable |
| ... not applicable | ||
In 2020, there were an estimated 144,980 Black-owned businesses in Canada, representing 2.4% of the total number of businesses in the country.Note 3
Black-owned businesses are more likely to be owned by immigrants, younger people, and the self-employed.
Percentage of Black-owned and non-Black-owned businesses, by owner characteristics
| Immigrant status | Non-Black-owned businesses | Black-owned businesses |
|---|---|---|
| Non-immigrants | 75.0% | 35.5% |
| Immigrants | 25.0% | 64.5% |
| Gender | Non-Black-owned businesses | Black-owned businesses |
|---|---|---|
| Men+Note 4 | 63.9% | 67.3% |
| Women+Note 5 | 36.1% | 32.7% |
| Age group | Non-Black-owned businessesNote 2 | Black-owned businesses |
|---|---|---|
| 24 years or younger | 1.8% | 2.9% |
| 25 to 54 years | 53.7% | 71.9% |
| 55 years or older | 44.4% | 25.2% |
Percentage of Black-owned and non-Black-owned businesses, by business characteristics
| Non-Black-owned businesses | Black-owned businesses | |
|---|---|---|
| Self-employed (sole proprietorship) | 49.1% | 62.9% |
In 2020, close to 1% of federal business innovation and growth support (BIGS) went to Black-owned businesses. This represents approximately $42 million of the total $3.8 billion in federal funding through BIGS.
Black-owned businesses that received federal support through BIGS were more likely to be owned by immigrants (56.7%) than non-Black-owned businesses that received support (22.0%).
Sources: Statistics Canada, Business Linkable File Environment, 2020, Business Innovation and Growth Support, 2020, Census of Population, 2001, 2006, 2016 and 2021, National Household Survey, 2011, Longitudinal Immigration Database, 2020.
- Date modified: