
Research to Insights: Tracking Canada’s Evolving Supply Chain Links and Their Effects
Skip to text
Text begins
About Research to Insights
The Research to Insights series of presentations features a broad range of findings on selected research topics. Each presentation draws from and integrates evidence from various studies that use innovative and high-quality data and methods to better understand relevant and complex policy issues.
Based on applied research of valuable data, the series is intended to provide decision makers, and Canadians more broadly, a comprehensive and horizontal view of the current economic, social and health issues we face in a changing world.
Context
- In its most basic terms, “[a] supply chain is a network of individuals and companies who are involved in creating a product and delivering it to the consumer. Links on the chain begin with the producers of the raw materials and end when the van delivers the finished product to the end user” (Hayes, n.d.).
- In previous decades, declining trade barriers (e.g., tariffs) and communications and transportation costs have made it profitable to extend supply chains across international borders and over greater distances.
- Before the COVID-19 pandemic, globalization and participation in global supply chains were associated with many economic benefits, including higher productivity and wages, more research and development (R&D), and lower inflation.
- However, the pandemic and its aftermath have highlighted the risks associated with global supply chains, such as acute shortages of essential goods, disruptions to domestic production of goods and higher inflation.
- If we are in a world where supply chain risks have been rising, what do we know and what do we need to know about them?
For more information: The Supply Chain: From Raw Materials to Order Fulfillment.
Participation in global supply chains has been associated with higher productivity and wages
- Manufacturing firms that participate in global value chains have 10% higher labour productivity (output per worker) and 6% higher wages on average than those that do not.
- Additional benefits include
- higher multifactor productivity (in the 2000s, about two-fifths of multifactor productivity growth was associated with the use of cheaper foreign inputs [Gu and Yan, 2017])
- greater R&D (firms that begin to export increase their R&D expenditures by 6 percentage points more than non-exporters [Baldwin et al., 2016])
- lower inflation (the integration of China into the global economy decreased inflation in Canada by 0.32 percentage points per year between 1984 and 2006 [Côté and de Resende, 2008]).

Data table for Chart 1
| Percent | |
|---|---|
| Labour productivity | 10 |
| Wages | 6 |
| Source: Baldwin and Yan (2016, Table 1). | |
But participating in global supply chains is also associated with risks
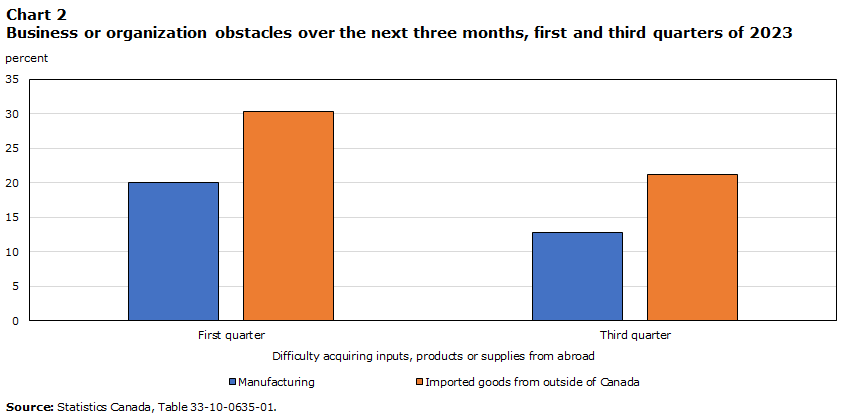
- Obstacles to business. Manufacturers and firms that imported goods from abroad have identified import supply chain difficulties as a short-term business obstacle.
- Participation leads to exposure to external demand and supply shocks. 40% of industries accounting for 25% of output are highly vulnerable to both external demand and supply shocks (Boileau and Sydor, 2020).
- It can contribute to higher inflation. After the second quarter of 2021, nearly 90% of the increase in inflation was attributable to supply-side factors (Chen and Tombe, 2023). Moreover, rising import prices accounted for about half of inflation at its peak in the last three quarters of 2022 (Wang, 2023).
Data table for Chart 2
| Difficulty acquiring inputs, products or supplies from abroad | ||
|---|---|---|
| First quarter | Third quarter | |
| percent | ||
| Manufacturing | 20.1 | 12.8 |
| Imported goods from outside of Canada | 30.3 | 21.2 |
| Source: Statistics Canada, Table 33-10-0635-01. | ||
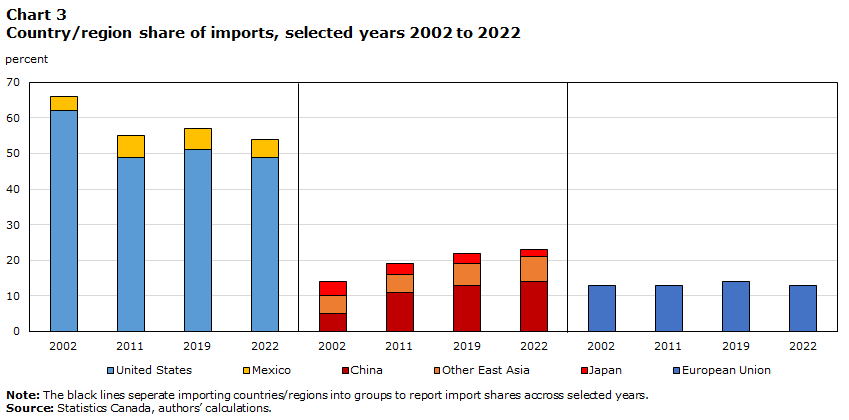
With China’s entry into the World Trade Organization, Canada’s merchandise imports shifted away from North America to East Asia, but remain centred on the United States
Data table for Chart 3
| United States | Mexico | China | Other East Asia | Japan | European Union | |
|---|---|---|---|---|---|---|
| percent | ||||||
| 2002 | 62.00 | 4.00 | 5.00 | 5.00 | 4.00 | 13.00 |
| 2011 | 49.00 | 6.00 | 11.00 | 5.00 | 3.00 | 13.00 |
| 2019 | 51.00 | 6.00 | 13.00 | 6.00 | 3.00 | 14.00 |
| 2022 | 49.00 | 5.00 | 14.00 | 7.00 | 2.00 | 13.00 |
| Source: Statistics Canada, author's calculations. | ||||||
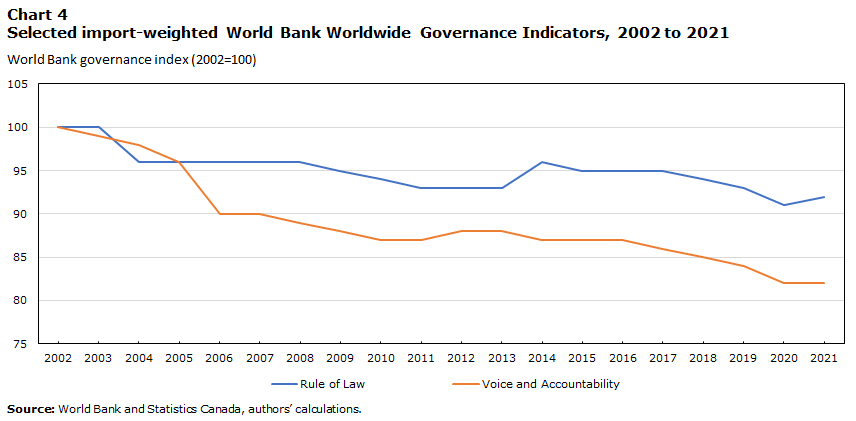
Concerns over trading partner governance are rising: The average level of governance among Canada’s import trading partners has been declining
Growing trade with countries with poor or deteriorating governance will push the index downward.
- A diminished Rule of Law indicator potentially affects contract enforcement, raising supply chain risks for firms.
- A deteriorating Voice and Accountability indicator signals a potentially greater geopolitically driven supply chain risk.
Data table for Chart 4
| Estimates | 2002 | 2003 | 2004 | 2005 | 2006 | 2007 | 2008 | 2009 | 2010 | 2011 | 2012 | 2013 | 2014 | 2015 | 2016 | 2017 | 2018 | 2019 | 2020 | 2021 |
|---|---|---|---|---|---|---|---|---|---|---|---|---|---|---|---|---|---|---|---|---|
| World Bank governance index (2002=100) | ||||||||||||||||||||
| Rule of Law | 100 | 100 | 96 | 96 | 96 | 96 | 96 | 95 | 94 | 93 | 93 | 93 | 96 | 95 | 95 | 95 | 94 | 93 | 91 | 92 |
| Voice and Accountability | 100 | 99 | 98 | 96 | 90 | 90 | 89 | 88 | 87 | 87 | 88 | 88 | 87 | 87 | 87 | 86 | 85 | 84 | 82 | 82 |
| Source: World Bank and Statistics Canada, authors’ calculations. | ||||||||||||||||||||
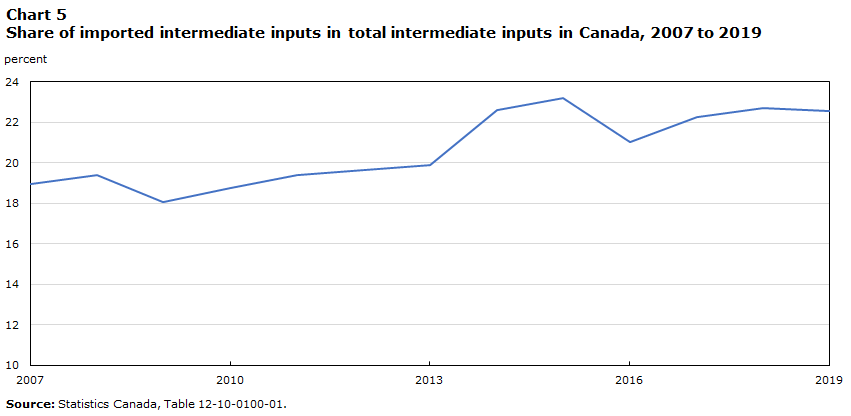
Canada’s supply chains are increasingly tied to global supply chains
Imports of intermediate inputs—goods that are used in the production of other goods—account for a growing share of total intermediate inputs.
Data table for Chart 5
| 2007 | 2008 | 2009 | 2010 | 2011 | 2012 | 2013 | 2014 | 2015 | 2016 | 2017 | 2018 | 2019 | |
|---|---|---|---|---|---|---|---|---|---|---|---|---|---|
| percent | |||||||||||||
| Share of imported intermediate inputs in total intermediate inputs | 18.96 | 19.40 | 18.06 | 18.76 | 19.37 | 19.66 | 19.87 | 22.58 | 23.21 | 21.00 | 22.26 | 22.70 | 22.55 |
| Source: Statistics Canada, Table 12-10-0100-01. | |||||||||||||
A larger share of small firms are participating in supply chains
- A rising share of small manufacturers and wholesalers are directly importing specialized intermediate inputs. See Statistics Canada (2022) for a recent analysis of Canada’s exposure to global supply chains through specialized intermediate input imports.
- Canada’s global supply chains extend deeper into firm populations that have fewer resources to absorb supply chain shocks.
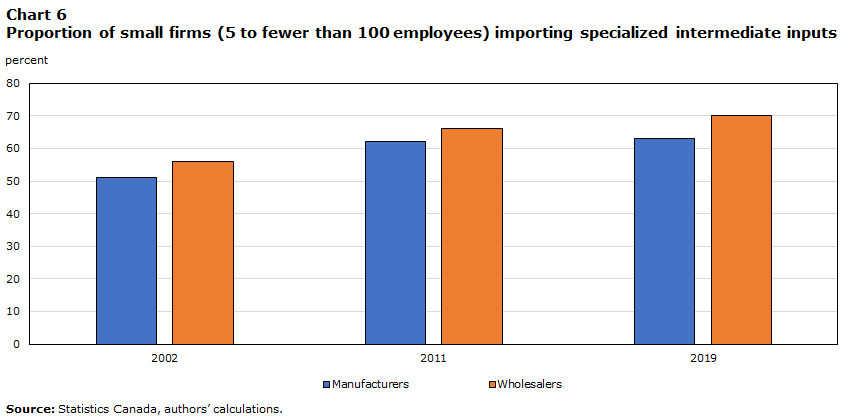
Data table for Chart 6
| 2002 | 2011 | 2019 | |
|---|---|---|---|
| percent | |||
| Manufacturers | 51.00 | 62.00 | 63.00 |
| Wholesalers | 56.00 | 66.00 | 70.00 |
| Source: Statistics Canada, authors’ calculations. | |||
For manufacturers and wholesalers, the average number of suppliers per imported intermediate input has been declining since 2002
- The average small firm with fewer than 100 employees has fewer than two suppliers per imported product, with around 80% of their imported products having just one supplier.
- Consequently, for many small firms, the loss of just one supplier is potentially disruptive.
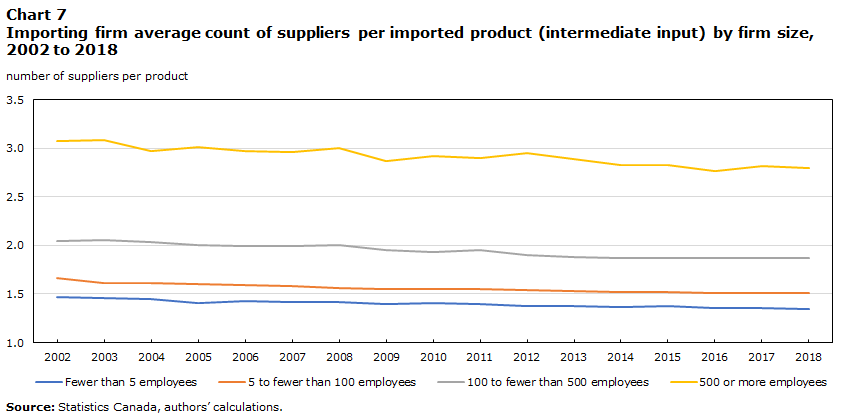
Data table for Chart 7
| Fewer than 5 employees | 5 to fewer than 100 employees | 100 to fewer than 500 employees | 500 or more employees | |
|---|---|---|---|---|
| number of suppliers per product | ||||
| 2002 | 1.5 | 1.7 | 2.1 | 3.1 |
| 2003 | 1.5 | 1.6 | 2.1 | 3.1 |
| 2004 | 1.5 | 1.6 | 2.0 | 3.0 |
| 2005 | 1.4 | 1.6 | 2.0 | 3.0 |
| 2006 | 1.4 | 1.6 | 2.0 | 3.0 |
| 2007 | 1.4 | 1.6 | 2.0 | 3.0 |
| 2008 | 1.4 | 1.6 | 2.0 | 3.0 |
| 2009 | 1.4 | 1.6 | 2.0 | 2.9 |
| 2010 | 1.4 | 1.6 | 1.9 | 2.9 |
| 2011 | 1.4 | 1.6 | 2.0 | 2.9 |
| 2012 | 1.4 | 1.5 | 1.9 | 3.0 |
| 2013 | 1.4 | 1.5 | 1.9 | 2.9 |
| 2014 | 1.4 | 1.5 | 1.9 | 2.8 |
| 2015 | 1.4 | 1.5 | 1.9 | 2.8 |
| 2016 | 1.4 | 1.5 | 1.9 | 2.8 |
| 2017 | 1.4 | 1.5 | 1.9 | 2.8 |
| 2018 | 1.4 | 1.5 | 1.9 | 2.8 |
| Source: Statistics Canada, authors’ calculations. | ||||
Next steps…
Developing measures to fill knowledge gaps
Improving supply chain logistics measures
For trucking, marine, rail and air transportation, investments over several years by Statistics Canada in collaboration with Transport Canada will
- inform policies to reduce freight congestion and improve supply chain efficiency and future infrastructure planning
- complement the new National Supply Chain Office’s mandate to increase the capacity, efficiency and reliability of Canada’s transportation supply chain infrastructure
- build on real-time supply chain measures (i.e., road traffic movement, grain movements by rail and tracking of vessels through ports) and develop new supply chain price and volume indexes, as well as better data on domestic flows.
Internal trade measures
Statistics Canada is building a repository of internal trade data, information and analysis as part of the data strategy for the Federal Action Plan to Strengthen Internal Trade. This hub will publish newly developed indicators to provide insights on the state of internal trade and labour mobility.
North American integration
Measures of the Canada–United States supply chain, including its integration with major trading partners, will be developed to identify risks and vulnerabilities. This work will focus on the development of Canada–United States supply and use tables that also break down the geographic dimensions of trade with the rest of the world.
For more information: National Supply Chain Office, Traffic Flow Dashboard, Grain Supply Chain Dashboard: Real-time Grain Movement by Rail and Federal Action Plan to Strengthen Internal Trade.
But there are remaining questions
- What are the consequences of continued supply chain disruptions?
- Are firms moving from just-in-time production to just-in-case production that requires higher inventory levels?
- What are the economic impacts of the friend- or near-shoring of supply chains?
- What are the consequences for the macroeconomy (i.e., output, productivity, employment and prices)?
- How has the economy adapted to its integration into global supply chains?
- How much is the Canadian economy specializing in higher- or lower-value portions of supply chains?
- How are people affected by supply chain integration or disruption (e.g., employment, skills and wages)?
References
Baldwin, J.R., Dar-Brodeur, A. and Yan, B. (2016). Innovation and export-market participation in Canadian manufacturing. Statistics Canada.
Baldwin, J.R. and Yan, B. (2016). Global value chain participation and the productivity of Canadian manufacturing firms. In S. Tapp, A. Van Assche and R. Wolfe (Eds.) Redesigning Canadian trade policies for new global realities (sixth volume of The Art of the State). Institute for Research on Public Policy.
Boileau, D. and Sydor, A. (2020). Vulnerability of Canadian industries to disruptions in global supply chains. Global Affairs Canada.
Chen, Y. and Tombe, T. (2023). The Rise (and Fall?) of Inflation in Canada: A Detailed Analysis of its Post-Pandemic Experience. Canadian Public Policy, 49(2), pp.197-217.
Côté, D. and de Resende, C. (2008). Globalization and inflation: The role of China (No. 2008-35). Bank of Canada Working Paper.
Gu, W. and Yan, B. (2017). Productivity growth and international competitiveness. Review of Income and Wealth, 63, pp.S113-S133.
Hayes, A. (n.d.). The Supply Chain: From Raw Materials to Order Fulfillment. Investopedia.
Statistics Canada. (2022). Measuring exposure and disruptions caused by the COVID-19 pandemic to global value chains: An analysis based on imported specified intermediate goods in Canada. Latest Developments in the Canadian Economic Accounts. Statistics Canada.
Wang, W. (2023). Import prices and inflation in Canada. Economic and Social Reports, 3(6).
For more information, please contact
analyticalstudies-etudesanalytiques@statcan.gc.ca
- Date modified: