
Latest Developments in the Canadian Economic Accounts
Measuring exposure and disruptions caused by the COVID-19 pandemic to global
value chains: An analysis based on imported specified intermediate goods in Canada
Skip to text
Text begins
The shock of the COVID-19 pandemic has illustrated the risks associated with interdependent global trade when supply sources are concentrated. Dependence on imported intermediate goods has led to disruptions in global value chains (GVCs) that spread to several countries.
According to a broad definition, GVCs are tightly related to the use of foreign value added embodied in intermediate goods (e.g., primary goods such as aluminum, generic goods such as tires and specified goods such as engines) or tasks (back-office services) in production.
A narrower conceptualization of GVCs highlights that firms and plants participating in a GVC often exchange highly specific (customized) inputs on a repeated basis. Furthermore, firms spend significant time and resources designing the organizational structure of these production networks.
This paper uses the classification of the Broad Economic Categories, Revision 5 (BEC 5) to illustrate Canada’s participation in GVCs through an analysis of imported specified intermediate goods (SIGs). A measure of exposure to imports of these goods from top source countries is also calculated to shed light on how this exposure evolved during the pandemic and how Canada adjusted to possible disruptions in GVCs.
Measurement of global value chains
One approach to measuring the degree to which production processes are fragmented across countries consists of computing the share of trade flows accounted for by industry categories that can be safely assumed to contain only intermediate goods. This is where the BEC 5 comes into play. BEC 5 includes three categories of end-use products: intermediate, capital and consumption goods. Intermediate goods are broken into primary intermediate goods and processed intermediate goods, and these, in turn, are broken into generic intermediate goods (GIGs) and SIGs.

Description for Figure 1
Illustration of the structure of intermediate goods:
A three-level hierarchy of intermediate goods is shown with intermediate goods composed of primary and processed goods and processed goods composed of generic and specified goods.
GIGs are those consumed across a wide range of industries, while SIGs are typically consumed only in certain industries. GIGs can be associated with homogenous goods that are traded on an organized exchange (e.g., futures markets) and referenced priced goods with published prices. SIGs are associated with differentiated goods and require an explicit coordination between the industries producing and consuming them. For example, in the Broad Economic Category (BEC) of transport equipment and travel services, GIGs include pneumatic tires, semi-finished products of alloy steel and wire of stainless steel, whereas SIGs include parts and accessories of bodies for motor vehicles, engines, parts of turbo-jets or turbo-propellers, and parts for motor vehicles.
In general, SIGs are also highly integrated electronic components, pharmaceuticals, chemicals and plastic products that are protected by patents or produced according to a specified formula that is unavailable to others because of legal or technical capability reasons.
For such goods, the explicit coordination between suppliers and buyers is highly valued to avoid a break in the supply chain. GVCs most prominently involve international transactions with some level of explicit coordination rather than the arms-length transactions that underpin more traditional trade. Participants in GVCs often undertake numerous relationship-specific investments, such as purchasing specialized equipment or customized products. The need to customize inputs, coupled with quality sensitivity considerations, makes the matching between buyers and suppliers particularly important.
Canada’s participation in import global value chains
Canada’s participation in import GVCs is defined as the share of imported SIGs in total Canadian imports. During the three years prior to the pandemic, SIGs have consistently represented about 26% of the value of total Canadian imports. The proportion of these products declined to 24.9% in 2020 and to 23.5% in 2021. The lower ratios observed in 2020 and 2021 suggest that Canada experienced a slowdown in import GVC activity compared with the pre-pandemic period.
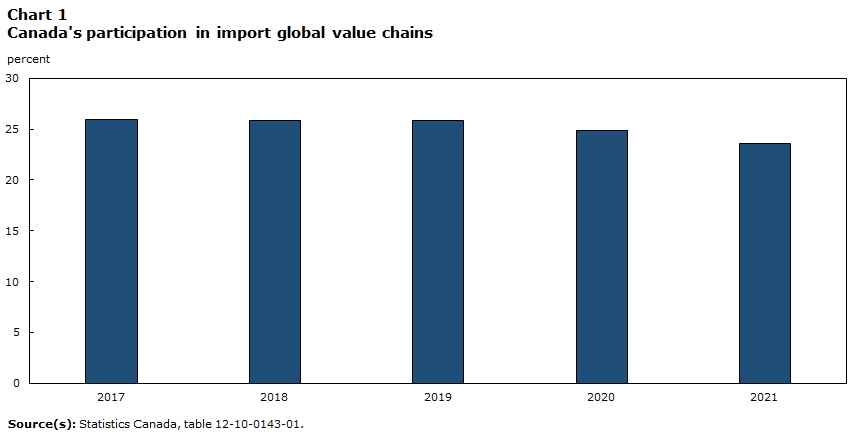
Data table for Chart 1
| 2017 | 2018 | 2019 | 2020 | 2021 | |
|---|---|---|---|---|---|
| percent | |||||
| Ratio_SIG_M | 26.0 | 25.8 | 25.9 | 24.9 | 23.5 |
| Source(s): Statistics Canada, table 12-10-0143-01. | |||||
In terms of value, these imported SIGs in the production process totalled $144.2 billion in 2021, compared with $155.8 billion in 2019, a decrease of 7.4%. Parts and accessories of bodies for motor vehicles ($5.0 billion), medicaments put up in doses ($4.9 billion), engines ($3.9 billion), parts and accessories for motor vehicles ($3.4 billion), and parts of turbo-jets or turbo-propellers ($3.4 billion) were the top five imported SIGs in 2021. Meanwhile, the value of imported GIGs increased by 23.6% during the same period. Imports of consumption goods were also up (+7.1%), suggesting that SIGs were particularly impacted during the pandemic.
By BEC, imports of SIGs were concentrated in three categories: transport equipment and travel services; construction, housing, appliances and furniture; and health, sports, cultural activities and education. Together, these categories accounted for over three-quarters (77%) of all imported SIGs in 2021.
Except for transport equipment and travel services, all other BECs saw their share of imported SIGs increase between 2019 and 2021. Therefore, transport equipment and travel services tended to be more negatively affected by risks associated with GVC disruptions than other categories during the pandemic period.

Data table for Chart 2
| 2017 | 2018 | 2019 | 2020 | 2021 | |
|---|---|---|---|---|---|
| percent | |||||
| Food, beverage, agriculture, catering | 0.2 | 0.2 | 0.2 | 0.2 | 0.2 |
| Energy, mining, basic metals and chemicals | 10.3 | 11.3 | 11.0 | 12.5 | 13.4 |
| Construction, housing, appliances and furniture | 24.4 | 24.9 | 24.0 | 24.5 | 26.2 |
| Textile, apparel, footwear and jewelry | 1.5 | 1.4 | 1.4 | 1.5 | 1.5 |
| Transport equipment and travel services | 44.9 | 43.5 | 44.5 | 40.1 | 36.1 |
| ICT, business, finance and media | 7.3 | 7.2 | 6.7 | 7.2 | 7.4 |
| Health, sports, cultural activities and education | 11.2 | 11.3 | 12.0 | 13.8 | 15.0 |
| Government and other | 0.2 | 0.2 | 0.2 | 0.2 | 0.2 |
| Source(s): Statistics Canada, table 12-10-0143-01. | |||||
Measures of exposure to specified intermediate goods at the country level
The exposure to SIGs can also be measured at the country level by calculating the ratio of imported SIGs from one country to imported SIGs from all countries. The analysis can be further conducted by BEC and by product.
The ratio of imported SIGs from the United States to total imported SIGs remained above 50% between 2019 and 2021, although it decreased from 52.8% to 51.4%, reflecting a lower exposure to the United States for these goods during the period. The same was observed for Mexico, while exposure to such goods increased for China. Outside the three major trading partners, declines were observed for Japan, the United Kingdom, France and Belgium, while increases occurred for Germany, Italy, Brazil, South Korea, Taiwan, India and Vietnam.

Data table for Chart 3
| Exposure 2019 | Exposure 2020 | Exposure 2021 | |
|---|---|---|---|
| percent | |||
| U.S. | 52.8 | 51.8 | 51.4 |
| China | 10.1 | 10.7 | 12.1 |
| Mexico | 7.0 | 6.2 | 5.4 |
| Germany | 3.5 | 3.9 | 3.7 |
| Japan | 3.2 | 3.0 | 3.0 |
| Taiwan | 1.4 | 1.4 | 1.6 |
| Italy | 1.6 | 1.7 | 1.6 |
| United Kingdom |
1.9 | 1.8 | 1.6 |
| Brazil | 1.2 | 1.3 | 1.4 |
| South Korea | 1.2 | 1.4 | 1.4 |
| India | 1.2 | 1.3 | 1.3 |
| Switzerland | 1.2 | 1.5 | 1.2 |
| France | 1.3 | 1.2 | 1.1 |
| Ireland | 1.1 | 1.3 | 1.0 |
| Belgium | 1.1 | 0.9 | 1.0 |
| Spain | 0.9 | 0.8 | 0.9 |
| Vietnam | 0.5 | 0.8 | 0.9 |
| Source(s): Statistics Canada, table 12-10-0143-01. | |||
Given the importance the transport equipment and travel services category plays in GVCs, particularly for trade between Canada, the United States and Mexico, the exposure to imported SIGs from the same top countries was analyzed excluding this category to better illustrate possible movements in supply chains in favour of closer sources.
For the United States, the exposure to imported SIGs increased from 45.7% in 2019 to 46.4% in 2021 when the BEC of transport equipment and travel services is excluded. However, the decline observed for Mexico held. The upward trend in exposure to imported SIGs from China also remained, but to a lower extent. The trend of exposure for the remaining countries stayed similar to that obtained at the total BEC level, with the exception of Germany, which saw its share decreasing.
For the BEC of transport equipment and travel services specifically, exposure to imported SIGs from the United States, Mexico and the United Kingdom all decreased between 2019 and 2021. On the other hand, exposure to China increased, and exposure to Germany and South Korea edged up. Therefore, for this BEC, a readjustment of supply chains in favour of the United States and Mexico as suppliers, two sources closer to Canada, was not observed during the pandemic period.

Data table for Chart 4
| Exposure 2019 | Exposure 2020 | Exposure 2021 | |
|---|---|---|---|
| percent | |||
| U.S. | 61.7 | 61.3 | 60.2 |
| China | 6.7 | 7.5 | 9.0 |
| Mexico | 10.2 | 9.4 | 8.3 |
| Japan | 4.1 | 4.3 | 4.6 |
| Germany | 2.5 | 3.0 | 2.9 |
| United Kingdom | 2.5 | 2.3 | 1.9 |
| Poland | 1.2 | 1.0 | 1.2 |
| South Korea | 1.0 | 1.1 | 1.2 |
| Source(s): Statistics Canada, table 12-10-0143-01. | |||
In addition to the United States and Mexico as top source countries, the BEC of information and communications technologies (ICT), business, finance and media showed a noticeable higher presence in Asian countries compared with the previous categories analyzed. A significant decrease in exposure to imported SIGs from the United States was observed for this category (from 42.9% in 2019 to 37.1% in 2021). Meanwhile, much higher exposures were observed for Asian countries. In addition to China, exposures to countries such as Vietnam, Taiwan, Malaysia and South Korea all increased, suggesting an adjustment of supply chains towards Asian countries and a greater diversification within the region for this category.

Data table for Chart 5
| Exposure 2019 | Exposure 2020 | Exposure 2021 | |
|---|---|---|---|
| percent | |||
| U.S. | 42.9 | 42.2 | 37.1 |
| China | 18.0 | 18.1 | 18.8 |
| Taiwan | 6.2 | 6.4 | 7.8 |
| Malaysia | 5.1 | 5.7 | 6.2 |
| Japan | 4.2 | 4.1 | 4.0 |
| Vietnam | 1.5 | 3.3 | 3.9 |
| South Korea | 2.4 | 2.4 | 3.0 |
| Mexico | 2.6 | 2.6 | 2.5 |
| Source(s): Statistics Canada, table 12-10-0143-01. | |||
The largest increase of exposure to imported SIGs from the United States was in the BEC of health, sports, cultural activities and education, up from 38.3% in 2019 to 44.7% in 2021, on the strength of U.S. health-related goods during the pandemic period. The countries for which exposure decreased the most over the same period were Belgium and Switzerland. For Belgium, a decrease of imports of steroidal hormones, immunological products and medicaments in doses that was larger than the increase of imports of vaccines for human medicine contributed to the lower exposure. For China, the main products behind the increased exposure were diagnostic or laboratory reagents, as demand for such SIGs went up significantly during the pandemic period.
Against the backdrop of the pandemic, Canada’s exposure to imported SIGs for selected BEC and for principal source countries has evolved between 2019 and 2021.
| Broad economic categories (BEC) | Exposure to United States | Exposure to China | Exposure to Mexico |
|---|---|---|---|
| All BEC categories | Decrease | Increase | Decrease |
| All BEC categories excluding Transport equipment and travel services | Increase | Increase | Decrease |
| Transport equipment and travel services | Decrease | Increase | Decrease |
| Information and communications technologies (ICT), business, finance and media | Decrease | Increase | Not applicable |
| Health, sports, cultural activities and education | Increase | Increase | Decrease |
| Source(s): Statistics Canada, table 12-10-0143-01. | |||
Measures of exposure to imported specified intermediate goods at the product level
The exposure measure revealed additional nuances when analyzed for top imported products (over $1 billion annually). Although the overall exposure to imported SIGs from the United States decreased between 2019 and 2021, increases were observed for specific key products imported from the United States involved in GVCs, notably engines from the BEC of transport equipment and services (from 75.0% in 2019 to 80.7% in 2021).
There was also a significant change in exposure to imported electronic integrated circuits and processors between 2019 and 2021 in the BEC of ICT, business, finance and media. Exposure to the United States was down significantly, while exposure to Asian countries was up, notably for Taiwan, China, South Korea and Vietnam, reflecting the role that these countries play in the GVCs of microchips or semiconductors.
| Broad Economic Categories (BEC) | Exposure in 2019 | Exposure in 2021 | Change in exposure |
|---|---|---|---|
| % | |||
| Transport equipment and travel servicesTable 2 Change in exposure for selected products and key source countries between 2019 and 2021 Note 1 | |||
| United States | 75.0 | 80.7 | 5.7 |
| Mexico | 9.7 | 8.6 | -1.1 |
| Spain | 9.5 | 6.1 | -3.4 |
| Japan | 1.5 | 2.2 | 0.7 |
| Austria | 1.1 | 1.4 | 0.3 |
| South Korea | 0.4 | 0.5 | 0.1 |
| China | 0.3 | 0.2 | -0.1 |
| Information and communications technologies (ICT), business, finance and mediaTable 2 Change in exposure for selected products and key source countries between 2019 and 2021 Note 2 | |||
| United States | 47.5 | 25.8 | -21.7 |
| Malaysia | 15.9 | 17.6 | 1.7 |
| Taiwan | 7.8 | 12.6 | 4.8 |
| China | 7.3 | 12 | 4.7 |
| Philippines | 5.4 | 6.4 | 1.0 |
| South Korea | 1.4 | 6.1 | 4.7 |
| Vietnam | 2.4 | 5.4 | 3.0 |
|
|||
Conclusion
The ratio of imported SIGs to total imports can be used to measure the participation of a country in GVCs for imports. For Canada, this ratio was sensitive to disruptions in the GVCs associated with the COVID-19 pandemic, declining from a steady level of about 26% of all imports prior to the pandemic to ratios of 24.9% in 2020 and 23.5% in 2021. Meanwhile, the value of imported goods not considered to be associated with GVCs, such as GIGs and consumer goods, showed an upward trend.
Among the BECs that have been important drivers of GVCs’ development and import participation, the aggregated transport equipment and travel services category was negatively affected by pandemic disruptions, with its share of all SIGs imports decreasing between 2019 and 2021.
By major trading partner, the exposure to imported SIGs from the United States, Mexico, Japan, the United Kingdom and Belgium all declined between 2019 and 2021, while it increased for Asian countries such as China, India, South Korea, Taiwan and Vietnam, as well as for Germany and Brazil.
However, there are nuances to the interpretation at the BEC and product levels on a per country basis. For example, when the BEC of transport equipment and services is excluded, a category particularly important for North American trade, exposure to imported SIGs from the United States increased slightly between 2019 and 2021, while exposure from Mexico was still down.
Exposure to imported SIGs from the United States increased in the BEC of health, sports, cultural activities and education and for the engines product between 2019 and 2021. The pandemic period translated into higher, and more diversified exposures to imports of electronic integrated circuits and processors from Asian countries, notably Taiwan, China, South Korea and Vietnam, and accelerated the decrease of exposure to these products from the United States.
When all eight BECs are considered together and individually, exposure to SIGs imports from the United States was the largest in both 2019 and 2021 at the country level. Therefore, in the context of GVCs, Canada relies primarily on U.S. suppliers and complements this with suppliers from other countries depending on the category. However, when 2019 and 2021 are compared, changes in exposure triggered by the pandemic were not all in favour of the United States. These changes suggest that adjustments were made as a result of disruptions in GVCs throughout the period.
BEC 5 is a tool that can be leveraged to assess and follow the impact of shocks, such as the COVID-19 pandemic, on exposure and GVCs from an international trade perspective.
References
Antràs, P. 2021b. Conceptual Aspects of Global Value Chains. World Bank Economic Review, 34(3), pp. 551-74; https://scholar.harvard.edu/antras/publications/conceptual-aspects-global-value-chains.
Statistics Canada.Table 12-10-0143-01 International merchandise trade by Broad Economic Categories and top sixty trading partners (x 1,000).
United Nations. 2018. Classification by Broad Economic Categories Rev.5, Department of Economic and Social Affairs, Statistical Division, Statistical Papers, Series M, No. 53 Rev.5, New York. https://unstats.un.org/unsd/trade/classifications/SeriesM_53_Rev.5_17-01722-E-Classification-by-Broad-Economic-Categories_PRINT.pdf.
- Date modified: