
Economic Insights
Recent Developments in the Canadian Economy, 2020: COVID-19, first edition

Archived Content
Information identified as archived is provided for reference, research or recordkeeping purposes. It is not subject to the Government of Canada Web Standards and has not been altered or updated since it was archived. Please "contact us" to request a format other than those available.
This article in the Economic Insights series highlights sudden changes in economic conditions as households and businesses were adjusting to social and economic restrictions intended to contain the spread of COVID-19. It is the first in a series of articles that will provide integrated analysis of the economic impacts of COVID-19 as new data and information become available.
This first report is based on data that are publicly available as of May 20, 2020. It focuses on the unprecedented declines in labour market activity in March and April as physical distancing and business shutdowns impacted many sectors of the economy. It highlights data from the Canadian Survey on Business Conditions which provides information on the extent to which businesses in different sectors have adjusted their operations in response to the pandemic. The article also examines the impacts of COVID-19 on Canadian merchandise trade and manufacturing sales in March, as public health measures began to impact production in the manufacturing sector.
Overview
Total employment fell by three million from February to April 2020 as physical distancing measures and economic shutdowns resulted in unprecedented declines in labour market activity. Total hours worked fell by almost 30% over this two-month period. Canadian merchandise trade in March fell to the lowest level since January 2018 as shutdown activities in the manufacturing sector weighed on exports and imports. Manufacturing sales in March fell to the lowest level since mid-2016 as sales of auto manufacturers and parts suppliers were both down over 30%. Headline consumer inflation fell below 1% in March for the first time since the spring of 2015, as sharp declines in energy prices resulted in the largest year-over-year deceleration in the all-items index since September 2006. In April, lower energy prices pushed the headline rate into negative territory for the first time since September 2009.Flash estimates of gross domestic product, published in mid-April, projected a 9% decline in monthly GDP in March and a 2.6% decline for the first quarter of 2020.
Unprecedented declines in labour market activity during March and April
March’s employment report provided an initial assessment of the extent to which labour market activity was being impacted as the COVID-19 pandemic was rapidly escalating. The reference week for March’s Labour Force Survey was the 15th to the 21st of the month, a period during which many businesses and organizations began scaling-back or shuttering operations as states of emergency were being declared across the country.Note However, the labour force data for March were collected prior to the mandated closures of non-essential businesses that several provinces, including Ontario and Quebec, enacted later in the month.
Data table for Chart 1
| March | April | |
|---|---|---|
| thousands of persons | ||
| All industries | -1,011 | -1,994 |
| Goods | -47 | -621 |
| Services | -964 | -1,373 |
| Source: Statistics Canada table 14-10-0355-01. | ||
Data table for Chart 2
| March | April | |
|---|---|---|
| thousands of persons | ||
| Youth: male | -163 | -229 |
| Youth: female | -230 | -251 |
| Core-age: male | -128 | -646 |
| Core-age: female | -299 | -491 |
| Older: male | -87 | -215 |
| Older: female | -105 | -162 |
|
Notes: Youth: 15 to 24 year olds; Core-age: 25 to 54 year olds; Older: 55 years old and over. Source: Statistics Canada, table 14-10-0287-01. |
||
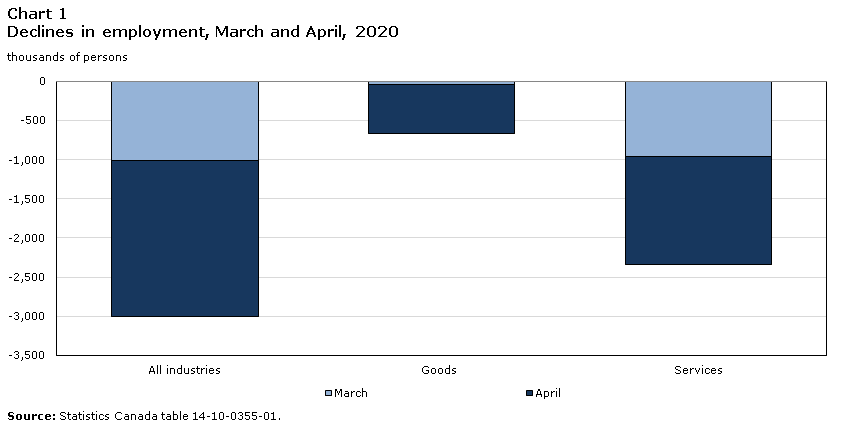
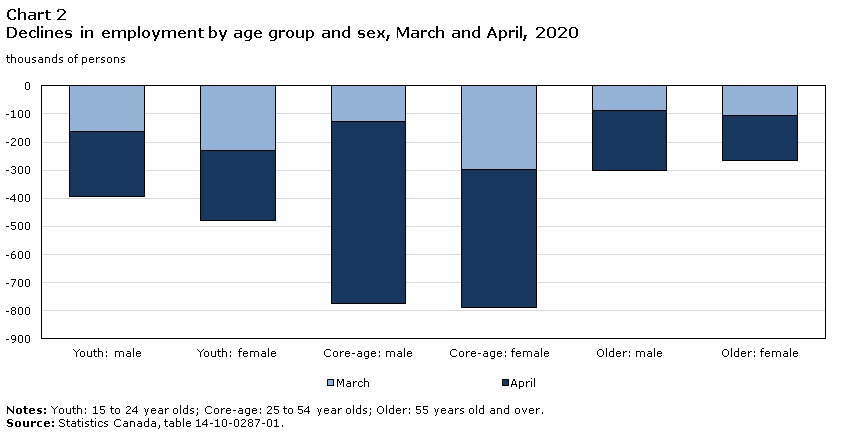
Total employment fell by more than one million in March with declines among private sector employees accounting for over 80% of total losses. Over one-half of the losses were in part-time work, while nearly all of the decline occurred in service industries, led by severe losses in accommodation and food services, and wholesale and retail trade (Chart 1). Younger workers and core-age women were more severely impacted by employment losses in March (Chart 2).
The official unemployment rate in March rose to 7.8%, a figure which, in the current context, understates the magnitude of the transitions out of employment that were occurring across service industries. If the unemployment rate was adjusted to include those who recently worked and wanted a job, but were not counted as unemployed because they did not look for a job, many presumably due to COVID-19, the unemployment rate in March would have risen to 8.9%.
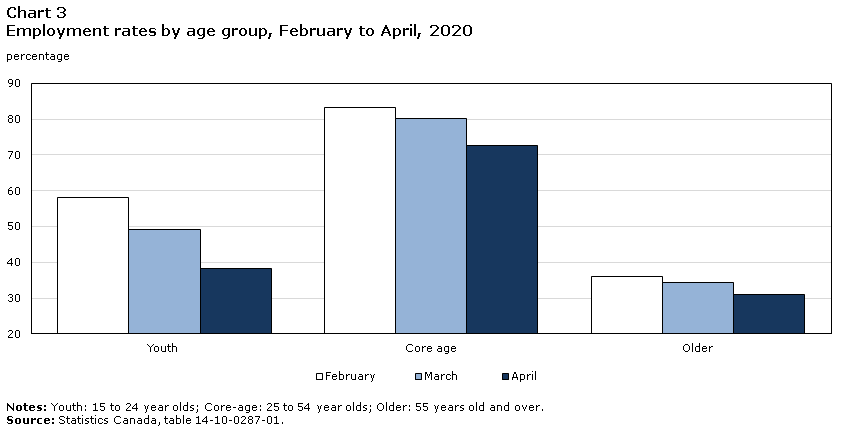
The magnitude of employment losses is more directly reflected in the employment rate, which measures the portion of the working age population that is employed. In March, the employment rate fell 3.3 percentage points to 58.5%, the lowest level since 1997. Among core-aged workers, the employment rate in March was 80.2% while their official unemployment rate rose to 6.6%.
The one-month decline in employment in March, based on data collected mid-month, is about two and a half times as large as the cumulative decline in employment observed during the 2008-2009 recession.Note From September 2008 to June 2009, overall employment fell by 400,000, as the unemployment rate rose to 8.7% and the employment rate declined to 61.3%. The employment rate among core-age workers during that nine-month period remained at or above 80%, which was similar to the rate observed in March.
April’s employment report brought the impacts of COVID-19 on the Canadian labour market into fuller view. Total employment fell by nearly two million in April, with unprecedented declines in both goods and services industries and among core-age men and women (Charts 1 and 2). Almost three-quarters of total losses were in full-time work. Overall losses in April again reflected severe declines in accommodation and food services and wholesale and retail trade, while job losses spread to construction and manufacturing.Note Employment among core-age men in April fell by 646,000, five times the loss observed among core-age men in March, while employment among core-age women fell by 491,000 in April, following losses of about 300,000 in March. Declines among youth and older workers also accelerated sharply in April.
The official unemployment rate in April rose 5.2 percentage points to 13.0%. If adjusted to include those who recently worked and wanted to work, but that did not search for work due to reasons that could be related to COVID-19, the unemployment rate would have been 17.8%.
Canada’s employment rate fell to a record low 52.1% in April, almost 10 percentage points below the rate observed in February. Among core-age workers, the employment rate in April fell to 72.6%, the lowest level since October 1984. Over three-quarters of core-age men were employed in April along with nearly seven in ten core-age women. In contrast, under four in ten youth aged 15 to 24 were employed in April, as the youth employment rate has declined almost 20 percentage points since February (Chart 3).
Data table for Chart 3
| February | March | April | |
|---|---|---|---|
| percentage | |||
| Youth | 58.0 | 49.1 | 38.2 |
| Core age | 83.1 | 80.2 | 72.6 |
| Older | 36.1 | 34.3 | 31.1 |
|
Notes: Youth: 15 to 24 year olds; Core-age: 25 to 54 year olds; Older: 55 years old and over. Source: Statistics Canada, table 14-10-0287-01. |
|||
While total employment declined by 15.7% from February to April, the contraction in labour market activity was more severe in terms of hours lost, as total hours worked fell by 27.7% over this two-month period. Service industries, led by severe declines in accommodation and food, health and social assistance services, wholesale and retail trade, and educational services, shed hours at a faster pace in March, while declines among goods industries accelerated in April, fueled by lower hours in construction and manufacturing.
Many of the largest employment losses during March and April occurred in service industries with lower average earnings and among jobs that offer less security. Large declines in employment and hours were far less apparent in higher-earning services, such as professional services, financial services and public administration, where employees often have more flexibility to work from home. The loss of disproportionately large numbers of lower-paying jobs had a marked impact on average hourly wages for the economy as a whole, which rose over 10% on a year-over-year basis in April.
The Labour Force Survey in April also asked respondents about their concerns over job security. About 40% of Canadians who were employed in April, but worked fewer than 50% of their normal hours, reported that they were concerned about losing their job within four weeks, almost four times higher than the reported rate among those whose hours worked in April were relatively unaffected. Concerns over job security were particularly evident among those working in lower-wage services such as accommodation and food services and personal care services.Note
Businesses provided information on workforce adjustments and business resiliency
Statistics Canada, in partnership with the Canadian Chamber of Commerce, conducted a special survey in April in which businesses reported on how COVID-19 has affected their operations. Representatives from more than 12,600 businesses took part in the survey.Note Nearly two-thirds of businesses indicated that they had been highly affected by lower demand for their products or services, while almost three-quarters reported that they were negatively affected by social distancing measures.
Businesses also provided information on the scope of their workforce adjustments. In qualitative terms, these adjustments closely align with data from the Labour Force Survey reported earlier. Four in ten respondents reported laying-off workers due to COVID-19, including two-thirds of businesses that provide accommodation and food services, over one-half of retailers, and about one-half of construction and manufacturing businesses. Overall, slightly more than one-quarter of respondents reported laying-off 50% or more of their workforce, including about 60% of those in accommodation and food services and 40% of retailers (Chart 4). Nearly 40% of respondents reported reducing staff hours or shifts.

Data table for Chart 4
| Percentage | |
|---|---|
| All industries | 27.2 |
| Mining, quarrying, and oil and gas extraction | 22.2 |
| Construction | 32.1 |
| Manufacturing | 26.7 |
| Retail trade | 40.4 |
| Finance and insurance | 5.3 |
| Professional scientific and technical services | 10.4 |
| Accommodation and food services | 59.4 |
|
Notes: Estimates are from crowdsourced survey data thatwere not collected using a probability-based sample design. Source: Canadian Survey on Business Conditions, March 2020. |
|
Businesses that responded to the survey also provided information on the impact that prolonged disruptions in revenue would potentially have on business viability. Respondents were asked to estimate the length of time, as of February 1st, that the business could continue to operate in the absence of any revenue source. About 4 out of 10 respondents reported that they would only be able to operate for two months or less. This includes over one-half of businesses that provide accommodation and food services (+54%) and about one-half of retailers. Smaller businesses were also more vulnerable to revenue disruptions. Among those with 5 to 19 employees, one half reported that they would only be able to operate for two months or less.Note
Declines in merchandise trade as COVID-19 impacts auto manufacturing
The potential impacts of COVID-19 on Canadian trade flows became apparent early in the year. Merchandise trade with China declined substantially in January as efforts to contain the virus in that country were intensifying and the impacts of factory shutdowns in China on global supply chains were being widely assessed. Exports to China declined 9.9% in January while imports from China fell 12.6%.
February’s trade report highlighted further declines in Canada-China trade, as exports to China fell an additional 5.4% while imports declined 6.9%. Lower imports from China in February reflected declines in computers and peripherals, cellphones, and clothing and accessories.
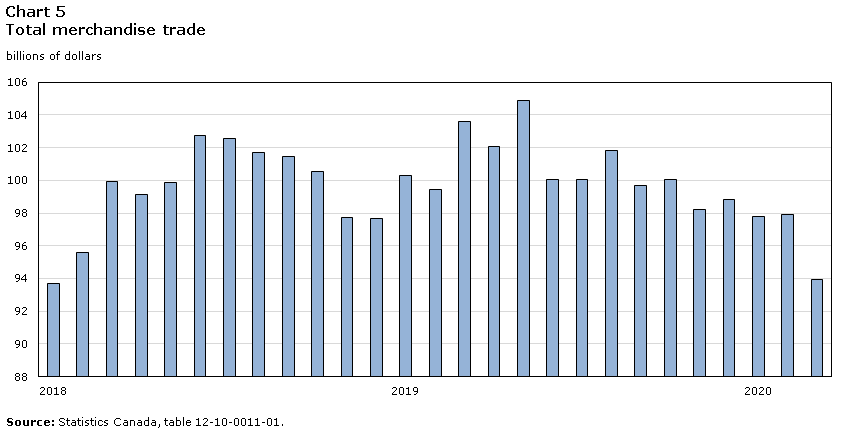
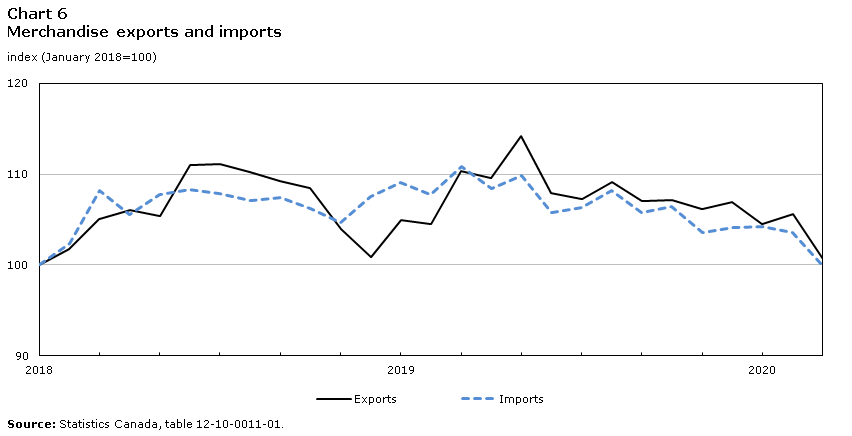
By March, the effects of COVID-19 on North American trade flows were apparent, as declines in Canada-U.S. trade pushed total Canadian merchandise trade to the lowest monthly level since January 2018 (Chart 5). Total exports fell 4.7% in March, with lower shipments to the U.S accounting for about 80% of the decline. Similarly, imports were down 3.5%, almost all on account of lower shipments from the U.S. (Chart 6).
Data table for Chart 5
| Billions of dollars | |
|---|---|
| 2018 | |
| January | 93.7 |
| February | 95.6 |
| March | 99.9 |
| April | 99.1 |
| May | 99.8 |
| June | 102.7 |
| July | 102.6 |
| August | 101.7 |
| September | 101.4 |
| October | 100.6 |
| November | 97.7 |
| December | 97.7 |
| 2019 | |
| January | 100.3 |
| February | 99.4 |
| March | 103.6 |
| April | 102.1 |
| May | 104.9 |
| June | 100.1 |
| July | 100.0 |
| August | 101.8 |
| September | 99.7 |
| October | 100.0 |
| November | 98.2 |
| December | 98.8 |
| 2020 | |
| January | 97.8 |
| February | 97.9 |
| March | 93.9 |
| Source: Statistics Canada, table 12-10-0011-01. | |
Data table for Chart 6
| Exports | Imports | |
|---|---|---|
| index (January 2018=100) | ||
| 2018 | ||
| January | 100.0 | 100.0 |
| February | 101.7 | 102.3 |
| March | 105.0 | 108.2 |
| April | 106.1 | 105.5 |
| May | 105.4 | 107.8 |
| June | 111.0 | 108.3 |
| July | 111.1 | 107.9 |
| August | 110.2 | 107.1 |
| September | 109.2 | 107.4 |
| October | 108.5 | 106.2 |
| November | 103.9 | 104.7 |
| December | 100.9 | 107.6 |
| 2019 | ||
| January | 105.0 | 109.0 |
| February | 104.5 | 107.7 |
| March | 110.3 | 110.8 |
| April | 109.6 | 108.4 |
| May | 114.2 | 109.8 |
| June | 107.9 | 105.8 |
| July | 107.2 | 106.4 |
| August | 109.2 | 108.2 |
| September | 107.0 | 105.8 |
| October | 107.1 | 106.5 |
| November | 106.1 | 103.5 |
| December | 106.9 | 104.1 |
| 2020 | ||
| January | 104.5 | 104.2 |
| February | 105.6 | 103.6 |
| March | 100.6 | 99.9 |
| Source: Statistics Canada, table 12-10-0011-01. | ||
Lower shipments of motor vehicles and parts in March contributed substantially to overall declines in merchandise trade as automakers and parts suppliers began to scale down production as public health measures to contain COVID-19 were being implemented. Declines in aircraft and aircraft equipment also contributed to lower trade flows as production in this sector was impacted by work stoppages related to COVD-19.
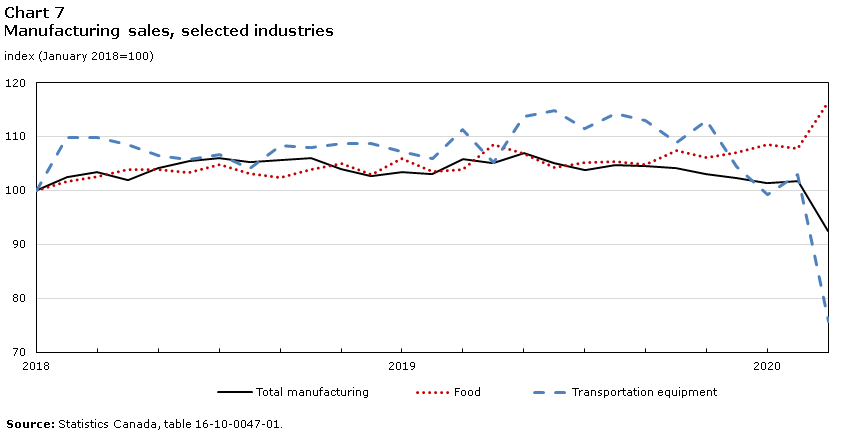
Total manufacturing sales fell 9.2% to $50.8 billion in March, the lowest level since June 2016, as over three-quarters of manufacturing establishments reported that their activities were impacted by COVID-19. Over one half of the estimated COVID-19 related decline in total manufacturing sales reflected lower sales among makers of transportation equipment. Sales of auto manufacturers and parts suppliers both fell by over 30% in March. In contrast, food manufacturers reported higher sales in March, due to an increased demand for meat and dairy products (Chart 7).
Data table for Chart 7
| Total manufacturing | Food | Transportation equipment | |
|---|---|---|---|
| index (January 2018=100) | |||
| 2018 | |||
| January | 100.0 | 100.0 | 100.0 |
| February | 102.5 | 101.6 | 109.7 |
| March | 103.5 | 102.6 | 109.8 |
| April | 101.9 | 103.9 | 108.4 |
| May | 104.1 | 103.9 | 106.4 |
| June | 105.5 | 103.2 | 105.7 |
| July | 106.0 | 104.8 | 106.7 |
| August | 105.3 | 103.2 | 104.0 |
| September | 105.7 | 102.5 | 108.3 |
| October | 106.0 | 103.8 | 107.9 |
| November | 103.9 | 105.0 | 108.8 |
| December | 102.6 | 102.9 | 108.7 |
| 2019 | |||
| January | 103.3 | 105.9 | 107.1 |
| February | 103.1 | 103.5 | 105.9 |
| March | 105.9 | 103.8 | 111.4 |
| April | 105.2 | 108.4 | 105.1 |
| May | 106.9 | 106.8 | 113.7 |
| June | 105.2 | 104.2 | 114.9 |
| July | 103.9 | 105.1 | 111.4 |
| August | 104.7 | 105.3 | 114.3 |
| September | 104.4 | 104.7 | 112.9 |
| October | 104.1 | 107.4 | 109.0 |
| November | 103.0 | 106.2 | 113.0 |
| December | 102.3 | 106.9 | 104.5 |
| 2020 | |||
| January | 101.4 | 108.6 | 99.3 |
| February | 101.8 | 107.8 | 103.0 |
| March | 92.4 | 116.6 | 75.6 |
| Source: Statistics Canada, table 16-10-0047-01. | |||
Merchandise trade and manufacturing sales are expected to continue to decline in April due to the impact of the economic shutdowns. In mid-May, Statistics Canada released Canadian merchandise import transaction counts for April. Import transactions data tend to move in the same direction as monthly merchandise trade flows, and can provide a useful indicator of the level of merchandise trade activity. The number of import transactions fell 22% in April, and was down 27% when compared to April of last year.
Headline consumer inflation decelerated at the fastest pace since 2006
March’s Consumer Price Index highlighted the impact of sharp declines in energy prices on headline consumer inflation. Lower demand for oil as the COVID-19 pandemic escalated, coupled with tensions among oil-producing countries, pushed WTI benchmark crude prices from near USD $47 per barrel in early March to just over USD $20 per barrel at month’s end. Led by lower energy prices, the all-items CPI decelerated sharply from 2.2% in February to 0.9% in March, the largest year-over-year deceleration in the headline index since September 2006. Energy prices in March posted their largest one month decrease since late 2008.
The Consumer Price Index fell 0.2% on a year-over-year basis in April as lower energy prices pushed the headline rate into negative territory for the first time since September 2009. Energy prices, measured year-over-year, were down 23.7% in April. Excluding energy prices, consumer price inflation in April was 1.6%.
Flash GDP estimates for March underscored the impact of work stoppages on output
In mid-April, Statistics Canada released a flash estimate of gross domestic product (GDP) for March, designed to provide early guidance on the impact that business shutdowns and restrictions on physical distancing were having on economic activity. The decline in real GDP in March was estimated to be about 9%, the largest monthly decrease observed for the current data series (which tracks movements back to 1961). March’s flash estimate yielded an approximate 2.6% decline in real GDP for the first quarter of 2020. The magnitude of these declines reflected the suddenness with which economic activity was impacted across a range of consumer-oriented sectors, including tourism and travel-related industries, food and accommodation, and retail. The initial impacts of shutdowns on government and educational services also contributed to lower projected output in March.
The next edition in this COVID-19 series will include an analysis of the official estimates of GDP for the first quarter along with more recent data on employment and consumer prices. The article will be released in Economic Insights in June.
References
Morissette, R. And D. Messacar. 2020. Work interruptions and financial vulnerability. STATCAN COVID-19: Data to Insights for a better Canada. Catalogue no. 45280001. Ottawa: Statistics Canada.
Statistics Canada. May 11, 2020. Impact of COVID-19 on Small Businesses in Canada. STATCAN COVID-19: Data to Insights for a better Canada. Catalogue no. 45280001. Ottawa: Statistics Canada.
Statistics Canada. May 5, 2020. Trade in medical and protective goods STATCAN COVID-19: Data to Insights for a better Canada. Catalogue no. 45280001. Ottawa: Statistics Canada.
- Date modified: