
 StatCan COVID-19: Data to Insights for a Better Canada Impact of COVID-19 on Small Businesses in Canada

Archived Content
Information identified as archived is provided for reference, research or recordkeeping purposes. It is not subject to the Government of Canada Web Standards and has not been altered or updated since it was archived. Please "contact us" to request a format other than those available.
Text begins
The Canadian economy changed dramatically in March 2020 as a result of COVID-19 and the situation has had a profound impact on the ability of businesses in Canada to operate. In order to better understand the impact of COVID-19 on businesses, employers and employees, communities and our economy, Statistics Canada and the Canadian Chamber of Commerce collaborated to launch the Canadian Survey on Business Conditions
Fully cognisant of the extreme challenges that businesses in Canada are currently facing as a result of this crisis, our innovative partnership with the Chamber was essential to leverage their extensive network to reach out to businesses across Canada to complete this survey. As a result of this collaborative effort, we were able to collect this mutually beneficial data to inform decision making and minimize response burden on businesses in Canada through this streamlined effort.
While the majority of businesses in Canada have been impacted by the COVID-19 pandemic it appears that small businesses have been hit particularly hard by this crisis.
For information on support measures please visit Canada’s COVID-19 Economic Response Plan.
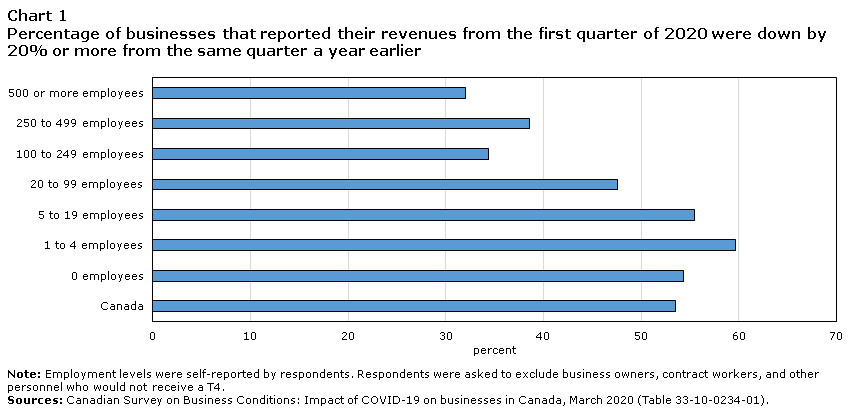
Revenues: Small businesses were more likely than those with 100+ employees to report that their revenues from Q1-2020 were down by 20% or more from Q1-2019.
32.0% of businesses with 500 or more employees reported declines in revenue of 20% or more. This figure almost doubles for smaller businesses where nearly 60% of those with 1 to 4 employees and nearly 56% of those with 5 to 19 employees reported declines in revenue 20% or more.
Data table for Chart 1
| Percentage of businesses that reported their revenues from the first quarter of 2020 were down by 20% or more from the same quarter a year earlier | |
|---|---|
| Canada | 53.5 |
| 0 employees | 54.3 |
| 1 to 4 employees | 59.6 |
| 5 to 19 employees | 55.5 |
| 20 to 99 employees | 47.6 |
| 100 to 249 employees | 34.4 |
| 250 to 499 employees | 38.6 |
| 500 or more employees | 32.0 |
|
Note: Employment levels were self-reported by respondents. Respondents were asked to exclude business owners, contract workers, and other personnel who would not receive a T4. Source: 33-10-0234-01 |
|
Layoffs: Small businesses with less than 100 employees that laid off at least one employee, were more likely to have laid off more than 80% of their workforce.
Nationally, nearly 41% of businesses reported that they laid off staff. Of those businesses that laid off at least one employee, 45% laid off 80% or more of their workforce.
47% of small businesses with 5 to 19 employees that laid off at least one employee, laid off 80% or more of their staff. In comparison, 18% of businesses with 500+ employees and nearly 30% of businesses with 100+ employees that laid off at least one employee, laid off 80% or more of their staff.

Data table for Chart 2
| Percentage of businessses that laid off staff | Of businesses that laid off at least one employee, percentage that laid off more than 80% of their workforce | |
|---|---|---|
| Canada | 40.5 | 45.2 |
| 0 employees | 5.1 | 72.5 |
| 1 to 4 employees | 31.4 | 58.0 |
| 5 to 19 employees | 58.5 | 47.2 |
| 20 to 99 employees | 61.7 | 35.7 |
| 100 to 249 employees | 54.5 | 29.0 |
| 250 to 499 employees | 49.3 | 30.0 |
| 500 or more employees | 50.6 | 18.4 |
|
Note: Employment levels were self-reported by respondents. Respondents were asked to exclude business owners, contract workers, and other personnel who would not receive a T4. Sources: 33-10-0231-01 and 33-10-0232-01 |
||
Credit: Small businesses were more likely to request credit from financial institutions to cover operating costs due to COVID-19.
40% of small businesses with 5 to 19 employees reported that they requested credit from a financial institution, while nearly 31% of small businesses with 20 to 99 employees requested credit from a financial institution.
These types of small businesses were most likely to request credit to cover operating costs due to revenue shortfalls caused by COVID-19, in comparison to larger enterprises that responded to the survey.

Data table for Chart 3
| Percentage of businesses that requested credit from a financial institution | |
|---|---|
| Canada | 28.6 |
| 0 employees | 14.8 |
| 1 to 4 employees | 28.1 |
| 5 to 19 employees | 40.0 |
| 20 to 99 employees | 30.5 |
| 100 to 249 employees | 22.8 |
| 250 to 499 employees | 23.8 |
| 500 or more employees | 14.8 |
|
Note: Employment levels were self-reported by respondents. Respondents were asked to exclude business owners, contract workers, and other personnel who would not receive a T4. Source: 33-10-0241-01 |
|
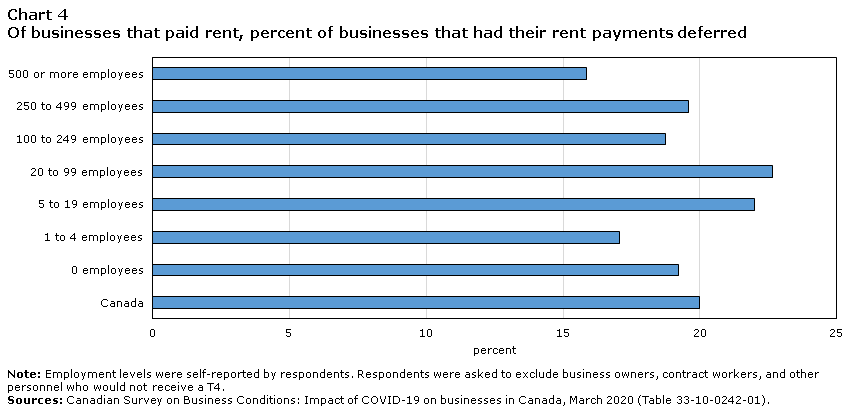
Rent Deferral: Small businesses were slightly more likely to have their rent deferred.
In terms of businesses that pay rent, 20% reported that they had their rent deferred.
In comparison, 22% of businesses with 5 to 19 employees and nearly 23% of businesses with 20 to 99 employees had their rent deferred.
Data table for Chart 4
| Of businesses that paid rent, % of businesses that had their rent payments deferred | |
|---|---|
| Canada | 20.0 |
| 0 employees | 19.2 |
| 1 to 4 employees | 17.1 |
| 5 to 19 employees | 22.0 |
| 20 to 99 employees | 22.7 |
| 100 to 249 employees | 18.7 |
| 250 to 499 employees | 19.6 |
| 500 or more employees | 15.8 |
|
Note: Employment levels were self-reported by respondents. Respondents were asked to exclude business owners, contract workers, and other personnel who would not receive a T4. Source(s): 33-10-0242-01 |
|
Methodology
From April 3 to 24, 2020, representatives from more than 12,600 businesses visited Statistics Canada's website and took part in the online questionnaire about how COVID-19 is affecting their business.
Please note that unlike other surveys conducted by Statistics Canada, crowdsourcing data are not collected using a probability-based sample design. As a result, the findings reported cannot be applied to the overall Canadian economy.
References
Statistics Canada - Canadian Survey on Business Conditions: Impact of COVID-19 on businesses in Canada, March 2020
- Date modified: