
Analysis in Brief
Gross domestic product, 2022: An in-depth look at provincial and territorial economies
Skip to text
Text begins
Acknowledgements
The author would like to thank analysts in the provincial and territorial gross domestic product by industry program (David Connell, Francois Crépin, Mary Joseph, Nathan Keen, Serge Larocque, Dérek Nolet Regaudie, Eveline Yeung, and Abdifatah Yussuf) for their contributions to the text and Karan Landge for his helpful review and comments.
Abstract
In 2022, real gross domestic product (GDP) rose in all provinces and territories except for Newfoundland and Labrador as outlined in Gross domestic product by industry: Provinces and territories, 2022. Newfoundland and Labrador, Saskatchewan and Northwest Territories GDP remained below their respective pre-pandemic levels. This text serves as a more in-depth look into the largest contributors and detractors to growth in each province and territory and supports the data published in the May 1, 2023, Daily release.
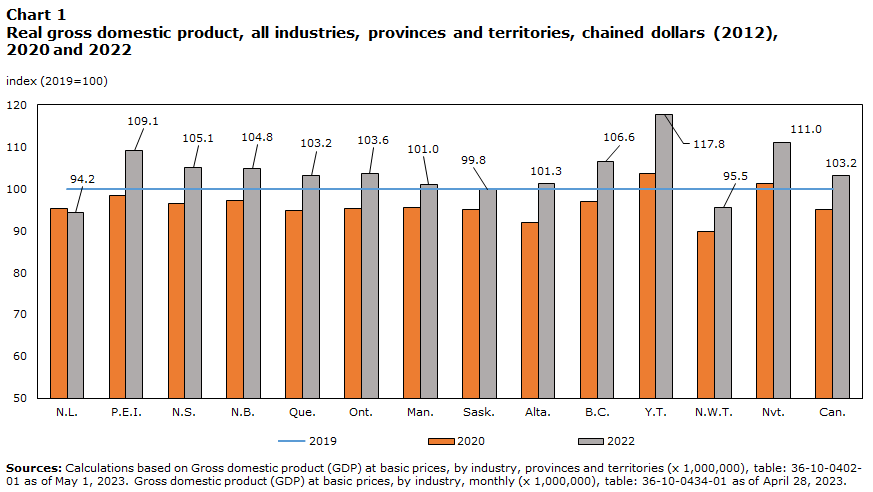
Data table for Chart 1
| Geography | 2019 | 2020 | 2022 |
|---|---|---|---|
| index (2019=100) | |||
| N.L. | 100 | 95.3 | 94.2 |
| P.E.I. | 100 | 98.3 | 109.1 |
| N.S. | 100 | 96.4 | 105.1 |
| N.B. | 100 | 97.2 | 104.8 |
| Que. | 100 | 94.9 | 103.2 |
| Ont. | 100 | 95.2 | 103.6 |
| Man. | 100 | 95.6 | 101.0 |
| Sask. | 100 | 95.0 | 99.8 |
| Alta. | 100 | 91.9 | 101.3 |
| B.C. | 100 | 96.9 | 106.6 |
| Y.T. | 100 | 103.7 | 117.8 |
| N.W.T. | 100 | 89.8 | 95.5 |
| Nvt. | 100 | 101.2 | 111.0 |
| Can. | 100 | 94.9 | 103.2 |
| Sources: Calculations based on Gross domestic product (GDP) at basic prices, by industry, provinces and territories (x 1,000,000), table: 36-10-0402-01 as of May 1, 2023. Gross domestic product (GDP) at basic prices, by industry, monthly (x 1,000,000), table: 36-10-0434-01 as of April 28, 2023. | |||
Outside of Ontario, ranking among top contributors to national growth varied from 2021
Given its relative size, the largest contributor to the national GDP increase of 3.6% was Ontario (1.4 percentage points). Alberta (0.8 percentage points) exhibited economy-wide growth that included continued strength in the oil and gas sector, allowing it to surpass both Quebec and British Columbia which both contributed 0.5 percentage points to national growth. A year after ranking last in GDP growth, Saskatchewan (0.2 percentage points) jumped to 5th, largely due to a strong recovery in agriculture.
In 2022, all provinces and territories surpassed their pre-pandemic employment levels. Prince-Edward-Island and New-Brunswick were the only two provinces reaching this milestone in 2021 according to the Survey of Employment, Payrolls and Hours (SEPH).
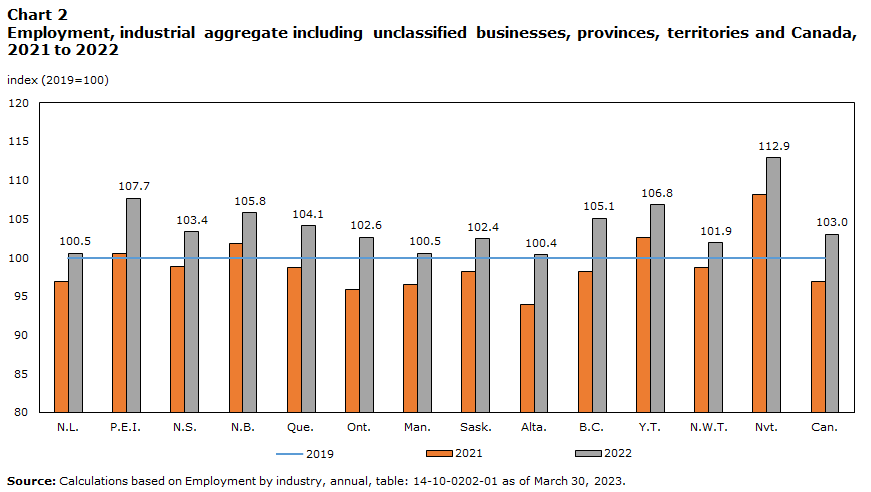
Data table for Chart 2
| Geography | 2019 | 2021 | 2022 |
|---|---|---|---|
| index (2019=100) | |||
| N.L. | 100 | 96.9 | 100.5 |
| P.E.I. | 100 | 100.5 | 107.7 |
| N.S. | 100 | 98.8 | 103.4 |
| N.B. | 100 | 101.8 | 105.8 |
| Que. | 100 | 98.7 | 104.1 |
| Ont. | 100 | 95.8 | 102.6 |
| Man. | 100 | 96.5 | 100.5 |
| Sask. | 100 | 98.1 | 102.4 |
| Alta. | 100 | 93.9 | 100.4 |
| B.C. | 100 | 98.2 | 105.1 |
| Y.T. | 100 | 102.6 | 106.8 |
| N.W.T. | 100 | 98.8 | 101.9 |
| Nvt. | 100 | 108.2 | 112.9 |
| Can. | 100 | 96.9 | 103.0 |
| Source: Calculations based on Employment by industry, annual, table: 14-10-0202-01 as of March 30, 2023. | |||
Job vacancies remained well above 2019 levels even as most economic regions registered a decline or held steady in the fourth quarter of 2022.
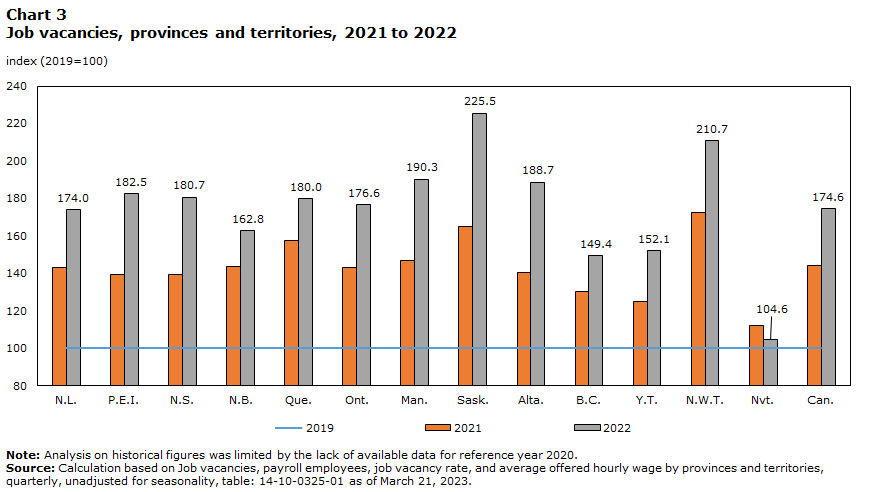
Data table for Chart 3
| Geography | 2019 | 2021 | 2022 |
|---|---|---|---|
| index (2019=100) | |||
| N.L. | 100 | 143.0 | 174.0 |
| P.E.I. | 100 | 139.3 | 182.5 |
| N.S. | 100 | 139.4 | 180.7 |
| N.B. | 100 | 143.5 | 162.8 |
| Que. | 100 | 157.5 | 180.0 |
| Ont. | 100 | 142.9 | 176.6 |
| Man. | 100 | 147.1 | 190.3 |
| Sask. | 100 | 165.2 | 225.5 |
| Alta. | 100 | 140.2 | 188.7 |
| B.C. | 100 | 130.2 | 149.4 |
| Y.T. | 100 | 124.8 | 152.1 |
| N.W.T. | 100 | 172.3 | 210.7 |
| Nvt. | 100 | 112.4 | 104.6 |
| Can. | 100 | 144.2 | 174.6 |
|
Note: Analysis on historical figures was limited by the lack of available data for reference year 2020. Source: Calculation based on Job vacancies, payroll employees, job vacancy rate, and average offered hourly wage by provinces and territories, quarterly, unadjusted for seasonality, table: 14-10-0325-01 as of March 21, 2023. |
|||
International travel increased in 2022 as the federal government lifted all remaining COVID-19 border and travel restrictions. These changes aided the recovery in services-related industries such as air transportation following the decreases of the previous two years. The accommodation and food services sector grew in all provinces and territories led by traveller accommodation and food services and drinking places, as the curtailment of pandemic restrictions permitted the return of customers in person.
Real estate and rental and leasing decelerated in most jurisdictions when compared to 2021. Mortgage rates were higher in 2022 as the conventional mortgage lending rate (5-year term) reached 5.89% in December 2022, as compared to 3.45% a year earlier, impacting home sales activity. GDP in residential construction decreased in most jurisdictions except for some of the Atlantic provinces and Alberta. All jurisdictions except for Newfoundland and Labrador registered lower growth in the value of building permits for 2022.
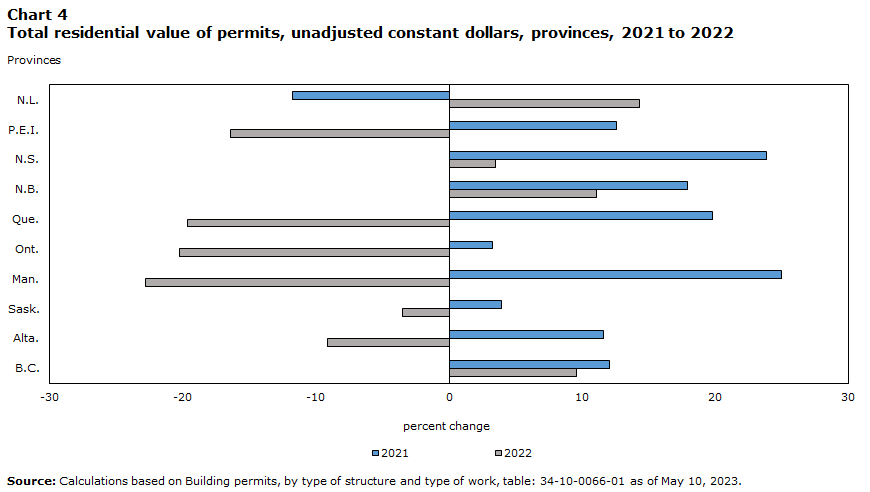
Data table for Chart 4
| Provinces | 2021 | 2022 |
|---|---|---|
| percent change | ||
| N.L. | -11.7 | 14.3 |
| P.E.I. | 12.6 | -16.4 |
| N.S. | 23.9 | 3.5 |
| N.B. | 17.9 | 11.0 |
| Que. | 19.7 | -19.6 |
| Ont. | 3.2 | -20.3 |
| Man. | 24.9 | -22.8 |
| Sask. | 3.9 | -3.5 |
| Alta. | 11.6 | -9.1 |
| B.C. | 12.0 | 9.5 |
| Source: Calculations based on Building permits, by type of structure and type of work, table: 34-10-0066-01 as of May 10, 2023. | ||
Hurricane Fiona hit the Atlantic Provinces in September 2022 and affected several sectors of the economy with temporary shutdowns. In the manufacturing sector, the seafood product preparation and packaging industry declined among all Atlantic provinces, resulting in a double-digit decline at the national level. In New Brunswick, the industry suffered its first double-digit decline since 2008 and strongest decline on record.
| Geography | 2018 | 2019 | 2020 | 2021 | 2022 |
|---|---|---|---|---|---|
| percent change | |||||
| N.L. | -8.6 | 1.9 | 0.0 | 28.1 | -15.0 |
| P.E.I. | -17.3 | -5.8 | -10.8 | 33.5 | -21.0 |
| N.S. | 7.9 | 1.0 | -4.0 | 15.1 | -3.8 |
| N.B. | 9.5 | -6.9 | -8.9 | 39.0 | -24.9 |
| Source: Gross domestic product (GDP) at basic prices, by industry, provinces and territories, growth rates (x 1,000,000), table: 36-10-0402-02 as of May 1, 2023. | |||||
Newfoundland and Labrador’s GDP declined on lower oil production
Newfoundland and Labrador’s GDP declined 1.7% in 2022 following growth of 0.6% in 2021. Goods-producing industries fell 6.3% while services-producing industries rose 2.4% as 13 of 15 sectors increased.
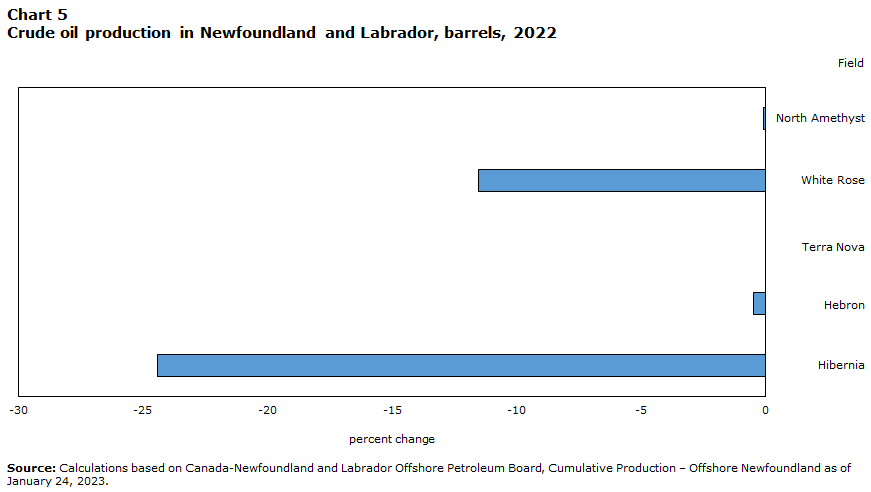
Data table for Chart 5
| Field | 2022 |
|---|---|
| percent change | |
| North Amethyst | -0.1 |
| White Rose | -11.5 |
| Terra Nova | 0.0 |
| Hebron | -0.5 |
| Hibernia | -24.4 |
| Source: Calculations based on Canada-Newfoundland and Labrador Offshore Petroleum Board, Cumulative Production – Offshore Newfoundland as of January 24, 2023. | |
The oil and gas extraction subsector plays a key role in the economic health of the province. In 2022, the subsector fell 10.4% as production at the Hibernia platform declined due to planned turnaround activities in the third and fourth quarters of the year and Terra Nova remained overseas for maintenance. Copper, nickel, lead and zinc ore mining declined 41.2% as the Voisey’s Bay open-pit operation slowed down and its underground mine expansions continued to ramp up, but were not yet at full production. Iron ore rose 1.2%, offsetting some of the decline in the sector.

Data table for Chart 6
| North American Industry Classification | 2013 | 2014 | 2015 | 2016 | 2017 | 2018 | 2019 | 2020 | 2021 | 2022 |
|---|---|---|---|---|---|---|---|---|---|---|
| contribution to percentage change | ||||||||||
| All industries | 5.034 | -1.090 | -1.083 | 1.545 | 1.253 | -2.849 | 3.981 | -4.730 | 0.607 | -1.689 |
| Oill and gas extraction | 3.079 | -1.601 | -3.237 | 2.403 | 0.879 | 0.612 | 2.625 | 1.190 | -1.722 | -2.307 |
| Source: Gross domestic product (GDP) at basic prices, by industry, provinces and territories (x 1,000,000), table: 36-10-0402-01 as of May 1, 2023. | ||||||||||
Construction grew 1.9% after two consecutive years of decline. The growth in the sector was led by residential construction (+11.7%) and engineering construction (+4.1%).
Manufacturing dropped 2.9% led by seafood product preparation and packaging (-15.0%) due to shutdowns, pricing disputes and Hurricane Fiona.
Professional, scientific and technical services gained 8.7% with seven of nine industries increasing. Transportation and warehousing grew 11.0%, in line with the national increase. Accomodation and food services maintained a similar growth to the previous year (+16.1%). Public administration rose 1.6% led by federal government public administration with growth of 3.6% following an 18.5% gain in 2021. Retail and wholesale trade slowed and were unable to sustain momentum from 2021 with an increase of 0.8% and a decline of 4.8%, respectively. The retail sector’s growth was the weakest since posting a decline in 2018.
Prince Edward Island maintained its rapid population ascent
The Prince Edward Island economy rose 2.9% in 2022, the fastest growth rate in the Atlantic provinces, following 7.9% in 2021.
Prince Edward Island’s population grew 3.6% in 2022. This was the highest growth rate for the province on record. The province’s population averaged 2.4% growth from 2016 to 2022 and has registered the strongest overall growth among all provinces since 2017, and since 2015 among the Atlantic provinces.

Data table for Chart 7
| Geography | 2019 | 2020 | 2021 | 2022 |
|---|---|---|---|---|
| percent change | ||||
| N.L. | -0.4 | -0.4 | -0.2 | 1.1 |
| P.E.I. | 2.6 | 2.5 | 2.1 | 3.6 |
| N.S. | 1.2 | 1.2 | 1.0 | 2.9 |
| N.B. | 0.9 | 0.8 | 0.9 | 2.7 |
| Source: Calculations based on Population estimates, annual, table: 17-10-0005-01 as of December 21, 2022. | ||||
The consumer price index (CPI) continued to rise in 2022, and Prince Edward Island experienced the fastest growth among provinces. The main product groups with the largest year-over-year increase were energy as well as transportation while gasoline experienced an unprecedented high growth in 2021, and continued to spike in 2022.
Services-producing industries (+3.6%) led the economic growth of the province with contributions from accommodation and food services (+22.0%), and public administration (+4.6%). The province recorded the highest growth rate in real estate and rental and leasing (+3.8%) among the Atlantic provinces for a sixth year in a row.
Goods-producing industries expanded 1.0% in 2022, led by the manufacturing sector (+6.6%). Most of the main contributing manufacturing subsectors specific to the province experienced robust growth, including chemical manufacturing (+16.6%), food manufacturing (+3.7%), and transportation equipment manufacturing (+10.3%). Food manufacturing managed to register growth despite the decline in the seafood product preparation and packaging industry (see table 1).
Nova Scotia registered a second year of two-digit growth in construction
Nova Scotia’s GDP grew 2.6% in 2022. The services-producing industries expanded 2.6%, with 13 out of 15 sectors rising in 2022. Meanwhile, the goods-producing industries advanced 2.5%, despite only two out of five sectors increasing in 2022.
On the goods-producing side, the construction sector generated the largest contribution to growth, helped by engineering construction and residential building construction. Demand for housing was kept up by population growth with investment in residentilal building construction recording double-digit growth.
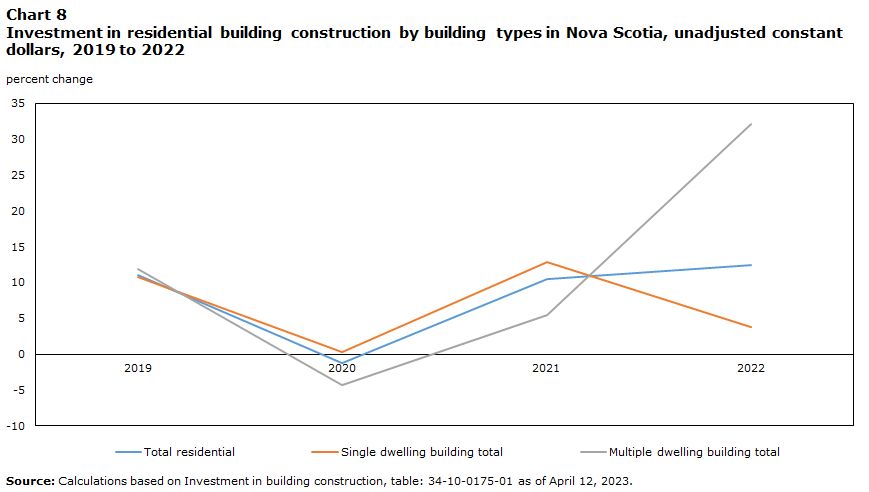
Data table for Chart 8
| Building types | 2019 | 2020 | 2021 | 2022 |
|---|---|---|---|---|
| percent change | ||||
| Total residential | 11.1 | -1.2 | 10.5 | 12.4 |
| Single dwelling building total | 10.7 | 0.3 | 12.8 | 3.8 |
| Multiple dwelling building total | 11.9 | -4.3 | 5.4 | 32.2 |
| Source: Calculations based on Investment in building construction, table: 34-10-0175-01 as of April 12, 2023. | ||||
Among the services-producing industries, professional, scientific, and technical services grew 7.0%, primarily supported by computer systems design and related services. Accomodation and food services (+18.1%) and real estate and rental leasing (+1.7%) contributed to the province’s economy.
Educational services expanded 3.3% with significant increases in enrollment, aligned with the rise in population from immigration and interprovincial migration to the province. Public administration grew 1.6%, helped by federal government public administration, and local, municipal, regional, and aboriginal public administration. Additionally, health care and social assistance increased 1.5% despite being challenged by significant shortages of health care professionals.
Wholesale trade was the largest detractor to growth among the services-producing industries, mainly resulting from declines in the food, beverage, and tobacco merchant wholesalers industry.
New Brunswick’s public administration contributed the most to its economy in 2022
New Brunswick’s GDP increased 1.8% in 2022 following a growth of 5.8% in 2021. Services-producing industries rose 2.1% as 12 of its 15 sectors grew, while goods-producing industries increased 1.1%.
Among the services-producing industries, public administration was up 3.4%, mainly due to the federal government public administration (except defence). Educational services (+4.1%) were up as universities and elementary and secondary schools recorded gains.

Data table for Chart 9
| North American Industry Classification | 2022 |
|---|---|
| constribution to percentage change | |
| Educational services | 0.243 |
| Health care and social assistance | 0.127 |
| Public administration | 0.392 |
| Source: Calculations based on Gross domestic product (GDP) at basic prices, by industry, provinces and territories, table: 36-10-0402-01 as of May 1, 2023. | |
The increase in goods-producing industries was led by the construction sector (+3.5%) where engineering construction rose 9.4%. Additionally, residential building construction (+4.9%) added a sixth consecutive year of gains. Higher output was also recorded in agriculture, forestry, fishing and hunting (+3.2%), where crop production rose 29.2% on the heels of 23.5% growth in 2021.
Partially offsetting these gains, mining and quarrying (except oil and gas) contracted 18.9% as the Caribou mine shut down early in 2022. Manufacturing fell 1.1% with close to half of the subsectors declining.
Quebec’s services-producing industries supported its economic activity
GDP increased by 2.6% in 2022 as economic activity rose in 16 of 20 sectors. Both goods and services-producing industries registered increases, however goods-producing industries still remained slightly below their pre-pandemic level.
The services-producing industries continued to rise (+3.3%), mainly due to professional, scientific and technical services (+6.7%), transportation and warehousing (+11.4%), and accommodation and food services (+25.9%). Among these sectors, only professional, scientific and technical services surpassed its pre-pandemic level.
The goods-producing industries increased (+0.8%), mainly due to the manufacturing sector (+2.8%), which was led by machinery manufacturing (+10.2%), transportation equipment (+3.6%) and wood products manufacturing (+5.1%) subsectors.
The construction sector experienced a decline of 2.3% in 2022, primarily as a result of residential building construction (-10.2%). The industry was partly impacted by the rise of interest rates and construction costs. Although a rise in price was observed in Montréal, the building construction price index in the Montréal census metropolitan area was one of the lowest when compared to other census metropolitan areas.
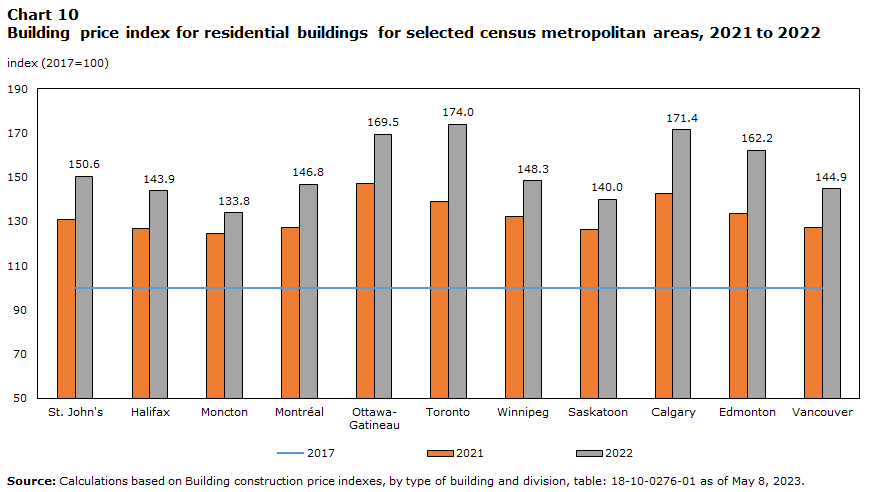
Data table for Chart 10
| Geography | 2017 | 2021 | 2022 |
|---|---|---|---|
| index (2017=100) | |||
| St. John's | 100 | 130.8 | 150.6 |
| Halifax | 100 | 127.0 | 143.9 |
| Moncton | 100 | 124.7 | 133.8 |
| Montréal | 100 | 127.4 | 146.8 |
| Ottawa-Gatineau | 100 | 147.1 | 169.5 |
| Toronto | 100 | 139.0 | 174.0 |
| Winnipeg | 100 | 132.2 | 148.3 |
| Saskatoon | 100 | 126.4 | 140.0 |
| Calgary | 100 | 142.6 | 171.4 |
| Edmonton | 100 | 133.7 | 162.2 |
| Vancouver | 100 | 127.2 | 144.9 |
| Source: Calculations based on Building construction price indexes, by type of building and division, table: 18-10-0276-01 as of May 8, 2023. | |||
The effects on housing starts and investment in residential and non-residential building construction were felt after the onset of these factors.

Data table for Chart 11
| Building construction indicators | 2018 | 2019 | 2020 | 2021 | 2022 |
|---|---|---|---|---|---|
| percent change | |||||
| Housing starts | 0.8 | 2.3 | 12.7 | 25.4 | -15.8 |
| Mortgage rates (5-year term) | 15.1 | -2.6 | -12.5 | -11.8 | 49.8 |
| Building permits | 12.4 | 2.8 | -12.0 | 28.5 | -14.4 |
|
Sources: Calculations based on Canada Mortgage and Housing Corporation, housing starts, under construction and completions, all areas, quarterly, table: 34-10-0135-01 as of April 19, 2023. Calculations based on Canada Mortgage and Housing Corporation, conventional mortgage lending rate, 5-year term, monthly, table: 34-10-0145-01 as of May 15, 2023. Calculations based on building permits, by type of structure and type of work, unadjusted constant dollars, total residential and non-residential, value of permits, monthly, table: 34-10-0066-01 as of May 10, 2023. |
|||||
Ontario returned to pre-pandemic levels for most services-producing industries
Ontario’s economy grew 3.6% in 2022, after growing 5.1% in 2021 and expanded above the pre-pandemic level.
Services-producing industries grew 4.1% and were responsible for nine tenths of the province’s economic growth. Nevertheless, five of 15 services sectors had yet to surpass their pre-pandemic levels.
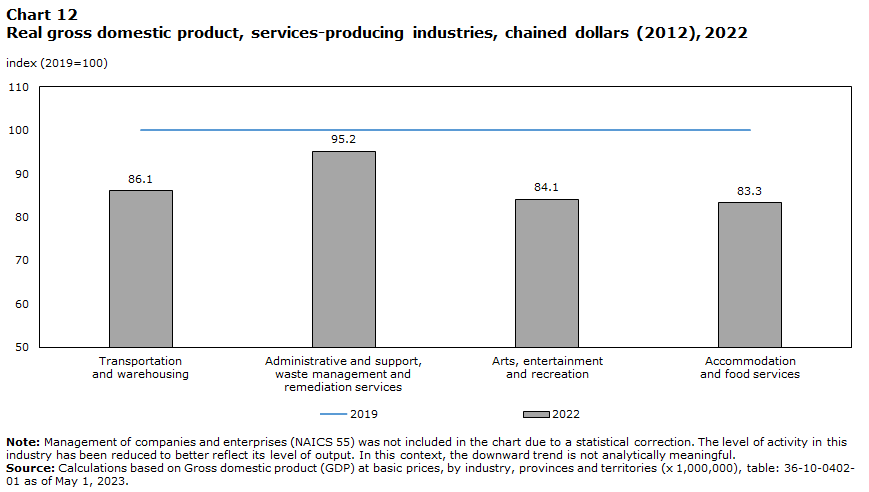
Data table for Chart 12
| North American Industry Classification | 2019 | 2022 |
|---|---|---|
| index (2019=100) | ||
| Transportation and warehousing | 100 | 86.1 |
| Administrative and support, waste management and remediation services | 100 | 95.2 |
| Arts, entertainment and recreation | 100 | 84.1 |
| Accommodation and food services | 100 | 83.3 |
|
Note: Management of companies and enterprises (NAICS 55) was not included in the chart due to a statistical correction. The level of activity in this industry has been reduced to better reflect its level of output. In this context, the downward trend is not analytically meaningful. Source: Calculations based on Gross domestic product (GDP) at basic prices, by industry, provinces and territories (x 1,000,000), table: 36-10-0402-01 as of May 1, 2023. |
||
Leading the contribution to GDP growth in the services industries was professional, scientific and technical services (+8.6%), where computer systems design and related services continued to lead job creation in Canada. Gains were also recorded in accomodation and food services (+24.9%) health care and social assistance (+3.5%), and public administration (+3.3%).
Arts, entertainment and recreation was up 49.6%, helped by performing arts, spectator sports and related industries, and heritage institutions (+57.0%) as fans returned in large numbers to professional sporting events when restrictions on attendance due to COVID-19 were lifted. Amusement, gambling and recreation industries (+43.5%) also ascended after the province launched its online gambling market in 2022.
Goods-producing industries grew 1.6% helped by increases in all sectors except construction. Manufacturing grew 4.5%, led by transportation equipment manufacturing (+11.3%) with improvements to the supply chain.
Manitoba registered highest annual growth since 2000
In Manitoba, GDP grew 3.9% in 2022 recovering above its 2019 level with the strong performance of both goods-producing (+7.8%) and services-producing (+2.4%) industries.
Higher precipitation, following a severe drought in 2021, helped boost the production of Manitoba’s principal field crops in 2022. This supported a marked turnaround for the agriculture, forestry, fishing and hunting sector (+20.7%), making it the top contributing sector to the province’s economy last year.
| Geography | Crops | 2018 | 2019 | 2020 | 2021 | 2022 |
|---|---|---|---|---|---|---|
| percent change | ||||||
| Manitoba | Canola (rapeseed) | 5.4 | -7.9 | 4.4 | -21.2 | 14.4 |
| Corn for grain | -5.5 | -1.2 | -3.8 | -11.9 | 32.5 | |
| Oats | -13.6 | 12.0 | 40.7 | -31.4 | 52.5 | |
| Soybeans | -22.9 | -35.2 | 3.6 | -12.6 | 29.8 | |
| Wheat, all | 7.1 | 5.4 | 4.4 | -28.7 | 26.5 | |
| Saskatchewan | Barley | 9.7 | 29.4 | -1.4 | -43.0 | 42.1 |
| Canola (rapeseed) | 0.0 | 0.8 | -3.7 | -38.4 | 41.0 | |
| Lentils | -13.2 | 10.9 | 13.0 | -43.1 | 38.2 | |
| Oats | -15.1 | 31.2 | 3.7 | -49.8 | 122.7 | |
| Soybeans | -51.6 | -53.8 | -35.8 | -35.3 | -17.1 | |
| Wheat, all | 12.8 | 3.3 | 5.7 | -45.6 | 67.2 | |
| Alberta | Barley | 2.3 | 24.0 | 6.6 | -30.9 | 47.5 |
| Canola (rapeseed) | -14.0 | -9.4 | -2.0 | -16.7 | 28.8 | |
| Oats | 14.9 | 19.2 | -3.9 | -31.8 | 92.9 | |
| Wheat, all | 0.3 | 2.6 | 7.6 | -42.3 | 77.9 | |
| Source: Calculations based on estimated Areas, yield, production, average farm price and total farm value of principal field crops, in metric and imperial units, table: 32-10-0359-01 as of April 26, 2023. | ||||||
The utilities sector (+22.3%) also benifitted from the wetter weather as more electricity was generated at hydroelectric powerplants.
The manufacturing sector grew 5.9% led by furniture and related product (+42.4%) and food manufacturing (+6.0%), which were partly offset by a decrease in transportation equipment manufacturing (-4.9%). The construction sector decreased 2.1%, the fourth consecutive year of contraction.
On the services-producing industries side, 12 out of 15 sectors grew in 2022. The main contributors to growth were public administration (+4.3%), transportation and warehousing (+5.2%) and accommodation and food services (+18.6%). Retail trade grew 0.3% while wholesale trade decreased 4.5%.
Saskatchewan’s economy registered highest growth in 2022 among all jurisdictions
In Saskatchewan, GDP grew by 5.7% in 2022 following three consecutive years of decline. The province's economy reached its highest growth rate since 2013 making up for almost all lost ground since 2018. Goods-producing industries contributed 4.3 times more to the province’s growth than services-producing industries, with two thirds of that coming from the agriculture, forestry, fishing and hunting sector’s rebound from the drought experienced in 2021.
The GDP of all five goods-producing sectors increased. The mining and quarrying (excluding oil and gas extraction) subsector grew by 4.0% in 2022 as the international geopolitical situation following Russia’s invasion of Ukraine put strong upward pressure on the price of potash. The price index for international exports surged 74.8% making it the strongest year over year jump on record for the commodity.
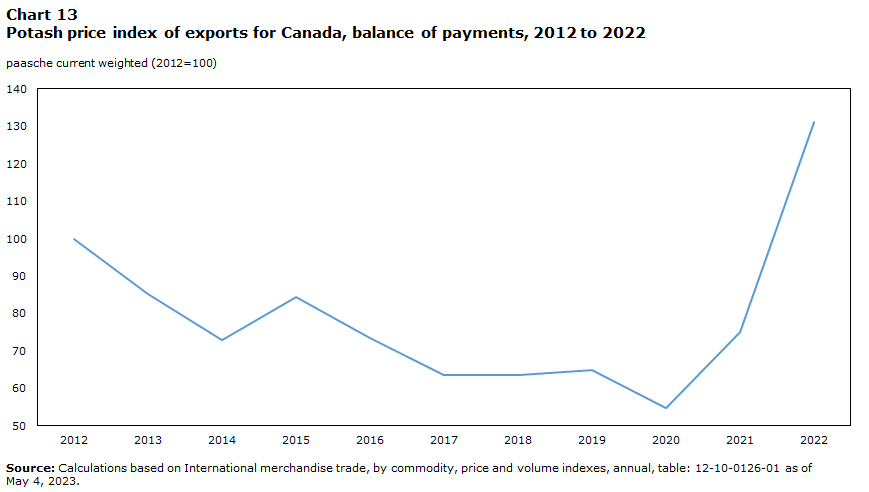
Data table for Chart 13
| Commodity | Potash |
|---|---|
| paasche current weighted (2012=100) | |
| 2012 | 100 |
| 2013 | 85.3 |
| 2014 | 72.9 |
| 2015 | 84.5 |
| 2016 | 73.5 |
| 2017 | 63.6 |
| 2018 | 63.6 |
| 2019 | 65.0 |
| 2020 | 54.6 |
| 2021 | 75.0 |
| 2022 | 131.1 |
| Source: Calculations based on International merchandise trade, by commodity, price and volume indexes, annual, table: 12-10-0126-01 as of May 4, 2023. | |
The oil and gas extraction subsector grew 1.9% with increased production of crude oil. The construction sector was up 8.1% following seven consecutive years of decline, supported in part by the acceleration in construction of some mining development projects. Manufacturing increased by 1.4% led by machinery manufacturing (+39.6%).
Growth was observed in 12 of the 15 services-producing industry sectors. Real estate and rental and leasing (+1.5%), professional, scientific and technical services (+5.6%), accommodation and food services (12.3%), and public administration (+2.3%) contributed the most to growth. Wholesale trade and retail trade both declined 0.2%.
Alberta was second among Canadian provinces and territories for its contribution to the national percentage change
Alberta’s GDP increased 5.1% in 2022. The economic advancement was broad-based, driven by increases in 19 of the 20 sectors and resulting in total provincial output exceeding its 2019 level.
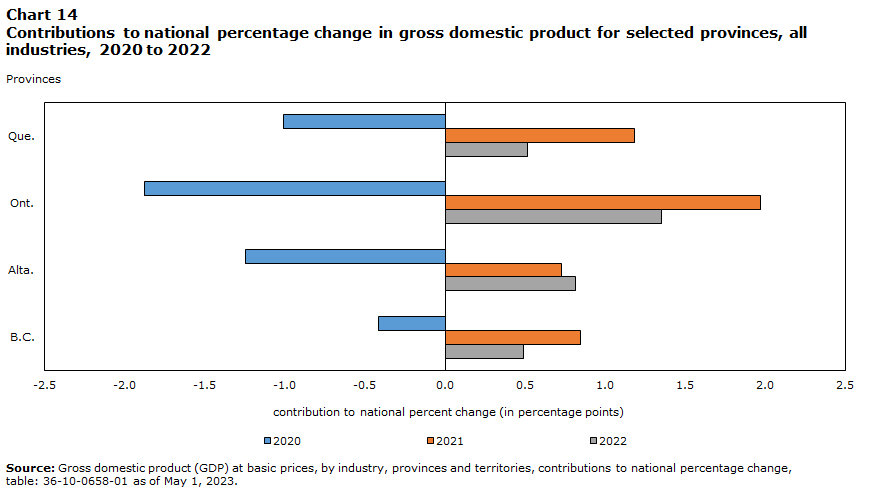
Data table for Chart 14
| Provinces | 2020 | 2021 | 2022 |
|---|---|---|---|
| contribution to national percentage change | |||
| Que. | -1.007 | 1.182 | 0.511 |
| Ont. | -1.875 | 1.965 | 1.352 |
| Alta. | -1.243 | 0.728 | 0.813 |
| B.C. | -0.416 | 0.845 | 0.489 |
| Source: Gross domestic product (GDP) at basic prices, by industry, provinces and territories, contributions to national percentage change, table: 36-10-0658-01 as of May 1, 2023. | |||
Almost one-third of the growth in 2022 was attributable to the energy sector (+5.1%). Oil and gas extraction (excluding oil sands) increased by 11.0% in 2022 as the price of conventional oil surged. Meanwhile, oil and sands extraction grew 2.4%, breaking a production record for the first half of 2022 in Alberta. Support activities for oil and gas extraction also increased (+14.0%). Further contributing to growth in the energy sector was increased electricity generation at some wind and solar facilities.
The agriculture, forestry, fishing and hunting (+36.2%) sector rebounded from the difficult crop season of 2021. Better growing conditions resulted in increased production for the major crops such as wheat, canola and barley (see table 2). Despite the rise in construction costs and borrowing rates, the construction sector registered its highest growth in the province since 2013.
The growth in services-producing industries was driven by transportation and warehousing (+8.9%), accommodation and food services (+21.4%), and real estate and rental and leasing (+2.0%).
British Columbia’s economy continued to grow with ongoing large scale construction projects
In British Columbia, GDP grew 3.6% in 2022. The services-producing industries increased 3.7% with 12 of 15 sectors reporting an increase, while goods-producing industries grew 3.3%. British Columbia’s total population grew 2.2%, its highest growth rate since 1996. Employment rose 7.1% to reach above its pre-pandemic level.
The goods-producing industries were led by construction activity, mainly in engineering construction (+15.9%). Oil and gas engineering construction increased for a fourth consecutive year, as the LNG Canada and the Coastal GasLink pipeline projects advanced. Electric power engineering construction was helped by the Site C Clean Energy Project. Transportation engineering construction grew partly as a result of the Broadway Subway and Pattulo Bridge replacement projects. Following an increase of 5.9% in 2021, residential building construction fell 2.1%.
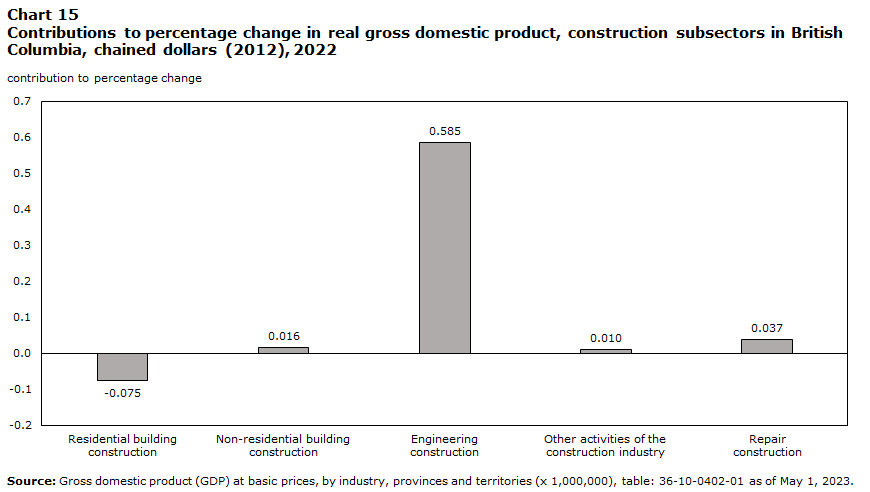
Data table for Chart 15
| North American Industry Classification | 2022 |
|---|---|
| contribution to percentage change | |
| Residential building construction | -0.075 |
| Non-residential building construction | 0.016 |
| Engineering construction | 0.585 |
| Other activities of the construction industry | 0.010 |
| Repair construction | 0.037 |
| Source: Gross domestic product (GDP) at basic prices, by industry, provinces and territories (x 1,000,000), table: 36-10-0402-01 as of May 1, 2023. | |
The manufacturing sector grew 3.1% with 11 of 19 subsectors reporting gains led by machinery manufacturing (+13.7%), and petroleum and coal product manufacturing (+10.5%). The agriculture, forestry, fishing and hunting sector fell 4.2%. Most components contracted, but it was forestry and logging (-9.4%) which dominated the decline for the second consecutive year due to poor weather conditions and weaker residential construction activity.
Output from the mining, quarrying, and oil and gas extraction sector grew 1.7%. This was driven by the 8.6% increase in oil and gas extraction (except oil sands), which was partly offset by declines in copper, nickel, lead and zinc ore mining (-8.6%), coal mining (-2.8%) and gold and silver ore mining (-5.6%).
Yukon supported by strong growth in services-producing industries
Yukon’s gross domestic product advanced 3.3% in 2022, the fastest growth rate in the Canadian Territories, following a 10.0% increase in 2021.
Services-producing industries steered the territory’s economic growth (+2.6%) with notable contributions from transportation and warehousing (+28.3%), accommodation and food services (+16.5%), public administration (+1.2%) and real estate and rental and leasing (+1.9%). This was the first time since 2018 that the contribution to change in absolute value of the territority’s total growth (positive or negative) of services-producing industries was larger than that of goods-producing industries.
Good-producing industries increased 5.3%, with substantial growth in construction industries. The construction sector grew 16.6% led by transportation engineering construction as a large investment in transportation infrastructure, the Yukon Resource Gateway Project, was in progress. Non-residential construction advanced 21.7% with higher investment in industrial and institutional and governmental components.
Mining, quarrying, and oil and gas extraction contracted 0.7% in 2022 following two years of strong growth. Gold and silver ore mining declined as the Eagle Gold mine was temporarily out of service due to equipment failure. Copper, nickel, lead and zinc ore mining activities showed growth (+9.0%), thanks to increased production from the Minto mine.
Northwest Territories’ GDP moved in opposite directions for construction and mining
Northwest Territories GDP increased 1.5% in 2022 following a growth of 4.9% in 2021. Services-producing industries rose 2.0% as 10 of 15 sectors grew or remained flat while goods-producing industries rose 0.3%.
Among the services-producing industries, the transportation and warehousing sector was up 32.7%. Health care and social assistance grew 3.9% with contributions from higher ambulatory health care services (+5.0%). Accommodation and food services rose 11.8% with the reduction of pandemic restrictions permitting the return of customers.
Goods-producing industries were led by the construction sector rising 20.7%. Engineering construction rose 59.2% as the territory saw ongoing work at two new power plants in Lutsel K’e and Sachs Harbour as well as improvements to the Mike Zubko Airport project. Partially offsetting the construction gains, mining, quarrying, and oil and gas extraction contracted 5.9% with lower production volume of diamonds.
Nunavut was the only territory with greater contributions from the goods-producing industries than services-producing industries
Nunavut’s economy advanced 1.6% following growth of 7.9% in 2021. The goods-producing sector increased 3.0%, while services edged up 0.2%.
Mining, quarrying, and oil and gas extraction rose 5.3% as all industries expanded. The construction sector registered a decline of 9.2% as the Iqaluit Deep Sea Port Project neared completion. Engineering (-9.0%) and non-residential construction (-19.1%) contributed the most to the decline.
On the services-side, the largest gains were reported in industries that were recovering from the past two years of pandemic-related restrictions. Transportation and warehousing surged 35.5%, led by air transportation, while accommodation and food services increased 25.0%.
Real estate and rental and leasing fell 7.2% as the activity of real estate agents and brokers plunged. Wholesale trade fell 32.6% after posting an increase of 27.9% in 2021, with the drop almost entirely driven by machinery, equipment and supplies merchant wholesalers (-35.5%). Retail trade (-6.1%) fell for the second consecutive year, with food and beverage stores accounting for most of the decline.
Appendix
| Geography | 2018 | 2019 | 2020 | 2021 | 2022 |
|---|---|---|---|---|---|
| percentage points | |||||
| N.L. | -0.045 | 0.060 | -0.070 | 0.009 | -0.026 |
| P.E.I. | 0.005 | 0.014 | -0.005 | 0.026 | 0.010 |
| N.S. | 0.034 | 0.066 | -0.071 | 0.124 | 0.052 |
| N.B. | 0.022 | 0.021 | -0.045 | 0.095 | 0.030 |
| Que. | 0.604 | 0.574 | -1.007 | 1.182 | 0.511 |
| Ont. | 1.305 | 0.860 | -1.875 | 1.965 | 1.352 |
| Man. | 0.066 | 0.038 | -0.140 | 0.055 | 0.121 |
| Sask. | 0.059 | -0.018 | -0.176 | -0.025 | 0.209 |
| Alta. | 0.322 | 0.023 | -1.243 | 0.728 | 0.813 |
| B.C. | 0.489 | 0.371 | -0.416 | 0.845 | 0.489 |
| Y.T. | 0.004 | -0.002 | 0.005 | 0.015 | 0.005 |
| N.W.T. | 0.003 | -0.009 | -0.021 | 0.009 | 0.003 |
| Nvt. | 0.007 | 0.012 | 0.002 | 0.014 | 0.003 |
| Source: Gross domestic product (GDP) at basic prices, by industry, provinces and territories, contributions to national percentage change, table: 36-10-0658-01 as of May 1, 2023. | |||||
| Geography | Real GDP | Population | Employment | Building permits |
|---|---|---|---|---|
| percent change | ||||
| Can. | 3.6 | 1.8 | 6.3 | -12.5 |
| N.L. | -1.7 | 1.1 | 3.7 | 14.3 |
| P.E.I. | 2.9 | 3.6 | 7.2 | -16.4 |
| N.S. | 2.6 | 2.9 | 4.6 | 3.5 |
| N.B. | 1.8 | 2.7 | 3.9 | 11.0 |
| Que. | 2.6 | 1.1 | 5.5 | -19.6 |
| Ont. | 3.6 | 2.0 | 7.1 | -20.3 |
| Man. | 3.9 | 1.2 | 4.1 | -22.8 |
| Sask. | 5.7 | 1.1 | 4.4 | -3.5 |
| Alta. | 5.1 | 2.2 | 6.8 | -9.1 |
| B.C. | 3.6 | 2.2 | 7.1 | 9.5 |
| Y.T. | 3.3 | 1.2 | 4.1 | -28.8 |
| N.W.T. | 1.5 | 0.0 | 3.2 | -8.5 |
| Nvt. | 1.6 | 2.1 | 4.4 | 40.7 |
| Sources: Gross domestic product (GDP) at basic prices, by industry, provinces and territories, growth rates (x 1,000,000), table: 36-10-0402-02 as of May 1, 2023. Population estimates, annual, table: 17-10-0005-01 as of December 21, 2022. Calculations based on employment by industry, annual, table: 14-10-0202-01 as of March 30, 2023. Calculations based on building permits, by type of structure and type of work, unadjusted constant dollars, total residential, value of permits, monthly, table: 34-10-0066-01 as of May 10, 2023. | ||||
Note to readers
This analysis expands upon the Daily publication (Gross domestic product by industry: Provinces and territories, 2022) from May 1, 2023, as it provides a more in-depth provincial and territorial economic story.
The provincial and territorial gross domestic product (GDP) by industry data at basic prices are chained volume estimates with 2012 as their reference year. This means data for each industry and aggregate are obtained from a chained volume index multiplied by the industry's value added in 2012. For the November 2023 release, provincial and territorial GDP by industry will update the reference year from 2012 to 2017.
Percentage changes for GDP by industry are calculated using volume measures, that is, adjusted for price variations.
- Date modified: