
Railway carloadings, July 2026
Released: 2026-09-28
31.7 million metric tonnes
July 2026
2.6% 
(12-month change)
Highlights
In July, Canadian railways transported 31.7 million tonnes of freight, up 2.6% from July 2025, marking the fourth straight month of year-over-year increases.
Strong growth in carloadings of grains in particular more than offset large declines in coal and potash.
Overall traffic also reached the third-highest level on record for the month of July, and it exceeded the five-year average for the month (30.1 million tonnes).
Consult the Rail Data Visualization Hub to explore monthly and annual rail statistics in an interactive format.
Chart 1

Railway carloadings, total tonnage
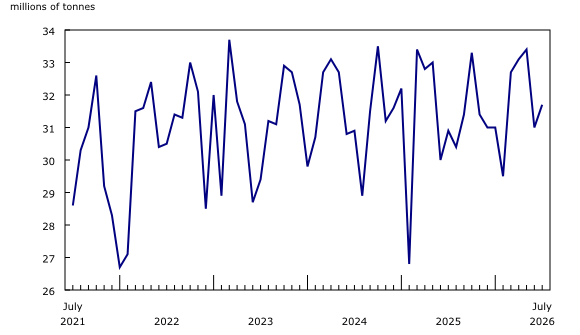
The year-over-year increase in total rail freight in July was attributable to higher volumes of domestic non-intermodal loadings (mainly commodities) and freight traffic from connections with American railways.
Grain loadings continue rise
In July, non-intermodal freight loadings (mainly commodities) in Canada were up for the third month in a row, rising 1.9% year over year to 24.8 million tonnes, led by large increases in the loadings of some agricultural products—most notably grains.
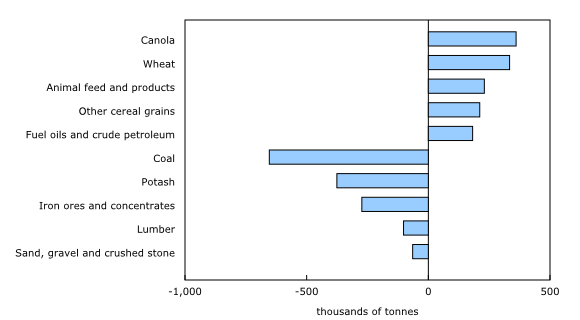
With elevated stocks of principal field crops across most major grains and strong global demand, grain shipments by rail remained strong. For instance, carloadings of canola have risen each month since February and grew 64.4% (+361 000 tonnes) in July from the same month a year earlier, the largest increase in tonnage in over a year and a half.
Similarly, wheat loadings posted the largest increase in tonnage since November 2025, rising by 16.0% (+334 000 tonnes) year over year in July 2026, the fourth consecutive month of growth.
These movements in grain traffic coincided with year-over-year increases in Canada's exports of canola (+148.5%) and wheat (+7.4%) in July, as reported in the International trade monthly interactive dashboard.
Also posting strong growth in July were loadings of animal feed and products, up 51.1% (+230 000 tonnes) year over year, following strong gains in May (+34.5%) and June (+44.9%).
Chart 2
Railway carloadings, largest commodity differences, July 2025 to July 2026
Some commodities remain down
Growth in commodity traffic was moderated by large declines in several commodities. In particular, loadings of coal have declined year over year for five straight months and fell 19.1% (-654 000 tonnes) in July.
In July, loadings of potash fell by 16.1% (-376 000 tonnes) from July 2025. This was the third consecutive monthly year-over-year decline and the largest drop in tonnage since November 2024.
Decreases were also reported for loadings of iron ores and concentrates, down 5.5% (-273 000 tonnes) in July 2026 from the same month a year earlier.
Domestic intermodal traffic steady
In July, intermodal shipments—mainly containers—originating in Canada totalled 3.2 million tonnes of freight transported, little changed from one year earlier (-25 139 tonnes).
Container volume remained strong, despite disruptions to rail movements amid wildfires that delayed intermodal freight moving between eastern and western Canada in July.
American freight continues to increase
In July, freight loadings from connections with US railways remained above the volume posted in the same month of the previous year for the fifth consecutive month, rising 11.1% year over year to 3.8 million tonnes. This jump may partly reflect re-routing of some rail traffic via American connections amid wildfires in Northern Ontario and British Columbia during the month.
Note to readers
The Monthly Railway Carloadings Survey collects data on the number of rail cars, tonnage, units and 20-feet equivalent units from railway transporters operating in Canada that provide for-hire freight services.
Cargo loadings from Armstrong, Ontario, to the Atlantic Coast are classified to the eastern division (Eastern Canada), while loadings from Thunder Bay, Ontario, to the Pacific Coast are classified to the western division (Western Canada).
Survey data are revised on a monthly basis to reflect new information.
The data in this release are not seasonally adjusted.
The Transportation Data and Information Hub, featuring data from Statistics Canada, Transport Canada and partners, provides Canadians with online access to comprehensive statistics and indicators for the country's transportation sector.
Contact information
For more information, or to enquire about the concepts, methods or data quality of this release, contact us (toll-free 1-800-263-1136; 514-283-8300; infostats@statcan.gc.ca) or Media Relations (statcan.mediahotline-ligneinfomedias.statcan@statcan.gc.ca).
- Date modified: