
Industrial product and raw materials price indexes, July 2026
Released: 2026-08-20
July 2026
0.6% 
(monthly change)
July 2026
-0.2% 
(monthly change)
July 2026
-2.2%
(monthly change)
July 2026
-1.5%
(monthly change)
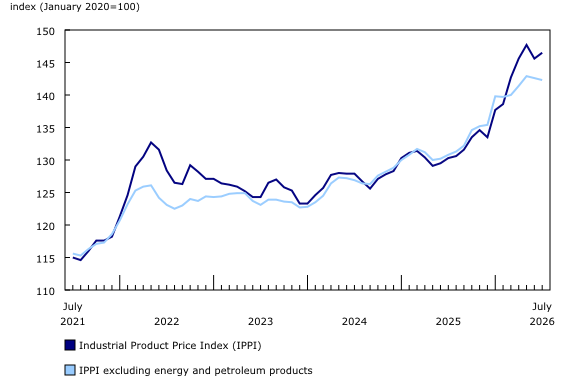
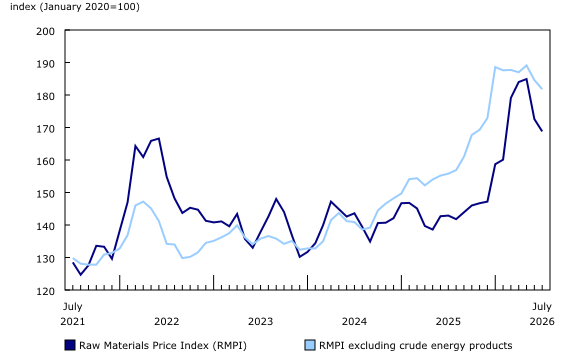
Prices of products manufactured in Canada, as measured by the Industrial Product Price Index (IPPI), increased 0.6% month over month in July and gained 12.4% year over year. Meanwhile, prices of raw materials purchased by manufacturers operating in Canada, as measured by the Raw Materials Price Index (RMPI), decreased 2.2% month over month and increased 18.1% year over year.
Chart 1

Prices for industrial products increase in July
Industrial Product Price Index
The IPPI increased 0.6% month over month in July, following a 1.4% decrease in June. Excluding energy and petroleum products, the IPPI decreased 0.2%. The resumption of the conflict between the United States and Iran in July contributed to higher prices for energy and petroleum products. Lower prices for primary non-ferrous metals and chemicals offset these price increases.
The prices of energy and petroleum products rose 6.4% in July, leading the monthly increase in the IPPI. Higher prices for refined petroleum energy products (+6.9%) drove the increase. Diesel fuel (+10.4%) and finished motor gasoline (+4.7%) were the top contributors to the monthly increase for the product group. Crude oil shipments through the Strait of Hormuz recovered for a brief period in early July, pushing crude oil prices downward. However, according to the International Energy Agency, refined product markets remained tight, pushing petroleum refinery margins to four-year highs in early July.
The prices of primary non-ferrous metal products declined 5.2% month over month in July. The decline was driven by unwrought gold, silver, and platinum group metals, and their alloys (-6.9%), followed by unwrought aluminum and aluminum alloys (-7.0%). Unwrought aluminum and aluminum alloys recorded its largest month-over-month decrease since April 2025.
Prices for chemicals and chemical products fell 3.4% month over month in July 2026. This decline was driven by fertilizers, pesticides and other chemical products (-10.8%). Lower prices for plastic resins (-4.3%) also contributed to the decline in chemicals and chemical products.
Year over year
The IPPI increased 12.4% year over year in July, the index's 22nd consecutive month of year-over-year increase.
In July, the majority of product groups increased on a year-over-year basis. The top contributors were energy and petroleum products (+42.0%), driven by higher prices for diesel fuel (+50.3%) and finished motor gasoline (+44.7%). Other large contributors to the year-over-year increase in the IPPI included unwrought silver and silver alloys (+60.3%), unwrought gold and gold alloys (+25.6%) and plastic resins (+46.3%).
Raw Materials Price Index
The RMPI decreased 2.2% month over month in July. Crude energy products made the largest contribution to the decline, followed by metal ores, concentrates and scrap. Excluding crude energy products, the RMPI decreased 1.5%.
Prices for crude energy products (-3.6%) declined for the third consecutive month in July. Both synthetic crude oil (-8.9%) and conventional crude oil (-1.5%) posted monthly decreases as crude oil shipments through the Strait of Hormuz temporarily increased in early July.
Metal ores, concentrates and scrap (-4.7%) declined for the second straight month in July. The key driver of the July decrease was the gold, silver, and platinum group metal ores and concentrates (-7.2%) product group. Lower prices for nickel ores and concentrates (-4.8%) made an impact as well, to a much lesser extent.
In July, prices for crop products increased 4.8% month over month, following a 0.8% decline in the previous month. This was the largest monthly gain for this commodity group since March 2022 (+5.4%). The increase in July 2026 was driven by price movements from other miscellaneous crop products (+9.9%) and canola (including rapeseed) (+4.6%).
Year over year
The RMPI increased 18.1% year over year in July, slowing from a 21.0% year-over-year gain in June. Excluding crude energy products, the RMPI increased 16.7% year over year in July.
Gold, silver, and platinum group metal ores and concentrates (+39.0%) was the product group that made the largest contribution to the RMPI's year-over-year increase, by a large margin. Conventional crude oil (+21.7%), synthetic crude oil (+21.2%) and cattle and calves (+14.6%) also exerted notable upward pressure on the RMPI on a year-over-year basis.
Chart 2
Prices for raw materials decrease in July
Note to readers
The Industrial Product Price Index (IPPI) and the Raw Materials Price Index (RMPI) are available at the Canada level. Selected commodity groups within the IPPI are also available by region. The indexes are not seasonally adjusted.
The IPPI reflects the prices that producers in Canada receive as goods leave the factory gate. The IPPI does not reflect what the consumer pays. Unlike the Consumer Price Index, the IPPI excludes indirect taxes, such as sales taxes and tariffs, and all costs that occur between the time a good leaves the plant and the time the final user takes possession of the good. This includes transportation, wholesale and retail costs. Although the IPPI does not measure the direct effect of tariffs on prices, tariffs may indirectly influence prices measured in the IPPI. For example, inputs used in the production process that are imported and on which Canada imposes a tariff may raise the prices charged by Canadian producers. Tariffs on Canadian imports or exports may also indirectly influence prices in the IPPI through their impact on supply and demand dynamics.
The RMPI reflects the prices paid by Canadian manufacturers for key raw materials. The RMPI includes all charges purchasers incur to bring a commodity to the establishment gate, including transportation charges, net taxes paid and customs duties and tariffs paid on imported raw materials.
A sample transition is planned for the IPPI and RMPI, beginning in the September 2026 reference month. The new sample was drawn based on annual sales of manufactured products and purchase values of raw materials to be used in manufacturing by establishments selected for the 2022 Annual Survey of Manufacturing and Logging Industries. The indexes will be transitioned from the current sample to the new one in stages. Each month, a subset of the indexes' sample strata will be transitioned, with all strata transitioning by the December 2026 reference month. Index values computed using the existing sample will not be revised with data from the new sample. For more information on sampling procedures for the IPPI and RMPI, please consult the Technical Guide for the Industrial Product Price Index.
Products
Statistics Canada launched the Producer Price Indexes Portal as part of a suite of portals for prices and price indexes. This webpage provides Canadians with a single point of access to a variety of statistics and measures related to producer prices.
Next release
The industrial product and raw materials price indexes for August 2026 will be released on September 17.
Contact information
For more information, or to enquire about the concepts, methods or data quality of this release, contact us (toll-free 1-800-263-1136; 514-283-8300; infostats@statcan.gc.ca) or Media Relations (statcan.mediahotline-ligneinfomedias.statcan@statcan.gc.ca).
- Date modified: