
Energy statistics, May 2026
Released: 2026-07-31
25.8 million cubic metres
May 2026
9.0% 
(12-month change)
9.9 million cubic metres
May 2026
10.9%
(12-month change)
708.8 million gigajoules
May 2026
2.0%
(12-month change)
49.0 million megawatt-hours
May 2026
5.5%
(12-month change)
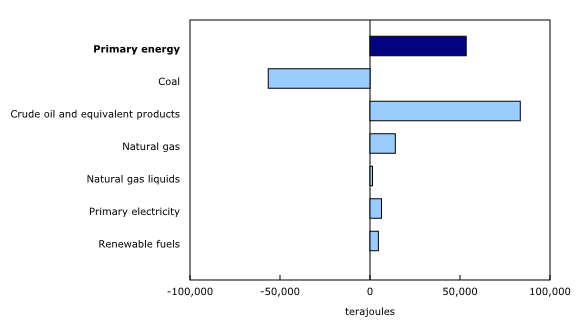
Primary energy production increased 2.7% year over year in May to 2.0 million gigajoules, with gains in five of six subsectors.
Chart 1

Year-over-year contribution to change in primary energy production
For more information on energy in Canada, including production, consumption, international trade and much more, visit the Canadian Centre for Energy Information portal and follow #EnergyNews on social media.
Crude oil production rises
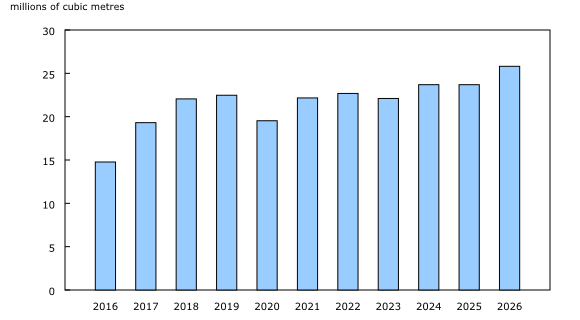
Production of crude oil and equivalent products increased 9.0% year over year to 25.8 million cubic metres in May. This was the highest production volume for the month of May since the start of the series in 2016. The gain in May 2026 came amid continued constraints in the supply of crude oil from the Middle East, while global demand and prices of crude oil remained elevated.
Oil sands extraction was the largest contributor to the overall gain in May, climbing 12.4% to 16.4 million cubic metres. Due to the absence of typical spring maintenance at most upgraders, production of synthetic crude oil jumped 31.8% to 6.1 million cubic metres, while production of crude bitumen rose 3.5%.
Oil extraction (except oil sands) increased 5.1% year over year to 6.7 million cubic metres in May. The gain was largely attributable to growth in the production of light and medium crude oil from offshore Newfoundland and Labrador (+17.1%), which has continued to rise year over year since March 2025.
Chart 2
Production of crude oil and equivalent products for the month of May, 2016 to 2026
Production and consumption of finished petroleum products rise
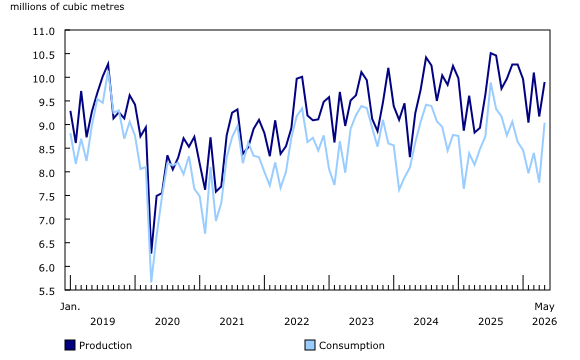
Production of finished petroleum products jumped 10.9% to 9.9 million cubic metres in May, the highest level of production for the month since the series began in 2019. In May 2026, year-over-year growth in distillate fuel oil (+27.6%) and kerosene-type jet fuel (+69.4%) outweighed a 1.4% decrease in motor gasoline.
Meanwhile, domestic consumption of finished petroleum products rose 6.5% to 9.0 million cubic metres in May.
Chart 3
Canadian production and consumption of refined petroleum products
Production of natural gas climbs in May
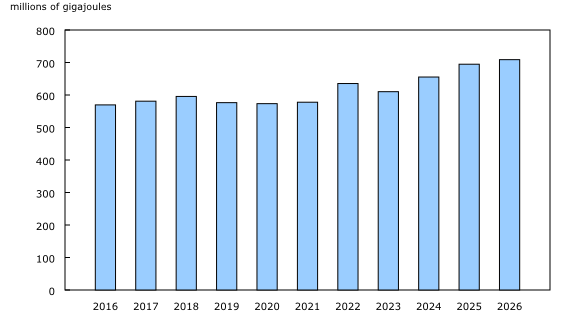
Production of marketable natural gas was up 2.0% year over year to 708.8 million gigajoules in May, the highest production volume for the month of May since the start of the series in 2016. Production in British Columbia rose 9.2% in May 2026, driven by increased demand for overseas exports, while production in Alberta declined 2.0%, largely due to planned maintenance at some natural gas facilities in the province.
Exports of natural gas rose 8.0% year over year to 296.6 million gigajoules in May. Exports to the United States fell 9.3% to 248.6 million gigajoules as maintenance at some gas plants in the United States, coupled with cooler temperatures in the eastern states, resulted in less demand for Canadian natural gas in May. The remainder of Canadian natural gas exports, 47.5 million gigajoules, was shipped as liquefied natural gas to markets in Asia.
Chart 4
Marketable production of natural gas for the month of May, 2016 to 2026
Hydroelectric generation drives overall increase in May
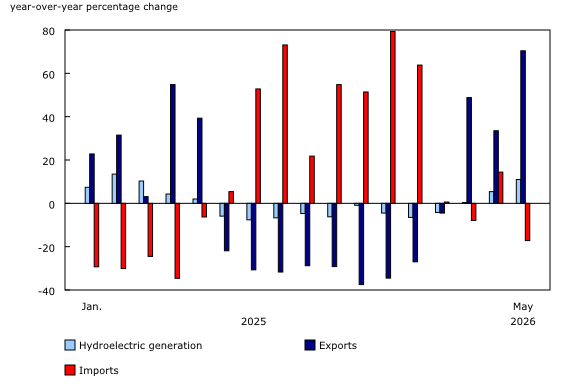
Total electricity generation in Canada increased 5.5% year over year to 49.0 million megawatt-hours (MWh) in May. Generation increases from hydroelectricity (+11.0%), combustible fuels (+9.2%), wind (+5.3%) and solar (+1.2%) outweighed a decrease in nuclear (-16.8%), which was due to ongoing maintenance of units at the Point Lepreau nuclear generating station in New Brunswick and Darlington and Pickering stations in Ontario.
Hydroelectric generation in May reached its highest level for the month of May since 2023, following several years of drought conditions across much of Canada, which reduced generation and consequently led to lower exports and higher imports.
In May, exports of electricity to the United States rose 70.4% year over year to 4.6 million MWh, the highest level since January 2025, while imports fell 17.2% to 1.3 million MWh, the lowest level since May 2023.
Chart 5
Hydroelectricity generation, exports, and imports of electricity
Canada's first liquefied natural gas (LNG) export terminal began shipments in July 2025, exporting LNG from Kitimat, British Columbia, to the global market. Previously, all Canadian exports of natural gas went to the United States. A new data series is now available in table 25-10-0086-01 as part of the monthly natural gas survey, which includes exports of natural gas to countries other than the United States.
For more information about LNG export data produced by Statistics Canada, see LNG EXPORT DATA: CER and Statistics Canada Explained.
Note to readers
The Energy Statistics Program relies on data collected from respondents and administrative sources.
The Consolidated Energy Statistics table (25-10-0079-01) presents monthly data on primary and secondary energy by fuel type (crude oil, natural gas, electricity, coal, etc.) in terajoules and supply and demand characteristics (production, exports, imports, etc.) for Canada. For more information, consult the Consolidated Energy Statistics Table: User Guide.
Data in this release are not seasonally adjusted.
The following survey programs support the "Energy statistics" release:
- Crude oil and natural gas (survey number 2198; tables 25-10-0036-01 and 25-10-0063-01)
- Energy transportation and storage (survey number 5300; tables 25-10-0075-01 and 25-10-0077-01)
- Natural gas transmission, storage and distribution (survey numbers 2149, 5210 and 5215; table 25-10-0086-01)
- Refined petroleum products (survey number 2150; table 25-10-0081-01)
- Additional data from the Monthly Renewable Fuel and Hydrogen Survey (survey number 5294; table 25-10-0082-01), available on request
- Electric power statistics (survey number 2151; tables 25-10-0015-01 and 25-10-0016-01)
- Coal and coke statistics (survey numbers 2147 and 2003; tables 25-10-0045-01 and 25-10-0046-01).
Revisions
Energy data from surveys and administrative sources are subject to revisions to reflect new or updated information. Historical revisions will be processed periodically.
Occasionally, data from Environment and Climate Change Canada are referenced by the Energy Statistics Program using Cooling Degree Days (CDDs) or Heating Degree Days (HDDs) as a measure of temperature. CDDs reflect the relationship between outdoor temperatures and the need to cool indoors to maintain room temperature. As temperatures outside rise, the number of CDDs increases. HDDs are the opposite and reflect the need to heat indoors to maintain room temperature. As temperatures outside fall, the number of HDDs increases.
Contact information
For more information, or to enquire about the concepts, methods or data quality of this release, contact us (toll-free 1-800-263-1136; 514-283-8300; infostats@statcan.gc.ca) or Media Relations (statcan.mediahotline-ligneinfomedias.statcan@statcan.gc.ca).
- Date modified: