
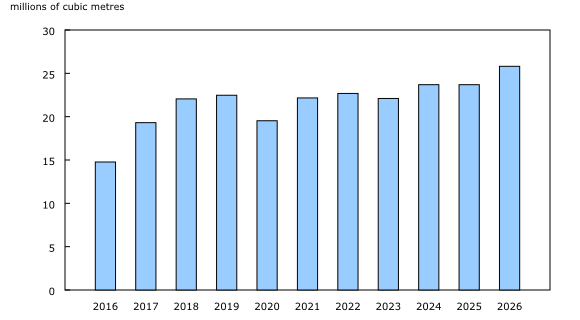
Chart 2
Production of crude oil and equivalent products for the month of May, 2016 to 2026
Source(s):
Table 25-10-0063-01.
Chart description
This is a column clustered chart.
| millions of cubic metres | |
|---|---|
| 2016 | 14.77 |
| 2017 | 19.31 |
| 2018 | 22.05 |
| 2019 | 22.47 |
| 2020 | 19.53 |
| 2021 | 22.16 |
| 2022 | 22.68 |
| 2023 | 22.10 |
| 2024 | 23.69 |
| 2025 | 23.69 |
| 2026 | 25.81 |
Source(s):
Table 25-10-0063-01.
- Date modified: