
Study: Portrait of the Latin American populations in Canada
Released: 2026-06-29
A new analytical portrait released today, "Portrait of the Latin American Populations in Canada: Diversity and Socioeconomic Outcomes," provides a comprehensive overview of the diverse characteristics of Latin American populations in Canada. It examines key aspects, such as place of residence, age distribution, language, immigration characteristics, religious affiliation, educational attainment, employment and occupation, income levels and experiences of social inclusion. Many of these dimensions are further analyzed by country of birth, offering deeper insight into the varied trajectories and outcomes within Latin American communities.
This is the sixth in a series of portraits on racialized groups in Canada, developed by Statistics Canada in support of Canada's Anti-Racism Strategy. The previous portraits are The Diversity of the Black Populations in Canada, 2021: A Sociodemographic Portrait, Portrait of the Arab Populations in Canada: Diversity and Socioeconomic Outcomes, Portrait of the South Asian Populations in Canada: Diversity and Socioeconomic Outcomes, Portrait of the Chinese Populations in Canada: Diversity and Socioeconomic Outcomes and Portrait of the Filipino populations in Canada: A Sociodemographic and Socioeconomic Analysis.
The analysis in this release is based on the 2021 Census of Population, unless otherwise specified.
In 2021, 2% of the Canadian population reported being Latin American
Latin American populations in Canada reached 726,820 people in 2021, almost triple the 251,585 people reported in 2001. Consequently, their proportion of the total population increased from 0.9% in 2001 to 2.0% in 2021.
The most common places of birth of individuals in Canada who report being Latin American are Canada, Mexico and Colombia
In 2021, more than one-quarter (27.8%) of the Latin American populations in Canada were born in Canada, and 13.2% were born in Mexico. Of the 38.6% of people who were born in South America, Colombia was the most common country of birth (12.9%), followed by Brazil (7.4%). A further 13.8% of Latin Americans were born in Central America (excluding Mexico), and roughly half of them were born in El Salvador (7.0%). Among Latin Americans born in the Caribbean, most were from Cuba (2.0%) or the Dominican Republic (1.6%).
The main admission category of Latin American immigrants has shifted over time, and economic immigration is the most common since the 2000s
From 1983 to 1992, most Latin American immigrants arrived to Canada as refugees, while, from 2008 to 2021, most arrived as economic immigrants.
In 2021, among Latin Americans who immigrated during the period from 1980 to 2021, the largest proportion was economic immigrants (37.5%), followed by family-sponsored immigrants (31.1%) and refugees (28.8%).
Most Latin American immigrants born in Brazil (72.0%) and Venezuela (60.6%) who immigrated during the same period were economic immigrants, while most immigrants born in Mexico were either economic immigrants (41.6%) or sponsored by family (36.9%).
Most Latin Americans born in Central America who arrived during the 1980s and early 1990s (71.3%) were refugees. From 1994 to 2021, admission categories were more varied: 44.1% were sponsored by family, 27.9% were refugees and 23.1% were economic immigrants.
Ontario is home to the largest share of individuals who report being Latin American, but this varies by place of birth
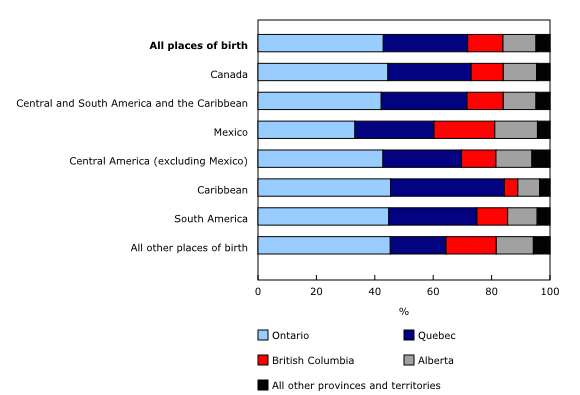
More than two in five Latin Americans in Canada lived in Ontario (42.9%) in 2021; this province was followed by Quebec (28.9%), British Columbia (12.1%) and Alberta (11.3%).
Distribution patterns varied by place of birth. Ontario was home to three-quarters (75.2%) of people born in Ecuador, while Quebec had the highest shares among those born in the Dominican Republic (48.1%), Peru (45.7%) and Colombia (37.6%). British Columbia was home to about one-fifth of people born in Mexico (20.8%) and Brazil (20.7%), while nearly one-fifth of those born in Venezuela (18.2%) lived in Alberta.
Chart 1

Province of residence of Latin American populations, by place of birth, Canada, 2021
Just over 7 in 10 Latin Americans report being Christian
In 2021, just over 7 in 10 Latin Americans in Canada (71.0%) reported being Christian, making it the most common religion. This proportion is higher than that among the non-racialized, non-Indigenous population (60.1%).
The highest proportion of Christians was among people born in Central America (excluding Mexico) (79.4%), followed by South America (74.3%) and Mexico (71.6%). Catholicism was the most reported denomination, most commonly among those born in Mexico (56.8%) and South America (56.1%).
By contrast, 39.3% of Latin Americans born in the Caribbean and 33.7% of those born in Canada reported having no religion or having secular beliefs.
Chart 2
Religion of Latin American populations by place of birth, Canada, 2021

Over half of Latin Americans in Canada are in the core working age population
In 2021, over half (51.1%) of Latin Americans in Canada were aged 25 to 54 years (core working age), a higher share than that among the non-racialized, non-Indigenous population (37.4%). This was driven by the first-generation Latin American population (those born outside Canada), 60.8% of whom were in this age group.
More than two in five Latin Americans aged 25 to 54 years have a bachelor's degree or higher
More than two in five Latin Americans aged 25 to 54 years (42.1%) had a bachelor's degree or higher in 2021, compared with 31.5% of the non-racialized, non-Indigenous population. This proportion varied by place of birth; for example, Latin Americans born in South America (53.6%) and Mexico (46.0%) were more than twice as likely as those born in the rest of Central America (19.1%) to have a bachelor's degree or higher.
Educational attainment also varied by period of immigration. Among core-aged Latin American immigrants who were admitted from 2016 to 2021, 60.7% had a bachelor's degree or higher, compared with 20.4% among those admitted from 1980 to 1990.
These differences reflect shifting immigration patterns over time. Earlier cohorts—particularly those who arrived in the 1980s and 1990s—included more immigrants from Central America, who were more likely to have lower levels of formal education. By contrast, more recent cohorts included a higher share of immigrants from South America and Mexico, who were more often admitted under economic categories that prioritize skilled and educated applicants (Table 1).
Latin Americans have higher overqualification rates than the non-racialized, non-Indigenous population, whether they study in or outside Canada
Among Latin Americans aged 25 to 54 years with a bachelor's degree or higher who worked in 2020 or 2021, one in five (21.8%) was overqualified, meaning they held jobs that required, at most, a high school diploma. This rate was more than twice that of the non-racialized, non-Indigenous population (10.4%). The gap was more pronounced among women (23.4% of Latin Americans compared with 9.8% of non-racialized, non-Indigenous populations) than men (19.9% compared with 11.3%).
Even among people who earned their degree in Canada, Latin Americans (12.7%) were more likely to be overqualified for their jobs than non-racialized, non-Indigenous people (9.9%).
Chart 3
Overqualification rate of Latin American and non-racialized, non-Indigenous populations aged 25 to 54 years with a bachelor's degree or higher who worked in 2020 or 2021, by gender and location of study, Canada, 2021

As of 2021, two in five Latin Americans lived in housing that was either unaffordable, crowded or in need of major repairs
Acceptable housing, as defined by the Canada Mortgage and Housing Corporation, meets each of the three indicator thresholds: shelter costs are less than 30% of a household's total before-tax income, the dwelling has suitable bedrooms for the household's size and composition, and the dwelling does not require major repairs.
Based on these thresholds, three in five Latin Americans (59.8%) were living in acceptable housing in 2021, considerably less than the non-racialized, non-Indigenous population (78.3%). Only the Japanese population (70.0%) reported a higher proportion among racialized groups.
In the census metropolitan area (CMA) of Montréal, close to two-thirds (63.3%) of the Latin American populations lived in acceptable housing, compared with 78.3% of the non-racialized, non-Indigenous population. By comparison, the gap was wider in both the Toronto (50.1% compared with 71.3%) and Vancouver (53.2% compared with 71.9%) CMAs.
Chart 4
Housing acceptability by selected population group, Canada, 2021

More than two in five Latin Americans report having experienced discrimination in the six years preceding 2021
Based on the 2020 General Social Survey – Social Identity, more than two in five Latin Americans (44.7%) reported having experienced discrimination in the six years preceding 2021. The most common forms of discrimination experienced were based on language (29.4%), ethnicity or culture (27.9%) and race or colour (18.4%). Discrimination most often occurred at work or when applying for a job or promotion (26.9%) and in public spaces (24.8%).
People who experienced discrimination reported having lower life satisfaction and a weaker sense of belonging to their local community. Latin Americans who faced discrimination were less likely to report having high life satisfaction (51.7%) than those who did not face discrimination (72.6%). Those who experienced discrimination were also more likely to feel a weak sense of belonging to their local community (28.0%) than those who had not experienced discrimination (14.3%).
Note to readers
The series of portraits on racialized groups in Canada was developed in partnership with the Department of Canadian Heritage to support Canada's Anti-Racism Strategy, which seeks to address racism and discrimination faced by racialized groups and Indigenous Peoples. This analytical portrait aligns with the Disaggregated Data Action Plan: Why it matters to you, a whole-of-government approach led by Statistics Canada to enhance data collection, analysis and dissemination pertaining to diverse populations in Canada.
Data sources
This analysis was conducted principally using data from the 2021 Census of Population. Data were also used from earlier censuses, the 2011 National Household Survey and the 2020 General Social Survey – Social Identity. Information on the coverage of each data source is available in the portrait.
Methods
This portrait provides a descriptive analysis of the characteristics of Latin American populations in Canada.
Definitions
For terms that are not defined in this release, refer to the Dictionary, Census of Population, 2021.
Acceptable housing: As defined by the Canada Mortgage and Housing Corporation (CMHC), a dwelling is considered acceptable if it meets three criteria. First, shelter costs must be less than 30% of a household's total before-tax income, measuring housing affordability. Second, the dwelling must have suitable bedrooms, according to CMHC's National Occupancy Standard: a couple shares a bedroom, two children younger than 5 of any sex share a bedroom, two children aged 5 to 17 of the same sex share a bedroom and everyone else has their own bedroom. Housing is unsuitable if bedrooms are insufficient, such as when children share with parents, three or more children share a room, or opposite-sex children aged 5 to 17 share a room. Third, the dwelling must not require major repairs. This indicator applies to owner and tenant households with total income greater than zero in non-farm, non-reserve private dwellings.
Canadian-born: In this portrait, this term refers to people born in Canada, irrespective of their immigrant status. There are some non-immigrants born outside Canada (e.g., children of Canadian citizens who were living abroad or travelling when their child was born) and a small number of immigrants born in Canada (e.g., children of foreign diplomatic personnel).
Educational attainment: "Educational attainment," "level of education" and "highest level of education" refer to the highest level of education that a person has successfully completed, using the classification of highest certificate, diploma or degree. The general hierarchy used in deriving this variable (high school, trades, college, university) is loosely tied to the "in-class" duration of the various types of education.
Gender: This refers to an individual's personal and social identity as a man, woman or non-binary person (a person who is not exclusively a man or a woman) and includes the following concepts:
• gender identity, which refers to the gender that a person feels internally and individually.
• gender expression, which refers to the way a person presents their gender, regardless of their gender identity, through body language, aesthetic choices or accessories (e.g., clothes, hairstyle, makeup) that may have traditionally been associated with a specific gender.
A person's gender may differ from their sex at birth and from what is indicated on their current identification or legal documents such as their birth certificate, passport or driver's licence. A person's gender may change over time. Some people may not identify with a specific gender.
The sex variable in census years before 2021 and the two-category gender variable in the 2021 Census are combined in this analysis to make historical comparisons. Although sex and gender refer to two different concepts, the introduction of gender in 2021 is not expected to have a significant impact on data analysis and historical comparability, given the small size of the transgender and non-binary populations. For additional information on changes of concepts over time, please consult the Age, Sex at Birth and Gender Reference Guide, Census of Population, 2021.
Given that the non-binary population is small, data aggregation to a two-category gender variable is sometimes necessary to protect the confidentiality of responses. In these cases, individuals in the category "non-binary people" are distributed into the other two gender categories. Unless otherwise indicated, the category "men" includes men, boys and some non-binary people, while the category "women" includes women, girls and some non-binary people.
Generation status: This refers to whether a person or their parents were born in Canada.
• The term "first generation" includes people who were born outside Canada.
• The term "second generation" includes people who were born in Canada and had at least one parent born outside Canada.
• The term "third generation or more" includes people who were born in Canada and whose parents were both also born in Canada.
Immigrant: This refers to a person who is, or has been, a landed immigrant or permanent resident. Such a person has been granted the right to live in Canada permanently by immigration authorities. Immigrants who have obtained Canadian citizenship by naturalization are included in this group. The 2021 Census of Population includes immigrants who were admitted to Canada on or prior to May 11, 2021.
• Economic immigrant: This refers to an immigrant who has been selected for their ability to contribute to Canada's economy by meeting labour market needs, owning and managing or building a business, making a substantial investment, creating their own employment, or meeting specific provincial or territorial labour market needs.
• Immigrant sponsored by family: This refers to an immigrant who was sponsored by a Canadian citizen or permanent resident and was granted permanent resident status based on their relationship either as the spouse, partner, parent, grandparent, child or other relative of this sponsor. The terms "family class" or "family reunification" are sometimes used to refer to this category.
• Refugee: This refers to an immigrant who was granted permanent resident status based on a well-founded fear of returning to their home country.
Latin American populations: In this portrait, Latin American populations are defined as those who responded to the population group question in the Census of Population with "Latin American"; a write-in response that was considered consistent with "Latin American" only, such as "Colombian" or "Chilean"; both of the above; or "Latin American" and "White." The inclusion of those who responded "Latin American" and "White" differs from the standard definition of the Latin American populations from the "visible minority" variable. This inclusion is used in this portrait to be consistent with methods for other racialized groups in this portrait series (e.g., South Asian, Chinese, Black and Filipino) and to more fully reflect the characteristics of the Latin American populations in Canada.
The definition of the Latin American populations excludes 1,195 Latin Americans who reported being both Latin American and White along with certain write-in responses. This population cannot be identified in a comparable way across census cycles.
The definition of the Latin American populations also excludes 57,010 people who reported being both Latin American and in one or more other racialized groups. These populations cannot be identified in a comparable way across census cycles. Details on these populations were provided in a highlight box within the portrait.
Non-immigrant: This refers to a person who is a Canadian citizen by birth.
Non-permanent resident: This refers to a person from another country with a usual place of residence in Canada and who has a work or study permit or who has claimed refugee status (asylum claimant, protected person and related groups). Family members living with work or study permit holders are also included, unless these family members are already Canadian citizens or landed immigrants or permanent residents.
Non-racialized, non-Indigenous population: In this portrait, the non-racialized, non-Indigenous population is defined as those who were not categorized as a "visible minority" using the visible minority variable; were not categorized as "White and Arab," "White and Latin American" or "White and West Asian" using the population group variable; and did not report a First Nations, Métis or Inuit identity in the question on Indigenous identity. In contrast to the standard definition, it excludes people who reported being both Arab and White, both Latin American and White or both West Asian and White. For more information on the visible minority and population group variables, consult the Visible Minority and Population Group Reference Guide, Census of Population, 2021.
Overqualification rate: This refers to the proportion of people with a bachelor's degree or higher who are working in an occupation that typically requires, at most, a high school diploma (defined as occupations in training, education, experience and responsibilities [TEER] categories 4 or 5 in the National Occupational Classification 2021). People in managerial occupations (TEER 0) are excluded from the calculation, as are those who did not have an occupation.
Place of birth: This refers to the name of the geographic location (in this portrait, the country or area of interest) where the person was born. The geographic location is specified according to the geographic boundaries at the time of data collection, not the geographic boundaries at the time of birth.
Religion: This refers to a person's self-identified connection to or affiliation with any religious denomination, group, body, or other religiously defined community or system of belief. Religion is not limited to formal membership in a religious organization or group. For infants or children, religion refers to the specific religious group or denomination, if any, in which they are being raised.
The category "Christian, n.o.s." ("n.o.s." means "not otherwise specified") includes responses such as "Christian" and "Christianity."
Respondents with no religion or with secular perspectives are those who selected the "No religion" option or entered other responses, such as "atheist" (does not believe in the existence of God) or "agnostic" (believes nothing can be known about the existence of God) in the "Specify one denomination or religion only" box on the Census of Population.
Year of immigration: This refers to the year in which a person obtained permanent residency in Canada. This may not be the same as the year that they first arrived in Canada.
Products
The analytical paper "Portrait of the Latin American Populations in Canada: Diversity and Socioeconomic Outcomes," which is part of the Ethnicity, Language and Immigration Thematic Series (89-657-X2026006), is now available.
Contact information
For more information, or to enquire about the concepts, methods or data quality of this release, contact us (toll-free 1-800-263-1136; 514-283-8300; infostats@statcan.gc.ca) or Media Relations (statcan.mediahotline-ligneinfomedias.statcan@statcan.gc.ca).
- Date modified: