
Chart 6
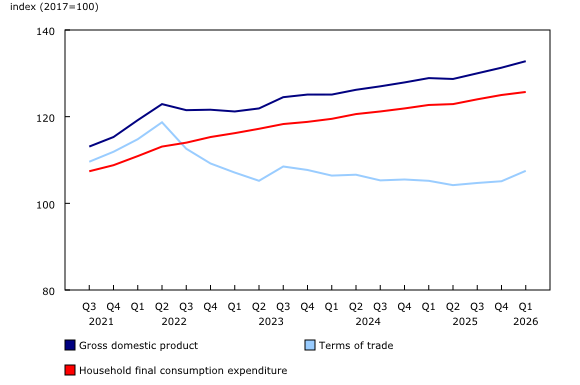
Gross domestic product price indexes, selected components
Source(s):
Tables 36-10-0106-01 and 36-10-0105-01.
Chart description
This is a line chart.
| Gross domestic product | Terms of trade | Household final consumption expenditure | |
|---|---|---|---|
| Third quarter 2021 | 113.1 | 109.6 | 107.4 |
| Fourth quarter 2021 | 115.3 | 111.9 | 108.8 |
| First quarter 2022 | 119.2 | 114.8 | 110.9 |
| Second quarter 2022 | 122.9 | 118.7 | 113.1 |
| Third quarter 2022 | 121.5 | 112.6 | 114.0 |
| Fourth quarter 2022 | 121.6 | 109.2 | 115.3 |
| First quarter 2023 | 121.2 | 107.1 | 116.2 |
| Second quarter 2023 | 121.9 | 105.2 | 117.2 |
| Third quarter 2023 | 124.5 | 108.5 | 118.3 |
| Fourth quarter 2023 | 125.1 | 107.7 | 118.8 |
| First quarter 2024 | 125.1 | 106.4 | 119.5 |
| Second quarter 2024 | 126.2 | 106.6 | 120.6 |
| Third quarter 2024 | 127.0 | 105.3 | 121.2 |
| Fourth quarter 2024 | 127.9 | 105.5 | 121.9 |
| First quarter 2025 | 128.9 | 105.2 | 122.7 |
| Second quarter 2025 | 128.7 | 104.2 | 122.9 |
| Third quarter 2025 | 130.0 | 104.7 | 124.0 |
| Fourth quarter 2025 | 131.3 | 105.1 | 125.0 |
| First quarter 2026 | 132.8 | 107.5 | 125.7 |
Source(s):
Tables 36-10-0106-01 and 36-10-0105-01.
- Date modified: