
Monthly estimates of business openings and closures, February 2026
Released: 2026-05-26
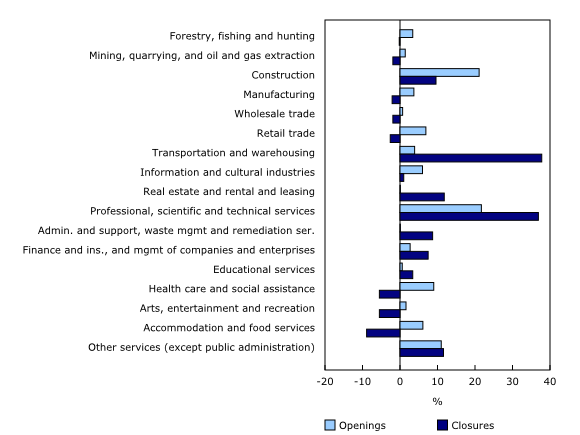
In February, the business closure rate held steady at 5.0%, 0.4 percentage points above its 2015-to-2019 historical average. From January to February 2026, the number of business closures varied little across all sectors. The largest changes were recorded in transportation and warehousing (-221 business closures compared with January) and professional, scientific and technical services (-216 closures), accounting for 74.7% of the overall variation in business closures.
The opening rate also held steady at 5.0% in February, remaining at 0.3 percentage points above its historical average. The number of business openings changed little across sectors from January to February. Professional, scientific and technical services (+274 openings compared with January) and construction (+266 openings) drove the variation in business openings, followed by other services (except public administration) (+139 openings) and health care and social assistance (+113 openings). These four sectors accounted for 62.8% of the overall change in business openings.
The number of active businesses was relatively unchanged in February as the number of business closures was close to that of openings. In the same month, payroll employment decreased by 0.3%, real gross domestic product increased by 0.2% and business insolvency filings rose by 10.1%, from 366 in January to 403 in February.
Discontinuation of this Daily release
This release marks the final monthly analytical summary accompanying the Monthly estimates of business openings and closures. The underlying data tables will continue to be published monthly through Statistics Canada's Common Output Data Repository.
For more information on the data presented in this release, see the Monthly Business Openings and Closures (5401) survey page.
Chart 1

Monthly business openings and closures as a percentage of active businesses, business sector, January 2024 to February 2026, seasonally adjusted data

Chart 2
Percent contribution of sectors to the change in business openings and closures, January to February 2026, seasonally adjusted data
Note to readers
With each release, data for the preceding month are revised as additional information becomes available. This may also involve minor revisions to historical data due to seasonal adjustment. Users are encouraged to use the most up-to-date data available for each month.
Seasonal adjustment is applied separately to each sector to account for unique patterns, which can lead to discrepancies between business sector figures and the sum of sector-specific ones.
Percentages in Chart 2 represent the contribution of each sector to the business sector's overall variation. The percentage is negative when the direction of the sector's variation is different from that of the overall variation, and it's positive when sectoral and overall variation are in the same direction.
More precisely, a sector's contribution is negative if it shows a decrease in active businesses, while the total number of active businesses has increased. Similarly, a sector's contribution is negative if it shows an increase in active businesses, while the total number of active businesses has fallen.
For more information on the data presented in this release, see the Monthly Business Openings and Closures (5401) survey page.
Contact information
For more information, or to enquire about the concepts, methods or data quality of this release, contact us (toll-free 1-800-263-1136; 514-283-8300; infostats@statcan.gc.ca) or Media Relations (statcan.mediahotline-ligneinfomedias.statcan@statcan.gc.ca).
- Date modified: