
Balance sheet of the agricultural sector, December 31, 2024
Released: 2025-06-19
$832.5 billion
At December 31, 2024
4.9% 
(period-to-period change)
$0.4 billion
At December 31, 2024
0.2%
(period-to-period change)
$3.5 billion
At December 31, 2024
2.5%
(period-to-period change)
$2.9 billion
At December 31, 2024
2.8%
(period-to-period change)
$3.3 billion
At December 31, 2024
8.3%
(period-to-period change)
$79.1 billion
At December 31, 2024
3.0%
(period-to-period change)
$234.1 billion
At December 31, 2024
1.4%
(period-to-period change)
$66.4 billion
At December 31, 2024
4.2%
(period-to-period change)
$179.5 billion
At December 31, 2024
9.8%
(period-to-period change)
$211.0 billion
At December 31, 2024
5.5%
(period-to-period change)
$52.2 billion
At December 31, 2024
6.4%
(period-to-period change)
The value of Canada's farm sector equity totalled $832.5 billion as of December 31, 2024, up by $38.9 billion (+4.9%) from the same date one year earlier. Farm sector equity growth slowed for the first time in five years, as total liabilities (+14.4%) grew at a faster pace than total assets (+6.3%). Farm equity rose in every province, with gains in Saskatchewan (+9.8%) and Alberta (+5.5%) accounting for over two-thirds of the national increase.
Chart 1

Year-over-year percentage change in the value of total assets, total liabilities and equity, 2023 to 2024

Farm real estate drives increase in total asset value
The value of total assets grew by $58.9 billion (+6.3%) from the same date one year earlier to reach $991.5 billion as of December 31, 2024. The value of farm real estate was responsible for over four-fifths of the rise in total assets value. All provinces, excluding Newfoundland and Labrador, recorded increases in the value of farm real estate. The higher farm real estate values were mainly due to gains in the value of farmland, which was up by $46.4 billion (+7.0%) to $713.3 billion in 2024.
The value of current assets fell by $461.3 million (-0.8%) to $57.9 billion in 2024, mostly due to a lower value for crop inventories. The value of crop inventories was down by $4.8 billion (-17.9%) to $21.9 billion, as crop prices dropped 14.6% and on-farm stocks decreased 3.9%. Sufficient domestic and international supplies of grains and oilseeds continued to put downward pressure on prices, which have been declining since 2023.
The value of poultry and market livestock inventories grew by $3.5 billion (+26.6%) to $16.5 billion as of December 31, 2024, on higher prices, which rose sharply (+33.2%), while the inventories declined 4.9%. Historically high prices in the cattle markets fuelled the growth in the value of inventories, as domestic and international demand was steady. The value of breeding livestock grew by $4.2 billion (+27.3%) to $19.8 billion, as a result of higher prices.
Total liabilities are up
The value of total liabilities was at $159.0 billion as of December 31, 2024, up by $20.1 billion (+14.4%) from the same day one year earlier. This was the largest percentage increase in total liabilities since the series began in 1981. More than four-fifths of the rise was attributable to long-term liabilities (+14.0%). Total liabilities grew in all provinces, with gains in Alberta (+17.4%), Ontario (+13.7%) and Quebec (+12.4%) accounting for over two-thirds of the national increase.
Chart 2
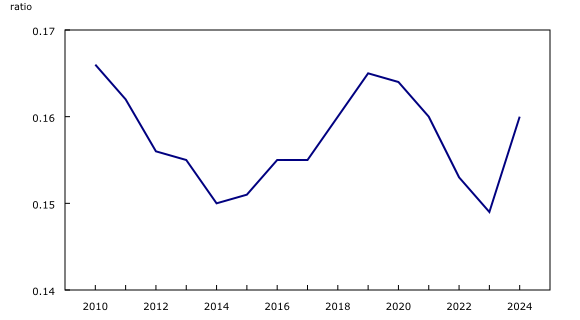
Solvency ratio—debt, Canada, 2010 to 2024
Interest coverage ratio drops to the lowest level since 2007
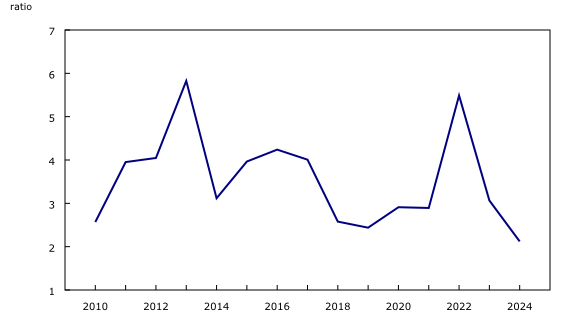
The interest coverage ratio, which measures a farm business's ability to meet its interest payments, fell for the second consecutive year, settling at 2.12 as of December 31, 2024. This was the ratio's lowest level since 2007. The interest coverage ratio continued to deteriorate because of a decrease in net farm income, which was due to the drop in crop inventories and higher interest expenses. A lower interest coverage ratio (net income before taxes plus interest expense, divided by interest expense) indicates that businesses are less able to service their debt obligations.
Chart 3
Efficiency ratio—interest coverage, Canada, 2010 to 2024
Did you know we have a mobile app?
Download our mobile app and get timely access to data at your fingertips! The StatsCAN app is available for free on the App Store and on Google Play.
Note to readers
The balance sheet of the agricultural sector provides the value of farm assets used in agricultural production, the liabilities associated with these assets and the farm sector equity as of December 31 for Canada and the provinces.
Assets and liabilities in the balance sheet of the agricultural sector include those of farm businesses and non-operator landlords (for farm real estate assets leased to farm operators and the corresponding liabilities) and exclude the personal portion of farm households. This most closely reflects the assets and liabilities used in agricultural production.
The balance sheet of the agricultural sector integrates data already produced by Statistics Canada, such as farm debt, value of farm capital, livestock and crop estimates, farm product prices, and selected data from the Farm Financial Survey. These data are subject to revision.
For more information on agriculture and food, visit the Agriculture and food statistics portal.
Contact information
For more information, or to enquire about the concepts, methods or data quality of this release, contact us (toll-free 1-800-263-1136; 514-283-8300; infostats@statcan.gc.ca) or Media Relations (statcan.mediahotline-ligneinfomedias.statcan@statcan.gc.ca).
- Date modified: