
Aircraft movement and civil aviation statistics, August 2024
Released: 2024-10-29


Highlights
In August, Canada's major and select small airports recorded a total of 547,516 aircraft movements, up 2.8% from August 2023. Itinerant movements (+0.6%) recorded a slight year-over-year increase in August 2024 to 394,326, while local movements rose 9.1% to 153,190.
At the same time, major Canadian airlines flew 8.5 million passengers on scheduled and charter services in August, with a passenger load factor of 88.9%.
Consult the Aviation Data Visualization Hub to explore aircraft movement statistics and monthly civil aviation statistics in an interactive format.
Rebound in aircraft movements during summer 2024
Historically, the months of June, July and August combined represent the busiest period of the year for the air transportation industry. Total aircraft movements in the summer of 2024 increased compared with the previous summer, rebounding following a slight year-over-year decrease in the summer of 2023. Despite the gain, overall air traffic during this period remained below pre-COVID-19 pandemic levels.
Domestic movement growth stalls in August
In August, there were 337,241 domestic movements, roughly the same (-0.3%) as was recorded one year earlier. Strong growth in activity at Pitt Meadows (+3,573 movements), Boundary Bay (+2,378) and Fredericton International (+1,418) was largely offset by reductions at Brandon Municipal (-4,113 movements), Calgary International (-1,940) and Yellowknife (-1,323). In contrast, other international traffic (outside the United States) increased 8.7% year over year to 16,767, while the number of transborder movements to and from the United States was up 4.9% to 40,318.
Chart 1

Total aircraft movements at major and select small airports, by class of operation
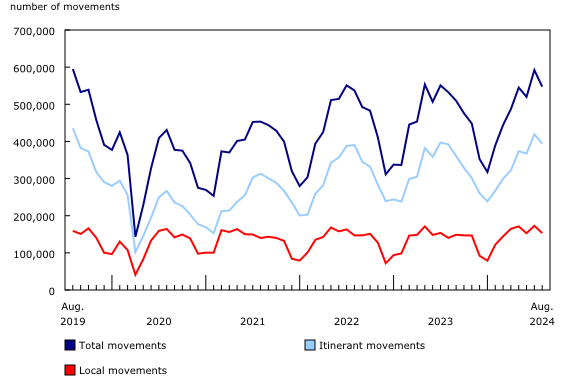
In August, year-over-year gains in aircraft movements were recorded in five provinces and territories. Airports in British Columbia (+14,214) and New Brunswick (+5,479) accounted for the largest increase in movements, led by growth in flight training activities. Toronto/Lester B. Pearson International remained the busiest airport in Canada with 34,591 movements, virtually unchanged from the level reported in August 2023.
Major airlines' operating and financial statistics
The seven Canadian Level I air carriers flew 8.5 million passengers on scheduled and charter services in August 2024, 9.5% more than in August 2023, when there were six Level I carriers. One Level II air carrier was reclassified to Level I in 2024.
The number of passenger-kilometres in August was 23.8 billion, with a capacity of 26.8 billion available seat-kilometres. As a result, the passenger load factor (the ratio of passenger-kilometres to available seat-kilometres) was 88.9%, down slightly from the 89.8% recorded in the same month one year earlier.
Chart 2
Passenger load factor, Canadian air carriers, Level I

Each passenger travelled an average of 2,819 kilometres in August, down 1.1% from August 2023. This was the third consecutive month of year-over-year decrease in average distance.
Level I carriers flew 204,000 hours in August 2024 and generated $3.0 billion in total operating revenue.
Did you know we have a mobile app?
Download our mobile app and get timely access to data at your fingertips! The StatsCAN app is available for free on the App Store and on Google Play.
Note to readers
As of reference month January 2024, Statistics Canada publishes a new consolidated monthly release called "Aircraft movement and civil aviation statistics." The new release covers the following survey programs:
- Aircraft movement statistics (survey number 2715, tables 23-10-0296-01 to 23-10-0304-01);
- Monthly civil aviation statistics (survey number 5026, table 23-10-0079-01).
The tables associated with the above survey programs remain unchanged and will be updated as usual. Definitions, data sources and methods for each survey program remain available by accessing each survey's respective number.
Consult the Aviation Data Visualization Hub to explore data from Aircraft movement statistics and Monthly civil aviation statistics in an interactive format.
The aviation statistics program uses respondent (Monthly civil aviation statistics) and administrative (Aircraft movement statistics) data.
An aircraft movement is defined as a take-off, landing or simulated approach by an aircraft, as defined by NAV CANADA.
An itinerant movement is the initial take-off or the final landing of an aircraft.
A local movement is an aircraft conducting the following airport activities: touch-and-go, stop-and-go, simulated approach without landing, low approach, pull up while on final approach or missed approach. Local movements are often carried out during training flights (touch-and-go), equipment tests, etc.
On July 11, 2024, the flight service station at Peace River, British Columbia, was officially closed. Starting in August 2024, movements for Peace River Airport are excluded from the Aircraft movement and civil aviation statistics. Data prior to August 2024 will continue to be available.
The Monthly Civil Aviation Survey covers all Canadian Level I air carriers: Air Canada (including Air Canada Rouge), Air Transat, Flair, Jazz, Porter, Sunwing and WestJet (including WestJet Encore and WestJet Link). The number of air carriers increased from six in 2023 to seven in 2024 because one Level II air carrier was reclassified to Level I.
The average passenger trip length is calculated by dividing the number of passenger-kilometres by the number of passengers. Trips across Canada and around the world are included in this calculation.
The data in this monthly release are not seasonally adjusted.
Data are subject to revisions.
Contact information
For more information, or to enquire about the concepts, methods or data quality of this release, contact us (toll-free 1-800-263-1136; 514-283-8300; infostats@statcan.gc.ca) or Media Relations (statcan.mediahotline-ligneinfomedias.statcan@statcan.gc.ca).
- Date modified: