Consumer Price Index, June 2024
Released: 2024-07-16
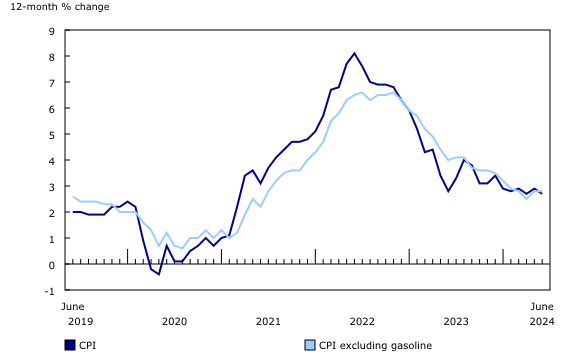
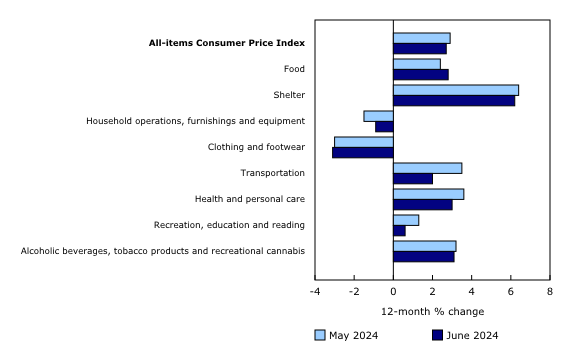
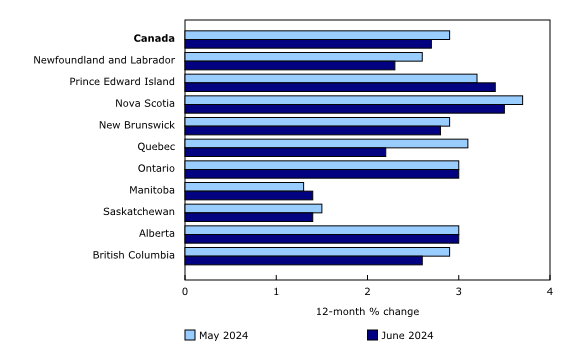
The Consumer Price Index (CPI) rose 2.7% on a year-over-year basis in June, down from a 2.9% gain in May. The deceleration was largely the result of slower year-over-year growth in gasoline prices, which rose 0.4% in June following a 5.6% increase in May. Excluding gasoline, the CPI rose 2.8% in June.
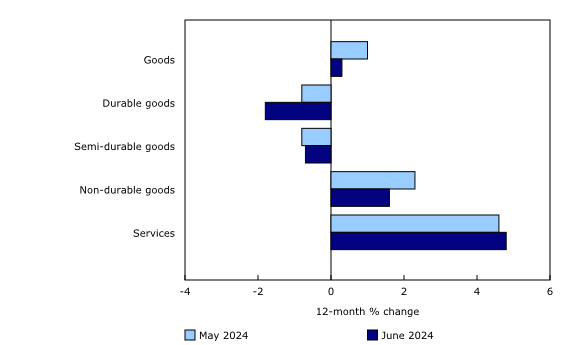
Year over year, lower prices for durable goods (-1.8%) also contributed to the slowdown in the all-items CPI in June. Moderating the deceleration was an increase in prices for food purchased from stores (+2.1%), as well as a smaller decline for cellular services in June (-12.8%) compared with May (-19.4%).
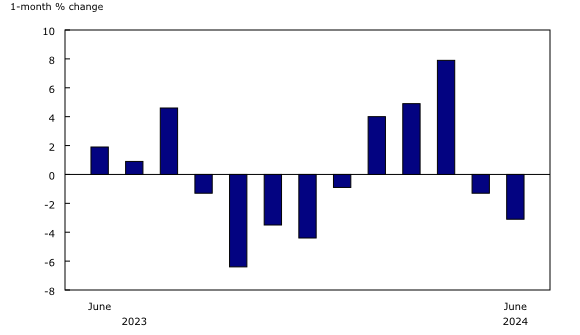
On a monthly basis, the CPI fell 0.1% in June, following a 0.6% increase in May. The monthly decrease was driven by lower prices for travel tours (-11.1%) and gasoline (-3.1%). On a seasonally adjusted monthly basis, the CPI rose 0.1% in June.
Gasoline prices rise at a slower pace
Year over year, gasoline prices rose at a slower pace in June (+0.4%) compared with May (+5.6%), stemming from a month-over-month decline of 3.1%. This monthly decrease coincided with an announcement from the Organization of the Petroleum Exporting Countries and its partners (OPEC+) to gradually phase out voluntary production cuts later this year and the restart of production for some refineries following shutdowns for spring maintenance.
Prices for durable goods continue to decline
Prices for durable goods fell 1.8% year over year in June, following a 0.8% decline in May. The purchase of passenger vehicles index contributed the most to the decrease, falling 0.4% year over year in June, the largest yearly decline since February 2015. This decline was driven by a reduction in prices for used vehicles (-4.5%) amid improved inventory levels compared with a year ago.
Additionally, prices for furniture (-3.9%) fell on a year-over-year basis in June 2024, partly attributable to the easing of supply chain issues. Higher interest rates are also impacting the spending patterns of consumers, with many spending less on discretionary goods by delaying big-ticket purchases, which may be contributing to lower demand and therefore lower prices.
Spotlight on quality adjustment in the Consumer Price Index
The Consumer Price Index (CPI) tracks price change experienced by Canadians by comparing the cost of a fixed basket of goods and services through time. Over time, products become outdated and technology advances. As a product changes or evolves, it may change in quality, with new features or enhanced services, or in quantity, such as with changes to packaging sizes. While the CPI maintains a fixed basket, quantity and quality adjustments are required to ensure goods and services remain comparable over time, while at the same time ensuring alignment with international standards for consumer price indexation.
Quality
In a process known as quality adjustment, price adjustments are made during the compilation of the CPI to account for changes in the characteristics of goods and services over time. Once the collected prices are adjusted to maintain constant quality, the remaining price difference is reflected in the CPI as a pure price change.
Quality adjustments are often required for technological goods and services to maintain constant quality because of frequent advancements and innovation. For example, prices for laptops, desktops, monitors, smartphones, smartwatches, and tablets are all adjusted when quality changes occur, as are services like cellular and Internet access services. Quality improvements, like a faster processor speed of a laptop or a higher data allowance for a cellular plan, are treated as price declines, all else being equal.
Quantity
When the quantity or size of a product is reduced, but the price stays the same, consumers are paying more for the same quantity of the product. To account for this in the CPI, the collected prices are adjusted upward to reflect the change in quantity, and the resulting price increase is reflected in the CPI as a pure price change.
Quantity adjustments are often required for food items in the CPI. For example, if a bag of potato chips has gotten smaller over time, the CPI will measure this as a price increase, all else being equal. This is often referred to as "shrinkflation."
As product characteristics change, Statistics Canada will continue to measure pure price change by adjusting for shifts in quality and quantity, ensuring an accurate CPI and alignment with international best practices.
Consumers pay more for groceries
On a year-over-year basis, consumers paid more for food purchased from stores in June (+2.1%) compared with May (+1.5%), marking the second consecutive month that grocery price growth accelerated. For comparison, from June 2021 to June 2024, prices for food purchased from stores increased 21.9%.
Price growth for some food items such as dairy products (+2.0%), fresh vegetables (+3.8%), non-alcoholic beverages (+5.6%), as well as preserved fruit and fruit preparations (+9.5%), accelerated year over year in June.
Moderating the increase in grocery prices were prices for fresh fruit, which fell to a greater extent in June (-5.2%) compared with May (-2.8%).
Explore the Consumer Price Index tools
Check out Statistics Canada's Food Price Data Hub, which features a variety of food price related statistics, articles and tools.
Check out the Personal Inflation Calculator. This interactive calculator allows you to enter dollar amounts in the common expense categories to produce a personalized inflation rate, which you can compare to the official measure of inflation for the average Canadian household—the Consumer Price Index (CPI).
Browse the Consumer Price Index Data Visualization Tool to access current (Latest Snapshot of the CPI) and historical (Price trends: 1914 to today) CPI data in a customizable visual format.
Visit the Consumer Price Index portal to find all CPI data, publications, interactive tools, and announcements highlighting new products and upcoming changes to the CPI in one convenient location.
Regional highlights
Year over year, prices rose at a slower pace in June compared with May in six provinces. Lower prices for traveller accommodation (-20.2%) contributed to the slowdown in Quebec, stemming from a base-year effect.
Did you know we have a mobile app?
Download our mobile app and get timely access to data at your fingertips! The StatsCAN app is available for free on the App Store and on Google Play.
Note to readers
Upcoming enhancements: New approach to estimating the cellular services price index
The cellular services price index will be updated with an enhanced methodology and new data sources in the coming months. A technical paper describing the new approach will be available on August 20.
Real-time data tables
Real-time data table 18-10-0259-01 will be updated on July 29. For more information, consult the document, "Real-time data tables."
Next release
The Consumer Price Index for July will be released on August 20.
Products
The "Consumer Price Index Data Visualization Tool" is available on the Statistics Canada website.
More information on the concepts and use of the Consumer Price Index (CPI) is available in The Canadian Consumer Price Index Reference Paper (62-553-X).
For information on the history of the CPI in Canada, consult the publication Exploring the first century of Canada's Consumer Price Index (62-604-X).
Two videos, "An Overview of Canada's Consumer Price Index (CPI)" and "The Consumer Price Index (CPI) and Your Experience of Price Change," are available on Statistics Canada's YouTube channel.
Find out answers to the most common questions posed about the CPI in the context of the COVID-19 pandemic and beyond.
Contact information
For more information, or to enquire about the concepts, methods or data quality of this release, contact us (toll-free 1-800-263-1136; 514-283-8300; infostats@statcan.gc.ca) or Media Relations (statcan.mediahotline-ligneinfomedias.statcan@statcan.gc.ca).
- Date modified:


