Physical flow account for plastic material, 2020
Released: 2024-03-18
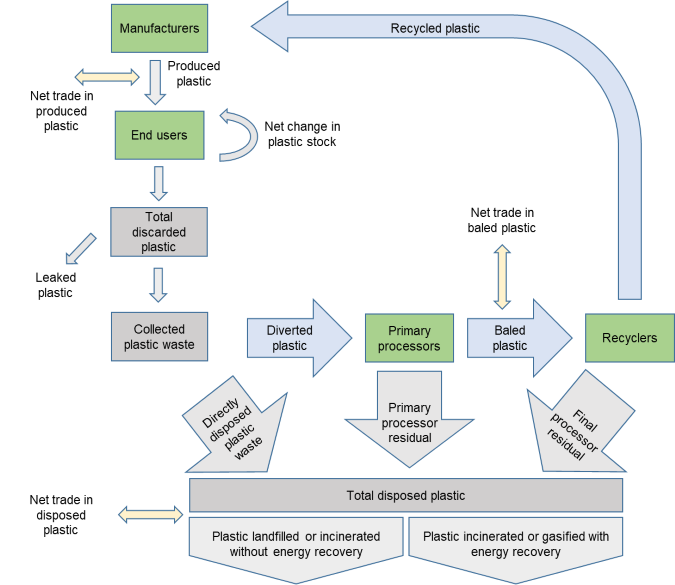
The Physical Flow Account for Plastic Material is an environmental-economic account that estimates the flow of plastic through the Canadian economy. The account provides annual estimates by product category, resin type, and province and territory. The time-series starts in 2012 and now includes 2020.
The flow begins with production, continues with use, and tracks waste and recycling.
Plastic production for Canadian consumption up slightly, but diversion and disposal down
In 2020, the amount of plastic produced for Canadian consumption was 7,121 kilotonnes (kt), an increase of 0.8% from 2019 (7,068 kt) but less than the 3.4% increase from 2018 to 2019.
In contrast, the amount of plastic directly discarded by Canadian households, businesses and institutions fell by 2.7% from 2019 to 4,928 kt in 2020. Most of the total discarded plastic in products was collected for either disposal (3,637 kt) or material recovery (1,249 kt), while the remainder was leaked to the environment as pollution. Diversion and disposal both fell during the start of the COVID-19 pandemic in 2020, going against the general upward trend since 2012. Collected plastic for material recovery declined at a faster rate (-8.8%) than plastic sent for disposal (-0.4%).
Packaging and construction materials are the main contributors to the rise in production
Packaging (+4.1%) and construction materials (+6.9%) were the largest contributors to the 0.8% increase in production. Packaging constituted 30.4% (2,167 kt) of total produced plastic for Canadian consumption in 2020, followed by construction materials, which made up 21.7% (1,546 kt).
There was a combined increase of 0.8% at the national level in plastic production for textile, agricultural film, and other plastic products in 2020. In contrast, electrical and electronic equipment and vehicles combined showed a decline of 8.5% of produced plastic.
In 2020, domestically produced items (4,475 kt) accounted for 62.8% of the total plastic produced for Canadian consumption. The remaining 37.2% came from net trade (2,646 kt), which is calculated as imports minus exports. From 2019 to 2020, net trade was down by 6.9%, while domestically produced plastic was up by 5.9%.
Plastic bottles account for the majority of recycled plastic resins
Canadian recyclers produced about 362 kt of recycled plastic resins for use by manufacturers in 2020. Material from recycled plastic bottles accounted for 60.9% of this total.
The most common recycled plastic resins were polyethylene terephthalate (PET: 31.2%), high-density polyethylene (HDPE: 26.1%), low-density polyethylene (LDPE: 9.5%) and other polyethylene (8.5%), all of which together fell by 8.4%, contributing to the national decrease in 2020 of diverted plastic for material recovery.
For the first time, Statistics Canada is releasing estimates for net trade of disposed plastic waste and scrap, which is calculated as imports minus exports. National exports were larger than imports across the time series. In 2020, Ontario, British Columbia and Manitoba were net exporters of plastic waste while Quebec, Alberta and Saskatchewan were net importers.
Did you know we have a mobile app?
Get timely access to data right at your fingertips by downloading the StatsCAN app, available for free on the App Store and on Google Play.
Note to readers
The physical flow account for plastic material (PFAPM) was created to support the Government of Canada's Zero Plastic Waste Agenda.
The PFAPM accounts for the plastic content of internationally imported and exported products as well as international imports and exports of sorted and baled plastic waste and disposed plastic waste and scrap. The PFAPM does not account for international trade of recycled plastic resin, nor does it account for interprovincial trade in sorted and baled plastic or recycled plastic resin. Because of this, the geographic dimension of estimates for recycled plastic resin represents the province or territory where the plastic was discarded, not the location of the final processor producing the recycled pellets and flakes.
The PFAPM only estimates the mass of plastic in items, not the total mass of an item itself, nor other materials that make up the item. It does not, for example, include the mass of metal in vehicles, or the fraction of that metal that is recycled.
In the account, recycled resins are produced from plastic recovered from discarded products that enter waste management streams and are processed into pellets and flakes ready for use in the production of new products.
Items that may be re-used, such as vehicles or clothes, are accounted for in the net stock of plastic in products that remain in use at the end of each year. This variable is the difference between plastic in products produced for Canadian consumption and total discarded plastic in products, and it accounts for: products that are produced in the current year but will only be discarded in future years; products that were produced in previous years and are being discarded in the current year; and products that are being discarded by one user and re-used by another, without entering a waste management stream.
In addition to releasing data for 2020, estimates for 2012 to 2019 have been updated due to revised methodology.
Contact information
For more information, or to enquire about the concepts, methods or data quality of this release, contact us (toll-free 1-800-263-1136; 514-283-8300; infostats@statcan.gc.ca) or Media Relations (statcan.mediahotline-ligneinfomedias.statcan@statcan.gc.ca).
- Date modified:

