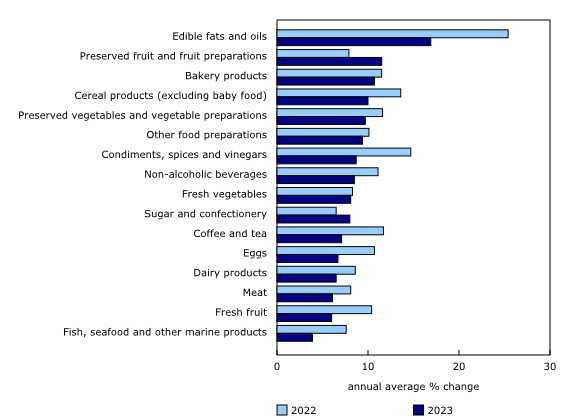
Chart 4
Broad-based price growth across grocery items

Source(s):
Table 18-10-0005-01.
Chart description
This is a bar clustered chart.
| 2022 | 2023 | |
|---|---|---|
| Edible fats and oils | 25.4 | 16.9 |
| Preserved fruit and fruit preparations | 7.9 | 11.5 |
| Bakery products | 11.5 | 10.7 |
| Cereal products (excluding baby food) | 13.6 | 10.0 |
| Preserved vegetables and vegetable preparations | 11.6 | 9.7 |
| Other food preparations | 10.1 | 9.4 |
| Condiments, spices and vinegars | 14.7 | 8.7 |
| Non-alcoholic beverages | 11.1 | 8.5 |
| Fresh vegetables | 8.3 | 8.1 |
| Sugar and confectionery | 6.5 | 8.0 |
| Coffee and tea | 11.7 | 7.1 |
| Eggs | 10.7 | 6.7 |
| Dairy products | 8.6 | 6.5 |
| Meat | 8.1 | 6.1 |
| Fresh fruit | 10.4 | 6.0 |
| Fish, seafood and other marine products | 7.6 | 3.9 |
Source(s):
Table 18-10-0005-01.
- Date modified: