Gross domestic product by industry, September 2023
Released: 2023-11-30
September 2023
0.1% 
(monthly change)
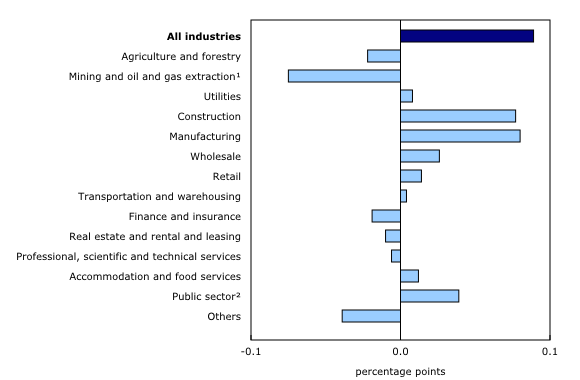
Real gross domestic product (GDP) edged up 0.1% in September. Goods-producing industries (+0.3%) led the growth with a first increase in six months, while services-producing industries were essentially unchanged. Overall, 10 of 20 industrial sectors increased.
Manufacturing up after three consecutive monthly declines
The manufacturing sector increased 0.9% in September, after contracting for three months in a row, as both durable and non-durable manufacturing grew. September's increase largely stems from higher inventory formation in the month.
Non-durable manufacturing increased 0.8% in September as the majority of subsectors were up. Food manufacturing (+3.2%) led the increase as higher animal slaughtering and processing pushed up meat product manufacturing (+5.0%) to its highest level on record. Petroleum and coal product manufacturing (-1.0%) offset some of the gains as maintenance activities were performed at several refineries in September.
Durable manufacturing (+0.9%) was up for the first time in four months in September, on higher machinery manufacturing (+4.2%). The bulk of the gain in machinery manufacturing was in agriculture, construction, and mining machinery (+8.3%), coinciding with increases in the construction sector along with maintenance activities in the energy sector.
Mining, quarrying and oil and gas extraction down on broad-based contractions
The mining, quarrying and oil and gas extraction sector decreased 1.8% in September as all three subsectors contracted.
After reaching an all-time high level in August, oil and gas extraction contracted 1.9% in September. Maintenance activities at numerous facilities across the country contributed to the subsector's decline in the month. Oil and gas extraction (except oil sands) contracted 3.6% in September as maintenance work at an oil platform off Canada's Atlantic coast contributed to the decline. Oil sands extraction edged down 0.1% as lower synthetic crude production, stemming from maintenance at a number of facilities, was largely offset by higher crude bitumen extraction.
Mining and quarrying (except oil and gas) contracted 2.0% in September solely as a result of lower metal ore mining (-3.0%). Extraction of all forms of metal ores contracted in the month, with gold and silver ore mining contributing the most to the decline, coinciding with declines in exports of unwrought gold to the United Kingdom and the United States.
Support activities for mining and oil and gas contracted 1.3%, reflecting lower drilling activities in September.
Construction activity continues to grow
The construction sector built on gains seen in August (+0.2%) with a 1.0% expansion in September.
Residential building construction increased 3.8% in September, the largest monthly gain since April 2021, with activity growing across all forms of structures. Multi-unit, single family homes and home alterations and improvements all contributed to the growth.
Partially offsetting the gains in September 2023 were engineering and other construction activities (-0.9%) which posted a third consecutive decline, following the upward trend in activity that began at the end of 2020.
Agriculture, forestry, fishing and hunting contracts for the 13th consecutive month
The agriculture, forestry, fishing and hunting sector decreased 1.4% in September as the majority of subsectors contracted.
Crop production (except cannabis) was down 2.9% in September, continuing the decline that began at the end of 2022 and reflecting lower expected yields for 2023, particularly for wheat and canola, which resulted from dry conditions in the Prairies.
Wholesale trade up for third consecutive month
Wholesale trade was up 0.5% in September, as six of nine subsectors grew. Motor vehicle and parts wholesalers drove the increase in the month. Despite disruptions in the United States motor vehicle manufacturing industry, higher imports of passenger cars and light trucks from Mexico helped push motor vehicle and parts wholesaling up 2.5% in September.
Real estate down on lower home sales in September
Real estate and rental and leasing contracted for the second consecutive month, edging down 0.1% in September.
Activity at the offices of real estate agents and brokers fell 4.1% in September, down for the third consecutive month. Home reselling activity contracted for the third month in a row across the country, with Ontario, Alberta and British Columbia contributing the most to September's decline.
Finance and insurance down in September
Finance and insurance contracted for the third time in four months, down 0.3% in September. Financial investment funds, services, and other financial vehicles (-1.4%) contributed the most to the decrease in large part due to declines in equity and fixed-income mutual fund assets as investors' expectations of an additional interest rate hike in the United States in 2023 weighed on equity and fixed income bond prices.
Arts, entertainment and recreation falls for third time in four months
Arts, entertainment and recreation fell for the third time in four months, contracting 2.1% September.
Performing arts, sports, and heritage institutions contracted 3.4%, largely as a result of fewer National Hockey League (NHL) games played in the month as the pre-season began later than usual in September. The gambling industries fell 3.1%, their largest decline since January 2022, on lower expenditures at some casinos.
Advance estimate for real gross domestic product by industry for October
Advance information indicates that real GDP increased 0.2% in October. Increases in mining, quarrying, and oil and gas extraction, retail trade, and construction were partially offset by decreases in the wholesale trade sector. Owing to its preliminary nature, this estimate will be updated on December 22, 2023, with the release of the official GDP by industry data for October.
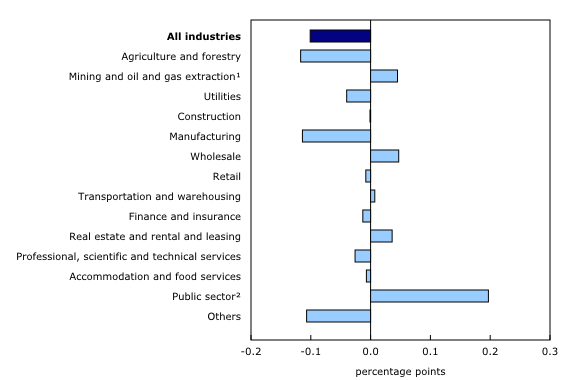
Real gross domestic product by industry edges down 0.1% in the third quarter
Services-producing industries rose 0.2% in the third quarter, up for the ninth consecutive quarter, while goods-producing industries contracted 0.9%.
The public sector rose 0.9% in the third quarter, increasing for the 13th consecutive quarter and was the largest contributor to growth, in part stemming from the rebounding of activity in federal government public administration following the effect of the strike which occurred in the previous quarter.
Mining, quarrying, and oil and gas extraction (+1.1%) was another top contributor to growth in the third quarter, driven by oil and gas extraction (+2.0%). Oil and gas extraction (excluding oil sands) rebounded from the effect of forest fires on natural gas extraction in the second quarter, while oil sands extraction continued to expand for the second consecutive quarter.
Wholesale trade (+1.0%) was among the top drivers of growth in the third quarter after being among the largest detractors to growth in the previous quarter, with several subsectors rebounding or growing at an accelerated pace. Motor vehicles and parts wholesalers and machinery, equipment and supplies wholesalers were the largest drivers of growth in the sector. Building material and supplies wholesalers posted their second gain in six quarters as residential building construction resumed growth in the third quarter following five consecutive quarterly declines.
The overall construction sector was essentially unchanged in the third quarter as increased activity in residential building construction (+3.7%) was offset by declines in engineering and other construction activities (-2.4%), repairs (-1.5%) and non-residential building construction (-0.1%). Real estate and rental and leasing (+0.3%) rose for the third consecutive quarter and was among the top contributors to growth in the third quarter. At the same time, activity at the offices of real estate agents and brokers and activities related to real estate (-2.9%) was down, as sales of homes fell from July to September, after posting a strong increase in the previous quarter.
Agriculture, forestry, fishing, and hunting (-6.9%) was the largest detractor to growth in the third quarter. The sector posted its fourth consecutive quarterly decline in large part due to weaker crop production (except cannabis) (-12.3%) resulting from drought conditions in many parts of the country. Support activities for the agriculture and forestry subsector (-3.2%) and the forestry and logging subsector (-2.7%) also contributed to the decline in the sector.
The manufacturing sector (-1.2%) also contracted in the third quarter, following two consecutive quarterly gains. Computer and electronic product manufacturing, which posted gains in the second half of 2020 and most of 2021 and 2022, has been declining since the first quarter of 2023, and was one of the largest drivers behind the sector's decline in the third quarter of 2023. Transportation equipment manufacturing tempered the decline in the sector, posting a fourth consecutive quarterly increase, mostly driven by a gain in motor vehicle manufacturing in the third quarter. Wood product manufacturing also helped temper the decline with its first increase in five quarters.
Sustainable development goals
On January 1, 2016, the world officially began implementing the 2030 Agenda for Sustainable Development—the United Nations' transformative plan of action that addresses urgent global challenges over the following 15 years. The plan is based on 17 specific sustainable development goals.
The release on gross domestic product by industry is an example of how Statistics Canada supports monitoring the progress of global sustainable development goals. This release will be used to help measure the following goal:

Note to readers
Effective with this release, the monthly gross domestic product (GDP) by industry data at basic prices will use 2017 instead of 2012 as the reference year for its chained volume estimates. This means that the data for each industry and each aggregate are obtained from a chained volume index multiplied by the industry's value added in 2017. The monthly data are benchmarked to annually chained Fisher volume indexes of GDP obtained from the constant-price supply and use tables (SUTs) up to the latest SUT year (2020).
For the period starting in January 2021, data are derived by chaining a fixed-weight Laspeyres volume index to the previous period. The fixed weights are 2020 industry prices.
This approach makes the monthly GDP by industry data more comparable with expenditure-based GDP data, which are chained quarterly.
All data in this release are seasonally adjusted. For information on seasonal adjustment, see Seasonally adjusted data – Frequently asked questions.
An advance estimate of industrial production for October 2023 is available upon request.
For more information on GDP, see the video "What is Gross Domestic Product (GDP)?."
Revisions
With this release of monthly GDP by industry, revisions have been made back to January 1997, to improve the continuity of the time series and achieve greater coherence with expenditure-based GDP.
Each month, newly available administrative and survey data from various industries in the economy are integrated, resulting in statistical revisions. Updated and revised administrative data (including taxation statistics), new information provided by respondents to industry surveys, data confrontation and reconciliation process and standard changes to seasonal adjustment calculations are incorporated with each release.
Real-time table
Real-time table 36-10-0491-01 will be updated on December 11.
Next release
Data on GDP by industry for October will be released on December 22.
Products
The User Guide: Canadian System of Macroeconomic Accounts (13-606-G) is available.
The Methodological Guide: Canadian System of Macroeconomic Accounts (13-607-X) is also available.
The Economic accounts statistics portal, accessible from the Subjects module of the Statistics Canada website, features an up-to-date portrait of national and provincial economies and their structure.
Contact information
For more information, or to enquire about the concepts, methods or data quality of this release, contact us (toll-free 1-800-263-1136; 514-283-8300; infostats@statcan.gc.ca) or Media Relations (statcan.mediahotline-ligneinfomedias.statcan@statcan.gc.ca).
- Date modified:


